The Federal Reserve has been trying hard to communicate that it intends to keep short-term interest rates low for quite some time. The market seems to have embraced the message.
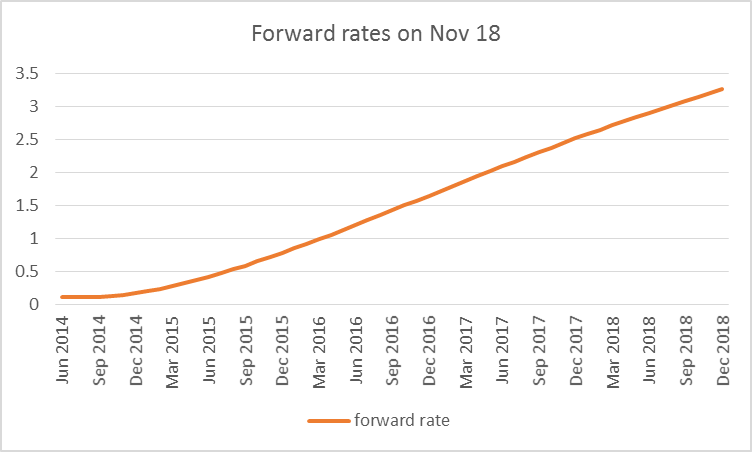
One way to summarize the yields on securities with different maturities is with the forward curve. Suppose that today I sold $1000 worth of a bond that I’ll have to pay back with interest 365 days from now and simultaneously bought $1000 worth of a bond that will pay me back with interest 366 days from now. That would leave me on net owing nothing and receiving nothing for the next year, paying out some money 365 days from now, and getting my money back with interest 366 days from now. In effect, I’ve used today’s interest rates to lock in the return on a one-day security I plan to purchase 365 days from today. The return I could get from that transaction is known as today’s 365-day forward rate.
You can’t usually buy a 366-day bond, but you can fit a smooth function to the yields on whatever bonds you can buy to get an estimate of the 365-day and 366-day interest rate, from which you can calculate the 365-day forward rate, and indeed could calculate the n-day forward rate for any value of n you might be interested in. A paper by Gurkaynak, Sack, and Wright developed a simple way to do that. You can download their summary of the yield curve for any historical date going back to 1961.
I’ve used their data (along with equation (21) in their paper) to calculate what forward rates looked like as of November 18. Their approximation is designed for the longer end of the yield curve, and the very near forward rates you’d calculate from their formula have trouble coping with the zero lower bound. For this reason, I start the graph below with the 6-month forward rate. The date in the future at which I would earn my one-day yield is plotted on the horizontal axis, and the yield at an annual rate is on the vertical axis. The forward curve implies overnight rates that remain below 25 basis points through the end of 2014, and only rise very slowly after that, with the rate still below 2.5% until the end of 2017.
 |
It’s interesting to compare that gradual slope with the actual historical path of short-term interest rates, as summarized by the graph below of the fed funds target.
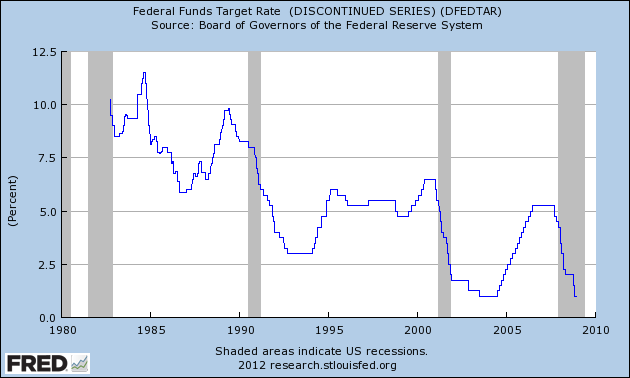 |
The table below summarizes what happened during the previous 4 episodes of Fed tightening. These lasted for one or two years and resulted in an increase of the overnight rate of between 175 and 425 basis points. During an average tightening episode, the short-term rate went up by 22 basis points per month. That compares with an average increase of 6 basis points per month implied by the forward curve for a monetary tightening beginning in 2015.
| Start | End | Change in target | Change per month |
|---|---|---|---|
| Mar 29, 1988 | Feb 24, 1989 | 3.25 | 0.30 |
| Feb 3, 1994 | Feb 1, 1995 | 3.0 | 0.25 |
| Jun 29, 1999 | May 16, 2000 | 1.75 | 0.17 |
| Jun 29, 2004 | Jun 29, 2006 | 4.25 | 0.18 |
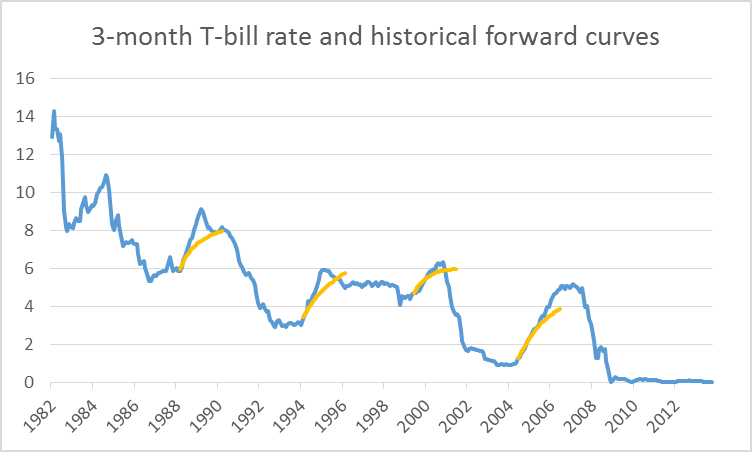
I was curious to go back and see what the forward curve was signaling prior to each of these four episodes. The blue line in the graph below plots the 3-month Tbill rate, while the orange segments show the forward curve looking ahead up to 2 years from the date before the episode began. The forward curve was much more steeply sloped as those episodes began than it is today, and anticipated the Fed tightening fairly well.
 |
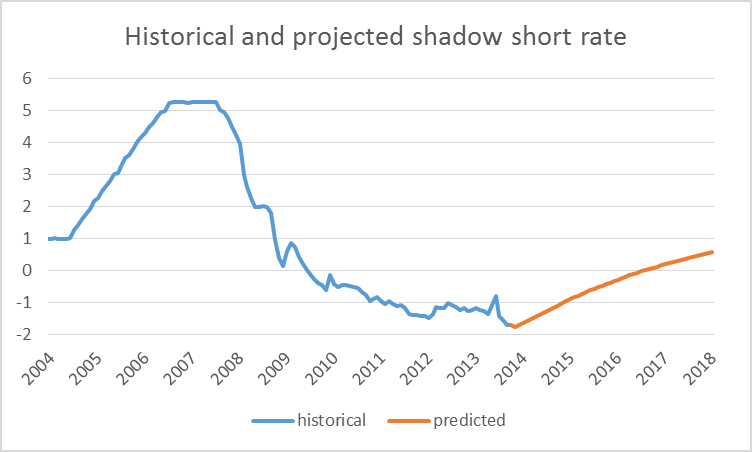
A good deal of economic research has established that there is a risk premium built into these forward rates, particularly as you use them to describe a transaction farther into the future. There are a number of different models people have developed to try to estimate this risk premium. However, the direction of this risk premium suggests that a rational forecast of the short rate would be even lower than the path implied by the forward curve in the first figure above. This for example is the implication of the calculation of the risk premium that comes out of a model of interest rates developed by Wu and Xia (2013) that I described a couple of weeks ago. The Wu-Xia forecast of the shadow rate– a theoretical construct on the basis of which all other interest rates get determined– doesn’t begin to turn positive until September of 2016.
 |
Based on current interest rates, the market thus appears quite convinced that the Fed is indeed not going to begin raising short rates for some time, and that, when it does finally begin to raise rates, it will do so much more slowly than was the case in any of the 4 previous tightenings. Partly this might be judged a success of the Fed’s forward guidance communication efforts, and partly a conclusion that conditions just aren’t going to be strong enough to lead the Fed to want to raise short-term rates for some time. The table below summarizes what the data for unemployment and inflation (as measured by the year-over-year change in the PCE deflator) were like at the start of each of the four historical tightening episodes.
| Episode | Beginning unemployment | Beginning inflation |
|---|---|---|
| 1988-89 | 5.7 | 3.7 |
| 1994-95 | 6.6 | 2.1 |
| 1999-2000 | 4.3 | 1.6 |
| 2004-2006 | 5.6 | 2.5 |
| Average | 5.6 | 2.5 |
| Nov 2013 values | 7.3 | 0.9 |
The lowest inflation rate at which the Fed began any of these cycles was 1.6% while the highest unemployment rate was 6.6%. For comparison, the inflation rate currently stands at 0.9% and the unemployment rate at 7.3%. In its most recent policy statement, the FOMC said that it “currently anticipates that this exceptionally low range for the federal funds rate will be appropriate at least as long as the unemployment rate remains above 6-1/2 percent, inflation between one and two years ahead is projected to be no more than a half percentage point above the Committee’s 2 percent longer-run goal, and longer-term inflation expectations continue to be well anchored.” The Survey of Professional Forecasters is anticipating that the unemployment rate won’t be down to 6.6% until 2015, at which time PCE inflation will still only be 2.0%.
It is possible that the Fed will announce a slowdown in the rate of large-scale asset purchases sometime soon, which could affect the long end of the yield curve. But the market is pricing in little risk of a significant move in short rates any time soon. Some might count this as a success of the Fed’s communication strategies. But it could also be interpreted as a market consensus that robust growth for the U.S. economy is not coming any time soon.
“I’ve used their data (along with equation (21) in their paper) to calculate what forward rates looked like as of November 18. Their approximation is designed for the longer end of the yield curve, and the very near forward rates you’d calculate from their formula have trouble coping with the zero lower bound.”
JDH, can we also get a good approximation of the forward rates you’ve calculated by looking at prices in the federal fund futures markets? What do you think are the similarities/differences between the two approaches?
JP Koning: I’d expect fed funds or eurodollar futures to give similar answers as the Treasury forward curve at the 6-18 month horizons, and better for the near horizons. There are some insitutional peculiarities with the fed funds market recently that make those numbers a little less meaningful than they once were. The Treasury yield curve is conceptually cleaner, though as I say you really shouldn’t use the GSW approximation to say anything about a horizon shorter than 6 months.
Such a pity that G. William Miller wasn’t available for the Fed job.
With his sure touch and a president so like the one we’ve got, exciting stuff can happen on the inflation expectations front – and so much faster than the most learned observers expect.
https://app.box.com/s/8dnvx3vomeov1c16e5em
https://app.box.com/s/yd19y0tfhx3nknf0zyhw
http://www.hussmanfunds.com/wmc/wmc131111.htm
ZIRP and unprecedented bubbly $1 trillion a year expansion of bank reserves has resulted in the stock market bubble horse having bolted from the the barn in ’11 coincident with “the Twist” and later “all in”, and the horse is now at full gallop.
As Hussman points out above, we are seeing Sornette’s texbook super-exponential, log-periodic acceleration and cyclical blow-off trajectory that precedes stock market tops and is followed by “anti-bubble” crash waves.
The 55- to 56-month change and its terminal blow-off phase is part of the ~70-month rhythm of the stock market.
The previous four times the S&P 500 achieved an order of exponential increase or more, as today, occurred in 1998-99, 1987, 1937, and 1928-29. The subsequent average decline was 45-50%.
To say there is no US stock market bubble, or that there are no bubbles anywhere, is dishonest, uninformed, or one is not paying attention.
Today’s bubbles in stocks, corporate bonds, real estate, trophy properties, farmland, bank reserves, collectibles, vintage cars, student loans, subprime auto loans, and more are global and unprecedented in scope and scale.
All bubble burst, and the largest bubbles burst spectacularly. We have the largest bubble in history, therefore, we should prepare for the biggest bursting of credit and asset bubbles in history.
BTW, for those who believe that a stock bear market and recession cannot occur until a year or more after the central bank tightens reserves and the yield curve inverts, note that bear markets and recessions are not caused by central bank tightening and inverted yield curves during debt-deflationary regimes as we have today. Japan has had three big bear markets and recessions after ’96 without the BOJ tightening reserves, and there has been no yield curve inversion; and the same thing occurred in the US after 1931 into the 1950s.
There won’t be Fed reserve tightening and an inverted yield curve to warn of a bear market and recession for many years to come.
Recessions and bear market during debt-deflationary regimes occur because of the failure of the rate of change of wages, profits, and output to service existing private debt, often triggered by successive banking crises or corporate debt defaults that cascade through the banking system and financial markets.
With non-financial corporate debt and equity market cap now cumulatively increasing in absolute terms by ~$6 trillion from a year ago and at a scale to GDP matching the debt bubble in ’06-’07, along with the super-exponential stock market blow-off, we’re due yet another debt and asset price wipeout.
No bubbles? Yeah, right.
Hussman’s open letter to the Fed about the bubble:
http://www.hussmanfunds.com/wmc/wmc131125.htm
We have been sufficiently forewarned, but the Fed and banksters’ job is to inflate until it’s too late and then attribute the subsequent crash to “unpredictable”, “exogenous” factors while assuming no responsibility for having been the principal enablers of the bubbles they never see.
Apart from charging interest on reserves, about the only tool besides Yellen’s tongue and jawbone to pull back on the manic animal spirits is to increase margin requirements to take the bubbling teapot off a high boil. But then Yellen risks burning her CTRL-P finger and being the banksters’ patsy for pricking the bubble.
Yellen is easy prey for the lobby, and everything what will come is crystal clear.
An interesting comparison would be forward rates on Nov 18 vs forward rates just after the June FOMC meeting. In June, markets seemed to think the sooner the Fed began tapering, the sooner they would increase short rates. This view seems to have changed as a result of Fed officials repeating their intentions many times.
Dan White: Negative interest rates a desperate act:
http://www.independent.ie/business/irish/dan-white-negative-interest-rates-a-desperate-act-29779180.html
Fed’s reserve hint may help ECB rate cut to negative territory:
http://www.marketwatch.com/story/feds-hint-may-help-ecb-rate-cut-to-negative-territory-2013-11-25?link=MW_latest_news
And almost no one is making any connection between a discussion of negative interest rates in OECD countries and negative post-2005 growth rates in Global Net Exports of oil (GNE) and in Available Net Exports (GNE less CNI).
Global Public Debt Versus GNE/CNI Ratio* for 2002 to 2012:
http://i1095.photobucket.com/albums/i475/westexas/Slide2_zps01758231.jpg
Annual Brent Crude Oil Prices Versus GNE/CNI Ratio for 2002 to 2012:
http://i1095.photobucket.com/albums/i475/westexas/Slide1_zps5f00c6e5.jpg
GNE/CNI Ratio 2002 to 2012, extrapolated to 2030:
http://i1095.photobucket.com/albums/i475/westexas/Slide1_zps9ff3e76d.jpg
*GNE = Combined net exports from (2005) Top 33 net oil exporters, total petroleum liquids + other liquids (EIA)CNI = Chindia’s Net Imports
The Federal Reserve has backed itself into a corner. It has spent decades building its “credibility” as an inflation fighter, so much so that no one even believes them when they give guidance on future low interest rates. This forces them to extreme, inefficient measures like quantitative easing. Even the mention of tapering signals that the Fed is back to their old inflation fighting ways. Nobody really believes the Fed is really more than tangentially interested in fighting unemployment.
Professor Hamilton,
Would you consider giving us a bit of a primer on how short-term rates determine long-term rates? The influence of short-term rates on long-term rates seems confusing given that there can be a “normal” yield curve at times and an inverse yield curve at other times.
http://www.calculatedriskblog.com/2013/11/case-shiller-comp-20-house-prices.html
http://research.stlouisfed.org/fred2/graph/?g=oTW&dbeta=1
http://research.stlouisfed.org/fred2/graph/?g=oTX&dbeta=1
Shiller’s indices and real wages:
http://research.stlouisfed.org/fred2/graph/?g=oTY&dbeta=1
http://research.stlouisfed.org/fred2/graph/?g=oTZ&dbeta=1
Remember, bubbles cannot be recognized in real time by the Fed or anyone else. Bubbles are only realized after they burst. Bubbles only burst because of some “exogenous” causal factor that cannot be predicted in advance. Fed policy and bankster mischief, moral hazard, and reckless lending and financial speculation are never the cause, i.e., “endogenous” factor.
Therefore, tell all your family, friends, colleagues, and anyone you meet on the street: It’s not a bubble. It’s NOT a bubble. IT’S NOT A BUBBLE!!!
There is much to be said for Bruce’s reference to Hussman on bubbles. Hussman’s work is economics as it should be done. Interestingly, Hussman references a seminal work by Sornette. Hussman goes on to say: “The most important test of any valuation measure is how closely that measure is related to actual subsequent returns over a period of several years.” This generalizes to a fundamental statement that holds true in all of science. Namely, that the test of any theory is in its predictability.
At the core of Hussman’s stock market work is the Kalecki equation. Mainstream economics gives short shrift to the work of anyone outside its reigning paradigm. Kalecki was outside the mainstream. Minsky, also, was outside the mainstream. Yet anyone who studied Minsky could see the housing bubble for what it was and anticipate the inevitable crash ahead of time. Some handful certainly did, and did so for precisely this reason. Similarly, ostracized is Austrian economics in its entirety. Neoclassical Keynesianism relegates the work of a long string of Austrian economists from Menger to Rothbard to the economic hinterland. Yet Austrian economics has powerful predictive ability, and Keynesian economics does not. It was not Keynes who in the 20s saw the potential damage of that credit bubble coming. It was von Mises and Hayek.
There is a common thread. Kalecki’s equation (as applied) takes cognizance of time . Minsky’s work on financial instability implicitly if not explicitly requires time for the forces of credit-turned-into-debt to go to excess and wreak their havoc. Austrian economics has an appreciation for time at its very core. Keynesian economics, on the other hand, is wholly short-term, virtually timeless. It is a special theory not a general one. In the deepest trough of a recession (in especially deep recessions/depressions) there is merit to fiscal stimulus. But merit in the short-run quickly runs to dismerit in the longer-run, as the sequence of short-runs by definition constitute the long-run. And, as forces emanating from short-run policy actions cumulate and eventually have their downside at some moment in the future. The stimulative impact of deficit spending is salubrious for a short moment. The precise endpoint of that moment, varying according to historic context, comes when the (mostly future) costs of the cumulative deficits turned into debt overcome the short term benefits. This is the essential insight of Reinhart Rogoff. It also puts in stark relief the primacy of the long-term multiplier over the short-run. Models set up to estimate the multiplier that do not have a theoretical structure accounting for the long run (in particular debt), are entirely misspecified. From the outset then, a broad swath of papers in the literature are invalidated in this manner.
Unintended consequences do not happen, other than in a second-order sense, in the current period. They unfold over subsequent time periods. The Fed is currently engaged in what is essentially an experiment – an experiment never before tried. The Fed’s core model is short-term. Yet sequentially throughout history, the perturbations that most damaged future economic growth and potential came about because a short-term remedy was applied (perhaps rightly at the moment) but then overdone. This leads naturally – as any researcher in any field who operates in the scientific spirit of impartial objective (non-ideological) judgment in full integrity would ask of his or her results – to the question: What are the unintended consequences of (a) ZIRP and (b) QE? This question embraces time. That it is harder to answer matters not. The complete flow of costs and benefits is what is important.
Perhaps the most important economic question of the day is what are the unintended consequences of the Fed’s current policy?
Underneath this is a deeper more profound question. What is it that blinds highly intelligent individuals degreed in economics to the importance of the concept of time? Political ideology, naivety, being inculcated with beliefs from the very beginning in principles courses, and lack of imaginative and critical thinking come to mind as starters. Beliefs are hard things to shake. In the social sciences, they get planted in susceptible minds at a young age (18-year olds taking Econ 101 and 102) from professors who generally have an ideological axe to grind. Few people in this world have the ability to think seminally. This inability is not a criticism, but an easily perceived fact. We have, then, the blind teaching the blind. Occasionally – very rarely – there comes along a one-eyed. These are the great seminal thinkers in any field. The test of their insights is how well they predict. Another rule of thumb is the clarity of their writing. Read Feynman in physics, Darwin on evolution, Gibbon and Quigley on history, Churchill on statesmanship, Drucker on management. And then Carl Menger and John Maynard Keynes on economics. Of these latter two, the writing of the one is a pinnacle of clarity. The other is a muddle of confusion and obscurity.
Speaking of NO bubbles:
https://app.box.com/s/28neshreq13swcon7qu9
https://app.box.com/s/ip2j7gwyn9sylf1xupev
This is the result of “all in” via QEternity and the TBTE banks directing the Fed to incessantly talk up equity prices allegedly to induce the dubious “wealth effect”. Rather, it should be referred to as the “wealth-transfer effect”, as asset bubbles result in debilitating rentier claims against future labor product, production, profits, gov’t receipts for social goods, and growth of real GDP per capita.
The Wilshire 5000 to GDP is back to the bubbly levels of 2007 and 1999, whereas the Wilshire Small-Cap Index is the bubbliest of all at nearly 120% of GDP, increasing the probability of a 55-60% to 75-80% crash at some point hereafter.
Historically, secular bear markets do not resolve until the excess inflation- and currency-adjusted gains (and prices to GDP) are wiped out, returning adjusted prices to the point at which the preceding secular bull market began, leaving an investor trough to trough a real total return of no more than the average dividend yield (before taxes and fees) over the secular bull and bear market eras. This implies that adjusted for CPI and currency effects, the average return an investor will have received will be ~2% less fees and taxes.
It is disingenuous, irresponsible, and just plain inaccurate for the Fed to claim that there is no bubble in asset prices or that bubbles cannot be discerned in real time. This is an empirically demonstrable falsehood.
Why are Fed officials perpetuating the falsehood? Who benefits? Who is at risk? What can be done about it once the bubbles are in full manic mode, as is the case today?
Further bank reserve expansion by the Fed/TBTE banks and public denial of the obvious bubbles everywhere as a result only encourages larger bubbles, GROSS mispricing of assets and misallocation of savings and resources, and a larger crisis when the bubbles eventually burst.
Rather than demi-god worship of Fed officials, we should be calling them to account to affirm the obvious and admit their culpability in encouraging, sustaining, and legitimizing massive asset bubbles and the resulting misallocation and wealth and income concentration.
Where are the establishment economists and financial media influentials who will state the obvious in public?
Very informative. I wonder what (if any) role is played by the fact that Greenspan infuriated many investors after the dotcom crash by raising rates he had promised to keep low. Bernanke and Yellen were both in his Fed and voted with him on everything. So who is to trust their ‘forward guidance’ now?
If anyone is in the mood for reviling Greenspan for his failures, some of the mud should splash on both Bernanke and Yellen.
jbh,
there was one group of economists who insisted on austerity, tightened monetary policy, and simply let the market crash and rebuild from the ashes. to invoke stimulus, fiscal or monetary, would simply unleashes the bond vigilantes. interest rates would skyrocket. we needed to punish the spenders.
then there was a group who said you could invoke stimulus-fiscal and monetary-and interest rates and inflation would remain subdued. demand was constrained, and unless you stimulate demand the economy would remain depressed. austerity was not good in times like this.
both groups had models. we can compare their predictions. we have several economic experiments-the us, europe-periphery and core, china, emerging markets. whose models were better?
Baffling: The best models are those that predict. The best economic system is that which respects the free will of all participants. The best monetary system is the one with sound money, that being gold-based. Fiat money being at the opposite extreme. The best fiscal policy is one of balanced budgets over the cycle. The best government is a limited one. All others tend to tyranny. The civilization that survives is that which puts aside an adequate surplus. These conditions, appropriately modified for externalities, make for an antifragile economy with optimal sustained growth of the standard of living for all people. Especially, for those who take responsibility for themselves and their actions. Questions like yours – stuffed on the one side with controlling Orwellian wordspeak like austerity, crash, and ashes – are strawmen. Such language is replete in your posts. You abuse the logic of our everyday language. No wonder you are baffled.
jbh,
“The best models are those that predict.”
Actually the best models are the ones which provide enhanced insight into the workings of the system under consideration, whether they be an economy or physics. predictive capabilities is limited by the accuracy of your input (boundary conditions), which often times is not well know in real time. garbage in-garbage out. i don’t think you fully understand this distinction.
“The best monetary system is the one with sound money, that being gold-based. Fiat money being at the opposite extreme.”
Says who, you? A gold based monetary system is subject to the whims of the guys who dig the useless metal out of the ground. How much do you trust them? It is also subject to the whims of the wealthy, who can buy the gold and thus influence its supply to the market. No distortion there? Price stability for your entire economy is subject to the whims of people who can monopolize the gold market. and with soooo much wealth concentrated in the upper 5% of the population, you think this cannot occur? Money as gold is too easily manipulated. Your economy is constrained to grow with the supply of gold coming out of the ground-that is a ridiculous constraint to put on an economy.
“The best fiscal policy is one of balanced budgets over the cycle. ”
An economy is not a company. if everybody balances a budget during a downturn, then absolutely no expansion can occur because everybody is practicing austerity to balance their budget. there is no exit from this cycle of contraction. until you can acknowledge the difference between an economy and a company, you are bound to repeat the mistakes of the past.