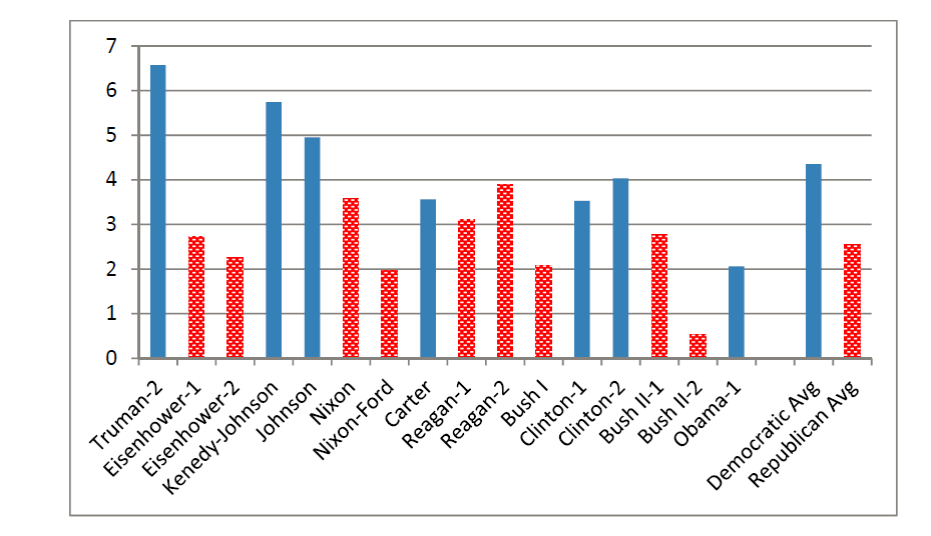
An interesting new research paper by Princeton Professors Alan Blinder and Mark Watson examines differences in performance of the economy under Democratic versus Republican presidents. The paper begins:
The superiority of economic performance under Democrats rather than Republicans is nearly
ubiquitous; it holds almost regardless of how you define success. By many measures, the
performance gap is startlingly large–so large, in fact, that it strains credulity, given how little
influence over the economy most economists (or the Constitution, for that matter) assign to the
President of the United States.
|
After documenting that the difference in economic performance between Republican and Democratic administrations is statistically significant and highly robust,
Blinder and Watson go on to investigate what accounts for the difference. They find little statistical explanatory power in any differences in monetary or fiscal policy under Democrats compared with Republicans. Instead, one of the variables that they find did seem to play a role is oil price shocks. The Suez Crisis of 1956-57, OPEC oil embargo of 1973-74, Iran-Iraq War beginning in November 1980, and Iraq’s invasion of Kuwait in 1990 all occurred during Republican terms, and all seemed to contribute to weak performance of the U.S. economy. Jimmy Carter was the one Democratic president unfortunate enough to be in office during a similar episode (the Iranian revolution in 1978-79), and ended up with one of the weakest economic records of the Democratic presidents. Although the public may end up blaming the American president for events like these, a reasonable person could well regard geopolitical conflict in the Middle East as largely beyond the power of the U.S. president to contain or control.
Another factor that the authors find quite important is variation in total factor productivity. For example, the productivity gains associated with the move to big box retailers in the 1990s appear to be a key factor in the strong economic performance during the Clinton administration. Although economists do not have a good understanding of the ultimate drivers of productivity, it again seems hard to make the case that the U.S. president is responsible for an important part of the variation.
A third factor that the researchers identify as potentially important is consumer confidence. For whatever reason, consumers on average have had a brighter outlook on the economy when a Democrat was in the White House. In Blinder and Watson’s statistical analysis, this seems to account for about a quarter of the D-R performance difference.
The authors conclude:
Democrats would no doubt like to attribute the large D-R growth gap to better
macroeconomic policies, but the data do not support such a claim….
It seems we must look instead to several variables that are mostly “good luck.” Specifically,
Democratic presidents have experienced, on average, better oil shocks than Republicans, a better
legacy of (utilization-adjusted) productivity shocks, and more optimistic consumer expectations
(as measured by the Michigan ICE).
I wish economists would just take the entire period from 1946 through 1973 and just forget it ever happened.
The economy was strong in those years because it was strong. What factors caused that strength, we cannot say.
They have no explanation for why the economy was so good during those years (Eisenhower years excepted, aparantly!) and using those years just screws up any analysis of longer term trends.
Good article.
I would suspect some of the different consumer confidence is due to the differing tone of media coverage on the economy, emphasizing the bad during Republican administrations and the good during Democratic administrations).
Maybe not so pronounced in earlier years, but since at least Bush I the bias has been pretty clear.
The Engineer,
Why you say that? There is plenty to learn from that period. Great demographics, low debt, responsible consumer behavior, moderate monetary policy, responsible fiscal policy, reasonable prices for housing, education, and health care…
Basically the exact opposite of everything we have now.
Take away the color coding and political labels, and the thing that stands out is a strong downward trend in the growth rate throughout the period, from >4% to
Note that the post-WWII era started with huge debt/GDP, but that was quickly erased by a combination of balanced budgets and serious inflation – a cumulative devaluation of 34% in the three years 1946-48. Might a quick, one-time devaluation followed by a sound dollar and balanced budget be a way out of our current morass, too?
I appreciate the paper but the results aren’t “stunning”; versions of these facts have been around for some years and I believe this blog has covered aspects of that conversation. I know the topic of stock market returns – p5 of the paper – as well as job growth and changes in the national debt have been covered at length.
So to try to say something interesting since this isn’t really a new topic but one which has been around long enough that rational people should have thoughts about it:
1. Confidence is related to presidential tone. Those who immediately jump to “media bias” as an explanation should read p26 of the paper: the difference is rooted in consumer durables and business investment. That is “put your money where your mouth is” actual hard dollars spent now for the future, which is not the same as the media portraying GWBush as a dolt or the like.
Why tone? My guess is the nature of conservatism has become less in tune with the actual needs of the economy, that what it believes isn’t as pro-growth as it thinks. I’m trying to avoid ascribing backwards today’s obsession with cutting – which is a disinvestment message which hurts future productive capacity – because Reagan’s tone was highly confident and GOP presidents used to believe differently about spending.
2. The important takeaway will I’m sure be lost because this topic is brought up in each election cycle and is a constant subject of Menzie’s posts about Gov. Walker: the GOP promises of economic bursts of growth and their castigation of Democratic policies as anti-growth are simply wrong. I’m not saying the GOP is just wrong, wrong, wrong but that the promises made are bullshit pie-in-the-sky nonsense. This has substantial meaning when you think of the massive changes forced through in the name of economic growth. The record of the past – and the relative performance of a state like WI today – says these changes don’t really help. But I expect all that to be forgotten tomorrow.
Last bit of my comment was truncated.
Take away the color coding and political labels, and the thing that stands out is a strong downward trend in the growth rate throughout the period, from greater than 4% to less than 2%. Secular stagnation?
Jonathan,
Consumer durables and business investment are an effect of consumer confidence.
“Presidential tone” is filtered through the media.
A 2004 Federal Reserve paper found that media coverage significantly influences consumer confidence.
Over such a long period you shouldn’t look at the growth rate of just GDP. You need to look at the growth rate of GDP per capita. Personally I think it is even better to look at GDP per person in the labor force. Strong GDP growth post WW-II can largely be explained by woman switching from work that is not counted in GDP to work that is counted in GDP.
Professor Hamilton
Graphs of data can be illuminating but also frustrating. Illuminating in this case, Blinder, as is usual for him, writes well, does extensive research, and is willing to ask meaningful questions of the direction of his research.
In my case I find the exclusive use of a bar graph frustrating. I would think the addition of a line graph showing the gdp growth rate would be helpful in discovering the trend of policy during each 4 year trend. This would possibly give insight of long term results of policy as well as some information as to why the voters may or may not chosen the opposite party.
I would also find informative if the 4 year segments of the bar graph could be shown in 1 year later segments. That is, policy of the first year of any term is generally dominated by the policy of the preceding term. For example, Carter came to office in January of 1977, but his first budget, at best, would have started in October that year. Thus it might be better if the average growth rate for Nixon-Ford be calculated in the period of ’74 through ’77 rather ’73 through ’76 and Carter’s ’77 through ’81. Perhaps this would better indicate the effects of each term’s policy.
This is actually a more interesting paper than I initially thought.
Some thoughts:
– By B&M’s metrics, Obama is the worst Democratic President since at least Wilson, and arguably since the Civil War. He has certainly posted the weakest performance in the socialist era (post-1929 in the US). On the other hand, if I believe my own thesis, Obama has had to cope with an ongoing oil shortage (too drawn out to call it a “shock”) during his presidency. Even so, I would consider him an exceptionally weak president. No vision beyond simple redistribution, no management skills.
– Carter is unfairly maligned. His economic performance was better than his reputation. He had the misfortune of the second oil shock and the Iranian hostage episode. Carter was unloved, but not as bad as his critics portrayed him.
– Reagan’s performance, by contrast, was not as good as everyone recalls.
– Clinton was the best Republican since at least Eisenhower, and probably Coolidge. His polices–reducing the size of government and achieving a balanced budget–were far more conservative (and ostensibly Republican) policies than any Republican since Hoover. He is the only President in my memory whom I would consider a clear success. In an emotional sense, Reagan is right up there–but keep in mind that his second term coincided with the collapse of oil prices that signaled the start of the Great Moderation.
– Bush I and II will be unheralded by historians, and I’m not going to help them out, either.
– Johnson had great GDP growth and didn’t run for a second term. He left Nixon quite a mess to clean up. He arguably also destroyed the fabric of US society with his Great Society programs.
– Nixon’s policies were really more left, than right, leaning. EPA, wage and price controls, etc. He’s the anti-Clinton. He also had the very unfortunate task of running the US during the Vietnam war and struggling with the first oil shock–both stressful and depressing events.
– I think perhaps Eisenhower was the greatest surprise to me. His relatively weak performance was unexpected–might be worth a post of its own.
Finally, left leaning governments are associated with better economic performance in the US and Canada, but neutral to worse performance in France, Germany and Great Britain.
W.C. Varones: “Great demographics, low debt, responsible consumer behavior, moderate monetary policy, responsible fiscal policy, reasonable prices for housing, education, and health care…”
Right, and not to forget wage gains and oil production of 4-6% and the constant$ price of oil and gasoline at $10-$20 and $1.50-$2.00 throughout the period.
“Might a quick, one-time devaluation followed by a sound dollar and balanced budget be a way out of our current morass, too?”
In nominal terms, the US$ fell over 42% from 2002 to 2011 (30% from par), which was the similar scale of nominal devaluation under FDR when the gold-exchange US$ was devalued when the price of gold was raised from $20.67 to $35, resulting in a ~27% “deflation-adjusted” US$ devaluation to gold.
However, in CPI- and gold-adjusted terms today (including the price of gold adjusted for CPI and the US$), the US$ fell 90-95% from 2002 to 2011, which was more than an order of exponential magnitude larger than the devaluation in 1933, similarly adjusted.
Moreover, the CPI- and gold-adjusted devaluation of the US$ in 1973 to 1980 was the same scale at ~90-95%.
So, we’ve already had a MASSIVE currency devaluation of ~98% since the bankers and oil companies via Nixon removed the US$ from gold in 1971-73 (precipitating the OPEC Oil Emgargo, Yom Kippur War, and oil price shocks of the 1970s-80s), and 90% since the onset of the slow-motion depression in 2000-01; and the result has been the further accumulation of public and private debt and financial bubbles to GDP and wages that will constrain further debt to GDP real GDP per capita indefinitely hereafter.
How much might one propose the US$ be devalued against CPI and gold hereafter? Another 90-98%? How high for the price of oil in that event? $450? $900? $1,000?
How many imperial wars for oil around the world will have to be funded as a result?
How long before our Battle of Adrianople? Have we already experienced it?
Will the gov’t begin paying imperial auxiliaries and foreign mercenaries in gold and demanding payment in gold for higher capital gains and estate taxes of the top 0.1-1%? 😉
Steven, recall that Clinton benefited from the peak Boomer demographic bubble effects, including the rate of change of increase of peak earnings, spending, and wealth accumulation coinciding with financial deregulation, the dot.com bubble, and the surge in capital gains tax receipts that resulted in the fiscal surplus.
So, Clinton got lucky, too.
But Clinton-era policies and resulting financial bubbles also set us up for the dot.com crash and the US and UK’s (Gordon Brown admitted it) overt attempts to replace the stock market bubble with a real estate bubble, which worked too well and again set up the subsequent crash in 2008-09.
Now we have policy actions that have resulted in YET ANOTHER series of bubbles, this time in corporate debt, bank reserves, stocks, real estate, securitized real estate land rents (gov’t-sponsored repackaging of the 2000s bubble), nat gas, deficits to GDP, subprime auto loans, student loans, farmland, trophy properties, and a bubble in the number of people saying that there are no bubbles anywhere. Whew! Did I miss any?
W.C. Varones, I agree with you wholeheartedly that the press treats Democratic and Republican administrations differently. Had Obama been president before 9/11 and ignored the many attempts to warn him of the Al Qaeda threats, and spent all of 9/11 running and hiding from Al Qaeda, he would not only have been impeached, he would likely have been hanged. Can you imagine what would’ve happened if it had come out that Obama dismissed the CIA’s attempt to interrupt his vacation (within a few weeks of 9/11) to have him recognize the great threat, with the incredibly flippant: “you have covered your ass now, so leave.”
JDH: “A reasonable person could well regard geopolitical conflict in the Middle East as largely beyond the power of the U.S. president to contain or control.”
Surely you jest!
The Suez, the Iranian revolution, the Gulf War, the Iraq War, Afghanistan? There has never been a time when a U.S. President wasn’t meddling in the Middle East.
Clinton may have had some luck, and certainly his initiatives have been linked to later excesses. However, he and his staff really sweated getting government spending down, and they did balance the budget.
Had Bush II been president, this would not have occurred, make no mistake.
Clinton is still the only president I can recall who left the country better than he found it due to his own efforts–even if these were to an extent prodded by the Republicans.
Were Obama to try to balance the budget and restrain spending, I would praise him, too.
By the way, this is also a reason to want a Fiscal Accountability Act.
There does appear to be some residual associated with better growth under Democratic administrations, but we don’t seem to know what it is.
Were there a bonus plan for higher GDP growth, those policies would have been identified and implemented by now.
Mike Kimel (a.k.a., “cactus” over at AngryBear) and Michael Kanell came to similar conclusions in their book “Presimetrics.” They also went beyond narrow economic indicators and examined various sociological metrics on divorce, teenage pregnancies, crime rates, etc. Across most (but not all) cases the metrics were better under Democratic Presidents than Republican Presidents. These very broad results suggest that the oil shock explanation doesn’t tell the whole story. A better explanation might be that Democrats believe in using government and Republicans don’t. Why should we be surprised that different attitudes towards government give us different performance results? The logical extension would be to compare Democratic and Republican governors and mayors because at the state and local levels there tends to more bipartisan agreement about how to use government for the greater good.
@Kopits
What a hoot!
“Clinton was the best Republican since at least Eisenhower” I guess that was why he was impeached by the Republicans!
And “Obama is the worst Democratic President since at least Wilson, and arguably since the Civil War….”
Obama’s policies are right center. He’s the best Republican president since Eisenhower! Not Clinton.
Steven, you’ve got your Presidents all mixed up!
“the weakest performance in the socialist era (post-1929 in the US)”
Who knew that Eisenhower, Nixon, Ford, Reagan, Bush I and Bush II were socialists!
LOL
Who first implemented socialist healthcare:
https://www.facebook.com/photo.php?fbid=10151719264465493&set=a.61232960492.81458.7292655492&type=1&theater
https://lh5.googleusercontent.com/-NVTfOBmc0yY/UlyVLIDorlI/AAAAAAAALQM/I5tWeRq3hgs/tumblr_muobamvNbL1qzsnxyo1_500.jpg
In addition to the oil issues, by the mid-1970s the country was committed (particularly at the state government level) to putting an increasing share of GDP into two areas with below-average productivity gains: health care and K-12 education. In 1965, state General Fund dollars spent on those two ran around 10-15% (ways to spend on health care were limited, and K-12 was then very largely funded out of local property taxes). Today, a typical state budget might see upwards of 60% of the General Fund spent on K-12 and Medicaid.
In practice, this really started to bite in the 1990s. Total state spending is constrained by balanced budget requirements and political limits on tax rates. State spending for transportation and higher education began to be seriously affected by the growth in health care and K-12 spending. We’re reaping the results now.
As another point against “media bias” as the cause, the stock markets rose slightly more when GOP candidates were elected but actual stock market performance after inauguration was materially better under Democratic presidents. The stock markets are companies and investors making decisions based not on what the newspapers say but what they perceive as the future. Businesses invest based on what they perceive to be their opportunities and challenges and investors buy or sell based on what those companies are doing and how those actions together make a picture of the future. Businesses don’t make decisions based on media coverage about the President but rather on what they see, how their orders are flowing, what their competitors are doing, etc.
Good points, Michael Cain. Note a growing majority share of spending for “education” is for teaching and administrative salaries and benefits, including state universities.
Here is per-capita non-farm employment less employment in “health care” and “education” (same level as 1978):
http://research.stlouisfed.org/fredgraph.png?g=pox
As a share of non-farm employment:
http://research.stlouisfed.org/fredgraph.png?g=poy
Non-farm employment per capita:
http://research.stlouisfed.org/fredgraph.png?g=poA
Per-capita private and public spending for “health care” through 2011 ($9,200!!!):
http://research.stlouisfed.org/fredgraph.png?g=poB
Equivalent per-household spending for “health care” (an UTTERLY ASTOUNDING $24,000 vs. the median household income of barely $50,000!!!):
http://research.stlouisfed.org/fredgraph.png?g=poC
Yet, one will find countless economists who claim that what the US spends for “health care” is a reflection of our affluence; therefore, we can afford to spend that much, and thus we should spend more for “health care”.
Similarly, we are told that spending more for “education” (again most ending up in salaries and benefits) is required so we can be “competitive” with Third World labor, even though no more than 10% of the fastest-growing occupations will require a bachelor’s degree; more than 50% of bachelor’s degree grads are unemployed or employed in jobs that do not require a bachelor’s degree; and one curiously never sees doctors, attorneys, college professors, Wall St. economists, politicians, and gov’t bureaucrats being required to compete in a race to the bottom for wages, salaries, and benefits with perfectly capable, “more productive” Third World workers or still more productive intelligent-systems virtual avatars and algobots that do not require costly “educations”/credentials, salaries, benefits, pensions, paid time off, maternity leave, nor tenure and endowments.
Jonathan,
Stock prices respond to corporate profits, which respond to consumer durables sales and business investment, which respond to consumer sentiment.
Rising stock prices do not discredit media influence on consumer sentiment.
Interesting that economic growth has basically quadrupled under Obama and that the average Democratic administration saw stronger growth than Reagan’s second term.
I don’t understand why more people aren’t aware that 96.4% of federal deficits 1951-2009 occurred during Republican administrations, mostly during Reagan’s and the two Bush administrations. Why don’t Democrats make more of this?
W.C. Varones, the paper does show GDP per capita and the difference is very small vs. the simple GDP. I agree that it should be based on working age population.
Really what we want to measure w.r.t. economics is changes in potential GDP and the size of the output gap. Assigning reasons for either is difficult.
If you exclude Truman, Kennedy, Johnson, and Clinton, the numbers don’t indicate anything.
😉
I’m only being half serious. I don’t think economists can explain the “miracle” Clinton economy, much less Johnson-Kennedy. And Truman? Furgetaboudit! That was eons ago.
So, economists. Start by explaining why Clinton did so well, and how that contrasted with how, say, Bush-II governed.
I think the comment on Carter and the oil shock isn’t very apropos. The economy under Carter still shows as performing better than the economy under the average GOP president.
I really don’t think there are enough data points that the discrepancy requires an explanation. On the other hand it also doesn’t provide any evidence that people should elect Republican presidents for a better economy.
Anon –
The socialist era, when the left was dominated by egalitarian policies, began when socialists took over in Russia. Such egalitarian philosophies would infect the western world as well.
For example, govt spending in the US was around 7% of GDP prior to FDR, rising to 14% under FDR, 22% under Truman, 32% under Johnson, to 40% under Obama. No Republican would thus consider Obama anything but a left thinking leader.
Clinton, by contrast, cut Fed govt spending to 18.5%, a quite low level in the modern period. His policies were more fiscally conservative than any Republican I can think of since 1929.
You can time the rise of socialist period to the point when liberals–historically fiscal conservatives–lost control of the term to egalitarians. Thus, “liberal” today continues to mean “egalitarian”, with former liberals compelled to use the term “libertarian”, which is hardly satisfactory to folks like Ricardo and myself. If you check the historical record, classical liberals lose control over the term in the UK around 1915-1917, and in the US, around 1929. The dominance of the left by egalitarians, not true liberals, constitutes “the socialist period” as I describe it.
As for Nixon, Ford and the two Bushes, I would note that Hayek dedicated “The Road to Serfdom” to “dedicated to “the socialists of all parties”. By this he meant that socialist ideas had crept into the thinking of both left and right. He was clearly on to something.
Wilbert –
Most of Carter’s term fell into the period after the first oil shock. Oil consumption recovered quite smartly after the first oil shock, and GDP with it.
It was precisely this recovery which would encourage Saudi Arabia’s Zaki Yamani (one of my favorite period politicians) to encourage Saudi Arabia and OPEC to take a high price policy, under the thinking that demand would always stay high. He was only partially right.
Demand would indeed recover rapidly in Korea, for example. However, consumption would peak in the advanced economies in 1979 and never revisit that level. Thus, Saudi actions prompted a massive fall in oil consumption and a commensurate rise in non-OPEC production, creating a 25% capacity overhang by 1984. This overhang would take a generation to absorb, a generation which would come to be known as The Great Moderation.
Thus, most of the second oil shock falls into Reagan’s administration, but began in Carter’s, and was a major contributing factor to the “malaise” that Carter noted in his famous White House address. Nevertheless, it should be remembered that oil consumption surged during most of Carter’s administration.
Engineer – I couldn’t agree more.
Taking the average GDP data from Table 1 and applying a t-test.
From Nixon 1 to Obama 1, p-value of 0.261
Adding in Johnson 2, p-value decreases to 0.128
Adding in Kennedy-Johnson, p-value decreases to 0.062
Adding in Eisenhower 2, p-value decreases to 0.048
Over the last 4 decades, it would seem that the party in the white house has no effect on average GDP. The 25 years after WWII are a different story.
Professor Hamilton
I found the foot note in the paper which lead to some of the answer to my previous questioning.
The authors chose a 1 quarter delay for presidential policy effect. In table A-1 they note other ranges of delay. It shows that the difference of effect of policy is reduced as different ranges are used for calculation.
I note they chose to present in their paper the the one that showed the greatest difference.
the paper reinforces a previous post i recall about revenue and expenditures over time-and presidents. it did show trends which improve revenue and reduce expenditures over democratic presidential tenure, and not so much under republican tenure. so consumer confidence and media bias aside, better growth is seen in the government numbers as well. but perhaps the biased media coverage is not really biased, but a result of these better numbers on expenditures and revenue? and if you want to talk media bias, in which direction is the most watched news network biased? hint-faux news…
quote : …It seems we must look instead to several variables that are mostly “good luck.”
Now, that’s a conclusion. And one has not to attend Harvard to realize that the “future is not ours to see”.
James, how’s your Harvard job going on ?
Steven Kolpits — Obama has reduced the federal deficit more than any other president but Clinton.
It is now under 4% of GDP or less than half the almost 10% of GDP deficit he inherited.
Under Clinton it went from -5% of gdp to plus 2%.
Under Carter it went from -4% to -1 % of GDP.
I will not bother to show the data for republicans. I wouldn’t want to confuse anyone
with the facts.
@kopits
You say: “For example, govt spending in the US was around 7% of GDP prior to FDR, rising to 14% under FDR, 22% under Truman, 32% under Johnson, to 40% under Obama. No Republican would thus consider Obama anything but a left thinking leader.
Clinton, by contrast, cut Fed govt spending to 18.5%, a quite low level in the modern period. His policies were more fiscally conservative than any Republican I can think of since 1929.”
According to http://www.whitehouse.gov/omb/budget/Historicals/
your numbers are not correct.
Their chart agrees with you that under Clinton spending was in 1999 18.5% of GDP and actually 18.2% in 2000. However, under Obama the numbers do not come close to the 40% you quote. 2010 = 24.1% 2012 = 22.8% And 2013 should be a bit less when the numbers are in. And the Clinton numbers may not represent as much of a cut in government spending as a boom in GDP during the dot com bubble.
Even if you look at total government spending (Fed + State + local) current numbers are still under 40%, though approaching it. (Different sources – you can google them)
Also, you will note that government spending as a percent of GDP has decreased under Obama from 24.1 in 2010 (2009 was the last, and greatest, Bush budget at 25.2% of GDP) to an estimated 22.7% in 2013.
So overall government spending has decreased during the Obama years making him the greatest Republican President since Ike! Neither Reagan nor the Bushes can make that claim!
Bottom line for me: If it appears that neither Republican nor Democratic economic policies make much difference, it’s probably because their economic policies are designed to benefit their friends and not the American public.
Historians are apparently already placing Barack among the top 15 . Government employment under Obama should perhaps make conservatives proud.
I vaguely remember Mankiw voicing a theory (apparently suggested to him) that the stock market does better under Dems because panicky Wall Street pulls down the market just before elections in anticipation of their being elected and then things turn out to be not as bad as expected. I’m not going to waste my time trying to dig out a link.
Spencer –
If it is President Obama’s intent to balance the budget and reduce Federal spending to 19% of GDP, well, by all means, let’s hear it.
rb, it really is an urban myth that wall street would tank the market in anticipation of a democrat in office. when it comes to money, decisions are made apolitically by most folks. if you are making business decisions from political calls on fox business or cnbc, chances are you are losing money.
Steven Kopits So Obama is a socialist who has pushed an egalitarian agenda??? Really? If so, then he hasn’t been very effective. In what world has income inequality receded? Virtually all of the post-recession GDP gains have gone to the top 5%, with the lion’s share going to the top 1%. If that’s your idea of a Marxist utopia, then I’d hate to see you vision of a reactionary plutocracy.
Here’s a thought. Growth has tended to drift downward over the last 40 years regardless of which party is in power. At the same time income inequality has gotten worse. Maybe there’s a connection. And there’s a pretty plausible explanation for this. As the top 1% captures evermore GDP growth (largely as rent), this pushes more people into marginal employment that requires all kinds of income subsidies that discourage effort and create economic distortions. In turn, those subsidies hurt productive economic growth. A vicious cycle.
Juxtapose the act of war, the lead up and the declaration. You will see for over 100 years Democrats lead us into protracted wars leaving Republicans to execute and end them: Wilson, Roosevelt, Truman, Kennedy/Johnson, Carter, Clinton. The last two are examples of ignorance board earring on criminality, we are still suffering the consequences of Carter’s years and Clinton ignoring Islamists. It is true Truman stumbled into the atomic bomb, a Democrat who dropped it supposedly to end war then promptly started the Korean conflict. GW Bush stands alone with these losers who suck the life blood of the nation they scurry for cover while others clean up their ness. I especially like Clinton squandering our nations strength, while Reagan ended the expensive Cold War, Bill Clinton spent the money.
Dr Pielke Jr has an interesting review of the paper: http://rogerpielkejr.blogspot.com/2013/12/causality-and-policy-outcomes-case-of.html
As a conservative reviewer of the Kimel-Kartel book, I agree with Pielke. If the paper and Kimel’s book are foundational then the next work would be to identify the policies and replicate them. I’m still waiting for that follow-on impact.
Otherwise we are using a correlation is causation approach to explaining presidential economic impacts. When we can and do define them we will have gone beyond reading chicken bones/tea leaves to identify the macro economic impacts.
Otherwise, I am left with Dem administrations spend more than Repub’s and that simple factor may explain all.
The graph is a measure of the implementation of Keynesian politice not economic health and growth of the real US economy. Consider:
Truman – WWII and the Korean War
Kennedy-Johnson; Johnson – The Great Society; the was on poverty; Vietnam War
Carter – Double digit inflation, interest rates, and unemployment and excessive monetary expansion.
I disagree with Steven Kopits concerning Eisenhower. Eisenhower was elected on a platform of economic liberalization and monetary conservativism. He constantly stiffled signs of recovery and did not fulfill his tax cut promises.
I agree with Steven Koptis concerning Bill Clinton. He and Ronald Reagan were the strongest supply side presidents since WWII. Their administrations can almost be considered one. The Bush I years were a sad interruption.
Bush II and Obama can also be considered one administration. Bush II began the failure and Obama accelerated it by expandion bad Bush policies.
Blinder does excellent research but if the research is based on a flawed premise it will give a flawed result.
Just as a quick thought experiment, I ran an OLS regression of GDP growth on oil prices back to 1980 (as far back as the IMF WEO database goes), then plotted the residuals against party to control for oil prices. More precisely, I used “real” oil prices deflated by overall USD inflation to account for the reduced purchasing power of the dollar over time. The results are much more in line with popular perceptions. Clinton’s record is best, followed closely by Reagan’s. Both Bush I and II saw growth slow sharply compared to their predecessors, and Obama is a disaster. Average GDP growth for Dems is only slightly higher than for Reps (2.96 vs. 2.70).
I then used Ed Hanson’s idea of lagging the data by one year, so that presidents are not responsible for growth in their first year but are responsible for the first year of their successors. This puts all of the recession of 2009 on Bush II but also penalizes Clinton for the dot-com bust. The results are very intersting. Reagan and Clinton are both equally successful with average growth of around 3.5% in both terms. Bush I is lackluster with growth just over 2.0%. Bush II’s first term is pretty good at nearly 3.0% but in his second term drops to just 0.3%. Obama is still lacklustre at just over 2.0% (similar to Bush I) even though he gets full credit for the 2010 rebound. Naturally, if you give the Republicans 100% of the blame for the crisis it drags down their period average and boosts the Dems (3.2 D, 2.5 R).
This was just a quick exercise and I would like to redo it with data back to Nixon at least, but I think it is intersting how it closely matches popular opinion: Reagan and Clinton = good times, Bushes and Obama = bad, and Republicans worse depending almost exclusively on how much you blame them for the financial crisis.
corev,
“Otherwise, I am left with Dem administrations spend more than Repub’s and that simple factor may explain all.”
Are you absolutely sure of this FACT? Did Clinton spend more than Reagan, GW Bush and WBush, in terms of the size of the economy?
One should not forget in recent history, it is the Democratic Presidents who have a history of reducing expenditures and increasing revenue over their tenure-and this has produced stronger economies. not sure it requires “reading chicken bones/tea leaves to identify the macro economic impacts.”
joe,
“You will see for over 100 years Democrats lead us into protracted wars leaving Republicans to execute and end them”
Wow, revisionist history like I have never seen before! I suppose democrat policy was responsible for WWI and WWII-the Balkan alliances and Hitler were simply afterthoughts to those policies.
GWBush and WBush brought us TWO oil wars in Iraq-and we are still cleaning up these messes. WBush also brought us Afghanistan. Obama has been cleaning up both of these wars, while fixing the economic disaster of that Conservative Republican administration.
Now you can argue against Clinton and the Balkan war-with NATO support-but that war involved significant ethnic cleansing. You think the muslim Albanian population in Kosovo would not have radicalized if the ethnic cleansing had lingered? And that war did not linger like our middle east fiascos.
and I guess we had “Clinton ignoring Islamists”, but I do recall him going after those folks with cruise missiles. in fact he did target bin laden. did you want a ground invasion from Clinton? although at the time, the conservatives simply said this was a diversion tactic from the bogus Lewinsky drama-and tried to impeach him.
Slugs –
Taxes have gone up under Obama. Govt spending is currently around 40% of GDP, which is a historic high, but it’s being funded by debt.
Obamacare is, of course, a big tax increase–a big middle class tax increase, for those not eligible for subsidies. That’s the point of its structure, actually. It’s an “off balance sheet” tax, in the sense that it is not showing up in government accounts.
Inequality has, in fact, fallen incredibly on a global scale, with Chinese citizens benefitting most of all.
For the US, inequality appears to have increased. It has certainly increased the most for those without a job. No one really seems to know why, but growing inequality seems to be a feature of the current state of development of the economy, not only in the US but in many other countries as well.
As Engineer correctly points out, the last time the median worker did well in the US was under Clinton, when Federal spending was reduced and the budget balanced. If you’re interested in equality, why don’t you advocate those policies most associated with a reduction of inequality in recent times?
Regarding the economy, Presidents matter a lot less than Congress.
The economy correlates closely to who controls the Senate and House (more so the House). And it shows that the GOP is superior.
Steven Kopits Where are you getting this 40% figure? Total (federal, state and local) government expenditures (including income transfers) was $5.698T (nominal dollars) in 2013Q3. GDP was $16.858T. By my math that works out to 34%. At the peak of the Clinton business cycle (2000) that figure was 29%. And that was at the peak of the business cycle! Just looking at the federal share of all this spending, in 2013Q3 total federal spending was 22.7% of GDP. In 2000 it was 18.5%. The economy is mired in a persistent recession with a demographic that is older than it was in 2000. Why oh why would you expect total federal spending to be what it was in 2000??? During Reagan’s 8 years (1981-1988) federal consumption and investment spending (Line 23 of NIPA table 1.1.10) averaged 10.2%. Under Obama’s first four years it averaged 8.4%. And the latest 2013Q3 figure has federal spending at 7.4%. So the idea that Obama is a big spender is simply false. Not true. Check the facts. One of the reasons economic growth is so anemic is because Obama has NOT been a big spender, Tea Party nonsense notwithstanding.
Inequality is a problem across the developed world; but it’s a bigger problem in some countries than it is in others. The US is especially bad. In fact, the IMF is getting quite worried because we recently passed a critical gini threshold value. No country has ever exceeded that gini threshold without violent political change in the wake. You better pray that there really is something to this idea of American exceptionalism. I agree that we don’t fully understand how to combat inequality, but we do know what won’t work. Cutting taxes for the top quintile isn’t a solution. Cutting spending on social safety net programs isn’t a solution. Cutting infrastructure spending isn’t a solution. Cutting government spending on healthcare, education and R&R are not solutions. Marx certainly wasn’t the answer, but neither was Hayek.
slug
I could easily find your gdp number on the nipa tables, but could not find your state, local, and federal expenditure number. The closest I found were from table 3.2 line 39, federal 3914.4T; and table 3.3 line 32, state and local expenditure 2433.6T; for a total of 6349.0T which rounds to Steven’s 38%.
Is there an adjustment in these figures that you are applying?
Steven Kopits wrote:
Inequality has, in fact, fallen incredibly on a global scale, with Chinese citizens benefitting most of all.
For the US, inequality appears to have increased.
There is a myth that free markets create inequality. In truth free markets create more equality and a larger middle class as people are allowed to benefit from the fruits of their labor. Steven’s comment simply gives more evidence of the power of free markets. As the nations of the world embrace free markets they experience more equality. This is clearly seen in China. On the other hand when commmand economies rule inequality explodes: consider Communist China, the USSR, Zimbawe, Venezuela, the list goes on. Leftists argue equality from fantasy premise refuted by facts.
I love Kopits reaction to the fact that Obama has sharply reduced the deficit.
As he usually does when the facts contradict his beliefs he finds some extraneous reason to ignore them.
But, Kopits, Obama constantly talks about reducing the deficit even though he ever makes the stupid claim that he is eliminating the deficit that you asked for as a condition for not ignoring the data.
Maybe the best policy would just be to ignore Kolpits since he never seems to make a real contribution to the discussion.
Free markets should create more equality, but primarily through the declining marginal utility of wealth and income effects, not necessarily through a more even allocation of income at any given time.
For example, if a new industry appears on the scene, then employees of the industry it displaces may well do worse, particularly if they are poorly educated or immobile. One can think of farming communities that time left behind. This is the essence of “creative destruction”.
At the same time, it’s important to distinguish between markets that are already materially free and those that are transitioning to freedom. The impacts of transitioning from closed or regulated economies does not necessarily help those affected. For example, the countries of Central Europe went through a deep recession after 1989 because their companies were entirely unprepared to compete with western competitors. Many people lacked the proper technical skills to make the transition in those economies. But importantly, this was not due to free markets, but due to a transition to free markets.
In Hungary, this transition was marked by huge increases in inequality, as adroit entrepreneurs made fortunes in the transition, even as workers from SOE’s lost their jobs. However, over time, markets work. Profits subsided and wages increased, and the glaring inequities of post-communist Hungary have eased.
From the flip side, the story is similar with China. When China opened up, suddenly its massive pool of low cost labor could compete with free market labor in other countries. It is highly likely that this process has affected wage growth and allocation in other countries, including the US. But again, after a period, markets should adjust and labor should see more favorable times.
The declining marginal utility of wealth and income is rarely mentioned in discussions of inequality, but it is by far the most important component. Today, even a poor American has amenities which Empress Sisi of Austria lacked in the 1880s. In this, economic growth is paramount. It is economic growth which reduces the real gap–in terms of utility–between the rich and poor.
There is a far greater differential between someone with a 20 year old Toyota and someone without a car than there is between a someone with 20 year old Toyota and another with a new Maserati. Those calling to put people on mass transport are implicitly calling for greater, not less, inequality, because it will increase the differential in utility terms.
ricardo,
“As the nations of the world embrace free markets they experience more equality. This is clearly seen in China. ”
it is nice that you use china as an example of “free market” with a loss of inequality. last time I checked, it was NOT a free market, but actually a highly regulated economy with pockets of smaller free markets-all at the mercy of significant government controls. so which is it, is china a failure or a success. because it most definitely is a controlled market. can a government controlled market be successful?
kopits,
” Those calling to put people on mass transport are implicitly calling for greater, not less, inequality, because it will increase the differential in utility terms.”
but I just saved $30k by not needing to buy a new car, and I can still travel to places of need because mass transit takes me there. how is this worse than not having a car? unless you are pushing the petro-auto industry.
Transportation economics are built around time.
If you make $120,000 per year, then your time is worth $1 / minute. If you make $60,000 per year, then your time is worth $0.50 per minute.
So if you make $60,000, then 10 minutes of your time is worth $5.00. If the bus takes 10 minutes longer, it has to be $5.00 cheaper than taking a car.
In Princeton, it would take me about 30 min more to take the bus to the train station (it involves walking to the bus stop, too) than driving, each way.
Thus, per day, it would be an hour more, and for a person making $60k, the cost would be $30 per day. If I take $30 x 22 work days, that’s $660 / month, and you can lease a low end car for around $250 / month, and figure another $250 for insurance and fuel, or perhaps $500 in total.
As a result, when time is factored in, driving creates more value to a person making $60k than taking the bus. That’s why most everyone in the US drives–it’s the cost efficient solution when the value of time is taken into consideration.
If you are forcing someone onto mass transportation, then you have a very tight time window in which the economics work–probably not more than 5 min more each way compared to using a car. It’s not a matter of morality or inherent goodness, it’s that the time of most Americans is reasonably valuable. For a mass transportation solution to be economically viable, it has to take this into consideration.
Ed Hanson I used table 3.1. You cannot sum tables 3.2 and 3.3 because you would be double-counting the federal expenditures that are transfers to the states; i.e., they would be counted once in table 3.2 and again in table 3.3. This is a surprisingly common mistake. For example, a few years ago the Heartland Institute (a conservative think tank) made exactly the same mistake in one of their studies.
Steven Kopits Your discussion regarding transportation economics is not entirely convincing. For one thing, you actually have to have a real opportunity to earn more. If your salary is fixed, then you’re not going to earn more by driving. Second, you are assuming that riding the bus is dead time. Big time wrong. People engage in leisure activities on the bus (relax to music, read the paper, take a nap, etc.) and those things have value. When you drive you give up those opportunities. And of course you could always use that 30 minutes on the bus to catch up on office work if you really wanted to be productive. Finally, when you drive you create externalities; economic costs that you impose on others. One of the reasons people drive rather than take mass transit is that drivers don’t pay all of what it actually costs to drive. In London they impose a commuter tax on driving during rush hour. I understand that many large cities in this country are considering similar commuter taxes.
kopits,
you also need to note that as mass transit expands, those “time costs” are reduced as the system becomes more efficient. obviously as long as groups of people promote anti-mass transit positions, then we will not achieve this efficiency. but if the future is an urban environment, mass transit is more efficient than individual cars. I lived in an area where I used mass transit and walking extensively-and it really can be liberating to not deal with the hassels of a car.
re: mass transit
This is NOT an issue of greater or lesser inequality, as Steve Kopits is implying when he says: “Those calling to put people on mass transport are implicitly calling for greater, not less, inequality….”
I’m personally not fond of mass transit, but that is simply because where I live, it simply doesn’t work!
If I lived in NY, SF or Mexico City I would change my tune. In Mexico City the traffic is so bad that taking a cab across town from the airport will cost $40 and take an hour, taking the subway will cost $1 and take 20 minutes. Mass transit is irrelevant for equality but highly relevant for population density – it is simply put only a solution for dense cities.
Kopits:Skip the walk and the bus and the transfer time, ride your folding bike to the Princeton shuttle station and thence 5 min to Amtrak.
Lots of comments. Let’s start with biking. There are four issues.
1. Weather: If it’s cold or raining, then riding is unpleasant and easily ruins business clothes.
2. Safety: I generally leave and arrive home in the dark. To get to the station, you’d have to bike on Washington Rd, with piles of leaves in your way and 50 mph traffic three feet to your left. In the dark. I’ll leave that to others.
3. Sweaty. That’s not how I want to get on a commuter train.
4. Time. Taking a bike would push my commute over three hours per day. That’s a hard limit for me. We moved office in January specifically to reduce my commute time, which is now about 1’17” each way.
Biking’s not feasible for me for several reasons.
Baffling –
I did not say that mass transport is bad; I said that any solution has to be put to the time value test, among others. I probably spend more time on public transport than any other commenter here. I do use it, and I prefer the subway in NY, too. It’s faster and cheaper than cab. Nor do any of my New York team have a car.
But for the vast majority of Americans, a car is indispensable. When you take away the average American’s car, you have materially degraded their quality of life, any that relative loss will be greater than any relative gain in social standing accruing to a peer buying a Ferrari, for example.
Loss of mobility = rising inequality. Absolutely.
So, Slugs, tell us about your commute. How do you get to work? How long does it take?
And as for you, Baffling, you have any kids?
As for working on the train:
I personally am not at my best at 6:15 in the morning, and neither are the mostly professional group I commute with. And at 6:30 at night, I’ve already put in a long day.
I would estimate that about 5-8% of the commuters on train are working. The majority are reading or dozing. A fair number play games, and about as many watch tv or movies as work.
Most people do not treat commuting as ‘productive’ time, based on my daily experience. On the train is not where they want to be.
kopits,
you want to examine the current state of mass transit and say we should not pursue this because look at how unaccommodating it is. with this attitude, you can never build up a proper mass transit system to become accommodating. I am telling you if you invest in these systems, many of the problems you highlight will go away. now you have a vested interest in keeping the status quo, I understand, because you have a nice big home in the countryside where cars are convenient. but improved mass transit will move populations back into the urban cores, where they become more efficient. in fact, there is an article on the front of todays wsj marketplace section detailing the return of companies to the cities.
when I lived in a city with these amenities, I used them because they were far more convenient than automobiles. time and money to park in a city is brutal. mass transit can be an inequality building apparatus if it is undeveloped-and many current systems are exactly this. but a well designed and run system produces the complete opposite effect.
Baffling –
Current mass transport systems depend on economies of scale which are well understand, and therefore, constrained.
Here’s my view of the future of public transport, and it’s specifically geared around the value of time.
http://www.foreignpolicy.com/articles/2012/06/08/self_driving_car
kopits,
I would not disagree with you on the article. self driving cars should be embedded in a well designed mass transit system. One place I lived had a great rail system to cover large distances, but the final 1-2 miles to destination was the major problem, and a very common deficiency. I always believed a common fleet of smart cars and segways would provide the perfect complement to the rail system-and self driving would be even better. cities do not need a fleet of suv’s ruling the road-smaller is better and more economical. well routed streetcars are also nice. but it does require a whole system solution.
If you factor out the periods in which the country was in a full blown wars with a draft and enormous orders to the military-industrial complex, i.e., the Truman and Kennedy-Johnson periods in the table, there is very little difference in the performance and it is foolish to think otherwise.
I wonder how much of the difference is due to one off events?
Couple of examples
After WW 2 US manufacturing was boosted by the simple fact that the industrial base of many competitors was a pile of rubble.
The landscape changed after Japan rebuilt its manufacturing capabilities and proceeded to destroy much of the American automobile industry by selling fuel efficient, dependable cars that Detroit could not compete against.
Another one off event is the collapse of the Soviet Union. The Soviet implosion enabled Clinton to reduce government spending via substantial cuts in military spending.
How much of these cuts would have been possible without the Soviet collapse?
Baffling –
A fleet of self-driving taxis does not require any great central intervention. You need to plonk down some charging stations, which could arranged privately, say, at the parking lot of the local shopping mall.
Secondly, you need a pick-up protocol at public meeting points like train stations. There has to be some sort of queuing function, but that’s no great shakes either.
A fleet of self-driving taxis will serve only local markets, I believe. Pretty much everything necessary can be accomplished by private entrepreneurs.
duracomm,
you could consider the post WW2 event a demand side increase (as well as during the war itself).
on the japan issue, it could be argued that demand did not change. the issue was supply side underperformance. demand for inferior products dropped, but overall demand was not significantly decreasing.
on the soviet issue, it is possible military spending reduction was a combination of reduced need as well as technological advancements which reduced the required size of the military. I do not know the size of those cuts, but if they are substantial then this is a real world experiment on the effects of defense cuts on the economy?
“If you factor out the periods in which the country was in a full blown wars with a draft and enormous orders to the military-industrial complex, i.e., the Truman and Kennedy-Johnson periods in the table, there is very little difference in the performance and it is foolish to think otherwise.”
Really? Even after you eliminate your chosen periods through convenient cherry-picking, 4 out of 5 of the best periods were Democrats. And 4 out of 5 of the worst periods were Republicans.
kopits,
the self driving taxis work best within the context of a mass transit system that gets people from A to B (say over three miles as minimum). The taxis get you from B to final destination-say less than 2 miles-for best efficiency. just like smart cars and segways-a tiered approach to transit. but they cannot serve the entire transit population-too inefficient. they can only work when coupled with a well designed mass transit system that takes their assets into account. regulations to their operation are essential.
Not at all, Baffling. A self-driving car could (and would) take me to work, the kids to school.
There’s no reason a self-driving electric car should be limited to 2 miles. A Nissan Leaf has a 73 mi range.
The only difference between a self-driving taxi and a regular one is that the self-driving variety would, in most cases, not be geared towards highway driving. By contrast, a Crown Victoria will take you anywhere you want to go, even if most of its trips are local.
Spencer said
“Obama has reduced the federal deficit more than any other president but Clinton.” and “Obama constantly talks about reducing the deficit even though he ever makes the stupid claim that he is eliminating the deficit that you asked for as a condition for not ignoring the data.”
Be careful, deficits are only a portion of the fiscal picture.
The 2013 Long-Term Budget Outlook
duracomm,
what is your point? and as the economy continues to grow and the debt to gdp drops because of the growth in the denominator, what do you have to say? or do you know at what percentage this is a problem? any proof of that?
And the Great Depression wasn’t even in the data!
Consider that the Republicans started the Great Depression *and* the Great Recession. Those two facts alone is really ‘enough said’.
The Minsky interpretation:
I think the Democrats’ weak and conflicting approach leads to decent economic growth – more by inaction than action perhaps, but the economic growth releases capitalist forces which finance Republicans. When the Republicans win, it all goes to hell – because the Republicans are better at getting done what they want. So one year the tax cuts are too high, in the other term the wars are ridiculous, sometimes monetary policy goes nuts, deregulation goes to far, and Rumsfeld goes to Iran with a cake.
The Republicans need to learn to relax and do nothing, and they would be more successful.