Japan edition
Inflation and output are up. So too is gross fixed capital investment. The yen is weaker, and the real quantity of net exports is higher.
GDP is up 1.9% q/q on an annualized basis in 2013Q3; it is up 2.6% y/y.
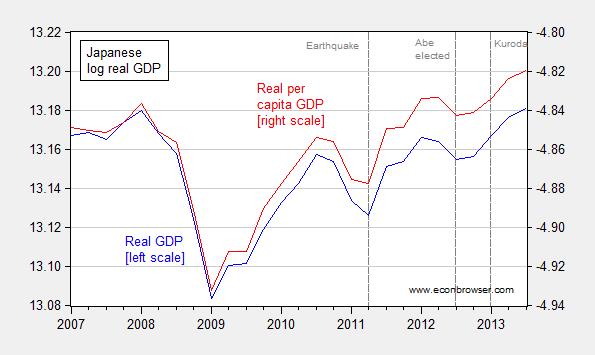
Figure 1: Log level of Japanese GDP in Ch.05Yen (blue, left scale), and log per capita terms (red, right scale). Per capita calculated using population 15 and over, seasonally adjusted. Source: Japan Cabinet Office, FRED, and author’s calculations.
What’s of interest is that a measurable proportion of growth has been accounted for (in a mechanical sense) by government consumption and investment. This has been particularly noticeable in the last two quarters.
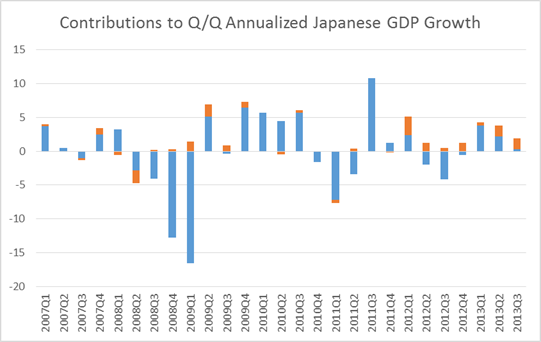
Figure 2: Contributions to real quarter-on-quarter annualized Japanese GDP growth, annualized, from government consumption and investment (orange), and all else (blue), in percent. Source: Japan Cabinet Office, and author’s calculations.
The government is planning to increase spending in anticipation of a sales tax hike [0].
Private investment was not the biggest contributor to growth; it accounts for 0.4 percentage points of the 1.9 percentage points growth. That being said, this represents a change from before Abenomics, when it accounted for -1.7 percentage points of the -3.7 percentage points of growth in 2012Q3. Morever, investment — including government investment — is increasing.
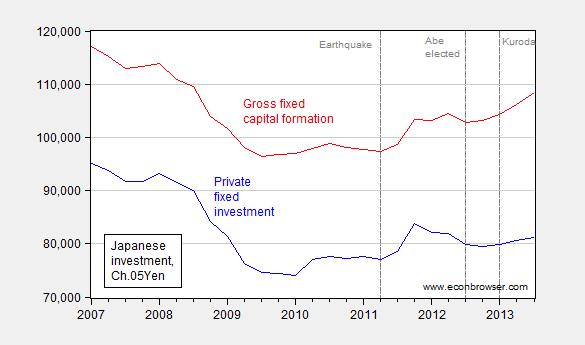
Figure 3: Real private investment (blue) and real gross fixed capital formation (red). Japan Cabinet Office, and OECD via FRED.
There is an interesting question regarding measurement of quantities; while real private investment (approximated by summing residential and nonresidential investment) rose an annualized 2.4% in 2013Q3, nominal investment rose 4.0%. On an annual basis, the numbers are 1.6% and 2.9% respectively (all calculations in log terms). (I don’t have any particular information regarding investment revisions; discussion of GDP revisions is here)
How much of these real economy effects are due to the expansionary monetary policy conducted under BoJ head Kuroda? One notable fact is the acceleration in inflation. Year on year inflation using several price indices is shown in Figure 4.
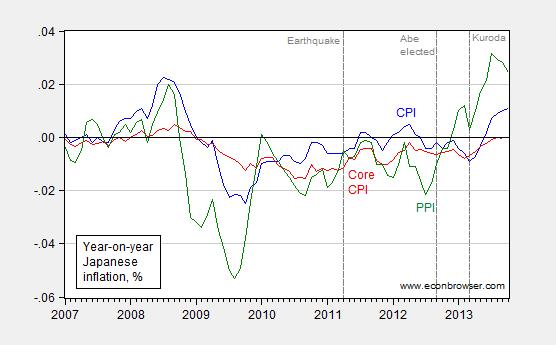
Figure 4: Year-on-year inflation using CPI-all (blue), core CPI, nsa (red), and PPI finished goods (green), all calculated using log differences. Source: OECD via FRED, and author’s calculations.
Inflation helps in adjustment of relative prices, and perhaps more importantly in Japan, relaxes collateral constraints by eroding nominal yen-denominated liabilities, and by changing expectations of future prices. (Some of these mechanisms are described here and here. Other measures of core exhibit acceleration as well [1]
Expectations matter as much as actual inflation. Some measures of heightened inflation expectations from the NY Fed’s Mandel and Barnes, as well as Krugman’s variant, confirm that there’s already been some success. It seems to me that these observations should be taken into account by those skeptics of unconventional monetary policy.
However, the consensus seems to be that most of the boost to economic activity is coming from external developments. The expansionary monetary policy has apparently induced a real depreciation in the yen’s trade weighted value.
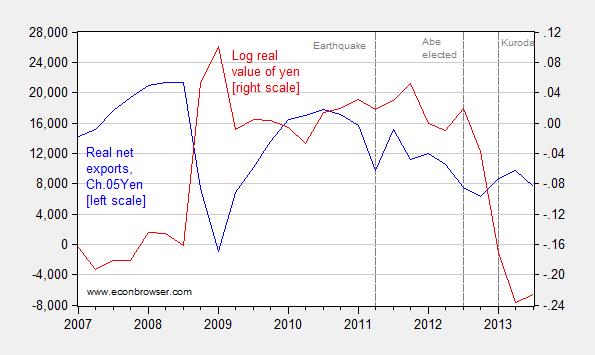
Figure 5: Real net exports, Ch.05Yen (blue, left axis), and log real trade-weighted value of yen, (red, right scale). Value of yen deflated using unit labor cost. Source: Japan Cabinet Office and OECD via FRED.
Real net exports have increased since the last quarter of 2012. While the increase is modest, it is an increase; in contrast, in nominal terms, net exports continue to decline in both absolute terms, and as a share of nominal GDP. This is important to keep in mind, given the rise in energy prices, and Japan’s increased dependence on energy imports in the wake of the nuclear power plant crisis at Fukushima Daiichi. More on trade effects here and here.
Analysts see a positive outlook for exports; from Reuters:
“U.S. private-sector demand remains strong and European economies appear to be bottoming out. If advanced economies recover, Japanese exports can rise more,” said Takeshi Minami, chief economist at Norinchukin Research Institute in Tokyo.
The volume of exports to the United States and European Union grew 5.3 percent and 8.0 percent year-on-year in October respectively, while Asia-bound shipments rose just 2.0 percent, highlighting a two-track recovery in the global economy.
Car shipments rocketed 31.3 percent on-year in October, making the biggest contribution to the value of exports in the month, while they also rose a strong 7.5 percent in volume terms.
Highlighting brisk demand in the United States, Toyota Motor Corp (7203.T) is racking up strong sales in the U.S. market and closing in on a record profit set before the Lehman crisis, while reaping the benefits of a weak yen that has boosted its profit margins.
Based on these observations, a reasonable conclusion is that expansionary monetary and fiscal policy work, even in a highly indebted country such as Japan. Whether these policies ultimately lead to a durable recovery depends on a number of factors, not the least is the strength of the world economy. (Deployment of the “third arrow”, structural reform, isn’t seen as critical by Roubini, for instance.)
Further monetary stimulus is being considered; additional action is likely if next year’s sales tax hike noticeably slows growth. [2] More on the Japanese program in the IMF’s Article IV consultation report, from August.
I am told such grow is unpossible. Japan is more than double the R&R debt cliff.
All true, and it is an amazing experiment to sit back and watch. But do you have any data on household formation after Abenomics? Birth rates are slightly up, probably due to rising wage expectations. So the next question is whether this will help with the big problem, population decline. If Abenomics can increase birthrates, by lifting hopes for the future, then that will actually be the biggest long-term impact. As immigration will be very difficult due to the bigotry of the native population, birth rates have to go up to sustain Japan’s current economy.
“However, the consensus seems to be that most of the boost to economic activity is coming from external developments.”
I don’t understand this. If there are actual measurements showing that the lion’s share of growth consists in an increase in government consumption and investment, then what is the basis of this consensus.
I sent Menzie a copy of Henry Hazlitt’s ECONOMICS IN ONE LESSON but I am sure it is sitting on a shelf somewhere gathering dust (if he did not throw it into the trash). Hazlitt’s lesson: “The art of economics consists in looking not merely at the immediate but at the longer effects of any act or policy; it consists in tracing the consequences of that policy not merely for one group but for all groups.”
Keynes said, “In the long run we are all dead.” He might have more accurately said, “Eat, drink and be merry, for tomorrow we die.”
Menzie always takes a short view of economics and he always finds that eating the seed corn fills his stomach today. Then we find that Keynesianism does fulfill Keynes’ statement, because when there is no seed corn for harvest the next year “we die.”
Japan’s been playing the QE/Stimulus game for 20 years. I’m sure THIS TIME IT’S DIFFERENT!!
I always try to remember that it is general, sustainable well-being, not numbers such as GDP, that defines the true success of economic policy. One component of well-being is household savings which are valuable because they help to secure retirements, allow for contingencies and provide legacies for descendants. They also fortify consumer confidence and improve the stability and sustainability of demand. Policy that achieves improvements in GDP and employment partly through a lubrication effect of inflation can be detrimental to household savings, at least in the near term. I will remain skeptical of the wisdom of such policies until I see evidence that general well-being is improved over the long term.
There is a VERY big assumption here:
The improvement is coming from exports, and that is coming from a decline in the value of the YEN.
So I think the lesson in fact needs to be rewritten:
Based on these observations, a reasonable conclusion is that expansionary monetary and fiscal policy work SO LONG AS SUCH AN EFFORT IS GREATER THAN THE COMPARATIVE EFFORTS OF ONES MAIN COMPETITORS IN WORLD TRADE.
If the US and the Europeans engaged in the same sized program, the value of the currencies wouldn’t change, with little improvement in exports as a result.
Japan’s real GDP per active age 15 and over:
http://research.stlouisfed.org/fredgraph.png?g=pxA
http://research.stlouisfed.org/fredgraph.png?g=pxz
Less gov’t spending (same level as 2009 and down 20% since 1994):
http://research.stlouisfed.org/fredgraph.png?g=pxB
http://research.stlouisfed.org/fredgraph.png?g=pxC
Gov’t spending is up 50% during the period, without which real GDP per active population will remain moribund:
http://research.stlouisfed.org/fredgraph.png?g=pxE
http://research.stlouisfed.org/fredgraph.png?g=pxF
Employment to population and the U rate:
http://research.stlouisfed.org/fredgraph.png?g=pxD
What would Japan’s U rate be without the 6% decline in the employment to population? If Japan could only push down the ratio another 3.5-4%, the U rate would be 0%. :\
Similarly for the US, had the participation rate not fallen 4-5%, the US U rate would be 10-11%. Now all we need is for 5-6 million more Americans to drop out (be forced out) of the labor force, and the US U rate would be 3-4%. Full employment by attrition.
Japan has a VERY MODEST echo boomer economic tailwind into 2016-19, but it is just as likely to be overwhelmed by domestic fiscal issues and the slowing, or no growth, of global real GDP per capita hereafter.
https://app.box.com/s/qendym296b81lf9er0z4
Of course, had Japan been able to borrow and/or tax and spend for imperial military adventures as in the 1890s-1900s and 1930s-40s, the Japanese economy might have grown incrementally faster, not unlike the US in the 1890s, 1940s, and since the 1980s and 2000s.
Instead of building bridges to nowhere, they could have ramped war production to bomb to nowhere someone else’s bridges, and most economists would have called the result “growth” and encouraged similar policies to promote the growth of “aggregate demand”, regardless of the source and consequences.
Interesting post. Do you really consider the yen’s value an “external development” or is that economist speak?
Menzie Chinn:
“While the increase is modest, it is an increase; in contrast, in nominal terms, net exports continue to decline in both absolute terms, and as a share of nominal GDP.”
Although nominal exports have surged by 15.2% between 2012Q4 and 2013Q3, nominal imports are up by even more, or by 16.5%:
http://research.stlouisfed.org/fred2/graph/?graph_id=149566&category_id=0
Devaluation improves a country’s trade balance only if the Marshall-Lerner condition on trade elasticities holds, and research shows that they’re not met in the majority of cases, either past or present:
http://www.emeraldinsight.com/journals.htm?articleid=17056473
That’s not to say that currency devaluation isn’t beneficial, of course it is, but the benefit flows primarily from increased domestic demand. Here is a study of the competitive devaluations of the Great Depression by Barry Eichengreen and Douglas Irwin:
http://www.dartmouth.edu/~dirwin/w15142.pdf
The Great Depression is a particularly important historical example because then, as now, most of the advanced world was up against the zero lower bound in policy interest rates.
An examination of Figure 4 on page 48 reveals that the only countries that experienced import growth from 1928 to 1935 (the UK, Japan, Sweden and Norway) were members of the sterling block that devalued early (1931). In most of these countries net exports actually declined over the period because imports rose more than exports.
The order of recovery from the Great Depression follows the order in which they abandoned the gold standard perfectly:
http://fabiusmaximus.files.wordpress.com/2009/03/gold.png
But this wasn’t because of increased net exports.
The US devalued in 1933 which immediately led to a swift recovery from the Great Depression. Nominal exports doubled from 1933 to 1937. But nominal imports increased by 110.5%:
https://research.stlouisfed.org/fred2/graph/?graph_id=120991&category_id=0
As a result net exports went from a small surplus (about 0.2% of nominal GDP) to being roughly in balance.
France was part of the Gold bloc of countries that devalued late (1936). From 1936 to 1938 nominal exports increased by 95.4% and nominal imports increased by 80.9%:
https://research.stlouisfed.org/fred2/graph/?graph_id=120992&category_id=0
However, since imports were already substantially greater than exports, the nominal deficit actually increased by 55.4%.
Japan’s original ryōteki kin’yū kanwa (QE) was officially announced in March 2001 and concluded in March 2006. The following is a graph of the BOJ’s estimate of Japan’s real effective exchange rate which is trade weighted with respect to 16 different currencies and takes into account their relative inflation rates:
http://thefaintofheart.files.wordpress.com/2013/06/sadowski2b_1.png
The real effective exchange rate fell from 116.25 in February 2001 to 91.09 by March 2006, when the BOJ announced the completion of QE, a decline of 21.6%.
Exports rose from 10.2% of nominal GDP in 2001Q4 to 19.3% of GDP in 2008Q3. Imports rose from 9.4% of GDP in 2001Q4 to 19.5% of GDP in 2008Q3. From 2002Q1 to 2008Q1 real (adjusted by the GDP implicit price deflator) grew at an average annual rate of 11.0%. Real imports grew at an average annual rate of 12.1%.
So there was boom in both exports and imports. But imports grew faster than exports, and net exports actually moved from surplus (0.8% of GDP) to deficit (-0.2% of GDP) between 2001Q4 and 2008Q3:
http://research.stlouisfed.org/fred2/graph/?graph_id=120989&category_id=0
It’s very telling that today the only major currency area up against the zero lower bound in interest rates that hasn’t done QE (the Euro Area) is also the only major currency zone where the trade balance has improved substantially since 2009, going from 0.6% of GDP in 2009Q1 to 3.5% of GDP in 2013Q2:
https://research.stlouisfed.org/fred2/graph/?graph_id=149559&category_id=0
But this has occurred in large part because nominal imports have been falling since 2012Q3 due to falling domestic demand. Nominal exports have barely changed since 2012Q3.
fladem: “Based on these observations, a reasonable conclusion is that expansionary monetary and fiscal policy work SO LONG AS SUCH AN EFFORT IS GREATER THAN THE COMPARATIVE EFFORTS OF ONES MAIN COMPETITORS IN WORLD TRADE.
If the US and the Europeans engaged in the same sized program, the value of the currencies wouldn’t change, with little improvement in exports as a result.”
The Yen devaluation against the broad trade-weighted index has had little effect on increasing Japanese exports to imports as a share of GDP. Most of Japanese exports are to their Asian and US high-tech and automaker subsidiaries, in any case. As global real GDP per capita stagnates, so will Japan’s export growth, as will the growth of global “trade” (offshoring and US and Japanese intra-Asian flows) in general.
Yen to broad trade-weighted US$ and Japanese exports:
http://research.stlouisfed.org/fredgraph.png?g=py0
http://research.stlouisfed.org/fredgraph.png?g=py2
Trade-weighted other currencies and Japanese exports:
http://research.stlouisfed.org/fredgraph.png?g=py4
http://research.stlouisfed.org/fredgraph.png?g=py5
Broad US$ and exports/GDP:
http://research.stlouisfed.org/fredgraph.png?g=py6
http://research.stlouisfed.org/fredgraph.png?g=py8
Other currencies:
http://research.stlouisfed.org/fredgraph.png?g=pya
http://research.stlouisfed.org/fredgraph.png?g=py9
Broad index and Japanese imports to GDP:
http://research.stlouisfed.org/fredgraph.png?g=pyg
http://research.stlouisfed.org/fredgraph.png?g=pyh
Broad index and Japanese import prices:
http://research.stlouisfed.org/fredgraph.png?g=pyf
http://research.stlouisfed.org/fredgraph.png?g=pye
Finally, broad index and exports to imports as a share of GDP:
http://research.stlouisfed.org/fredgraph.png?g=pyv
http://research.stlouisfed.org/fredgraph.png?g=pyj
Good points, Mark.
As real GDP parity is achieved between the three major trading blocs, as has largely occurred, real GDP per capita and trade and capital flows will flatten out and the major fiat currencies will trend towards and around par hereafter.
The world economy is now effectively integrated (at least 70-75%+ of it is), suggesting that foreign exchange differentials will have diminishing effects on trade and capital flows.
But this also implies that equity valuations are discounting much faster growth of global GDP, revenues, and earnings than is likely to occur. Economists are fond of urging China to “rebalance” the country’s economy away from exports to household consumption while ignoring the gross global imbalances reflected in equity valuations and the resulting wealth and income concentration at no velocity in the English-speaking world that is contributing to stagnating growth of real GDP per capita.
ricardo, the correct Keynes quote is:
“But this long run is a misleading guide to current affairs. In the long run we are all dead. Economists set themselves too easy, too useless a task if in tempestuous seasons they can only tell us that when the storm is long past the ocean is flat again.”
basically he is saying if you do not have a good model of today’s behavior, you have no business telling me what to do today to avoid some fictional problem of the future.
ricardo, you better have a good model that tells me why I should not eat my seed corn and starve myself to death today rather than next year.
XO: It being only slightly more than a year since Abe was elected, and less than a year since Kuroda took office, I do not believe your required household formation statistics are yet available.
Dan Kervick: I was referring to earlier reports (which I did not link to) which found share prices responding primarily for exporting firms; and previous quarters’ growth accounting relying upon net exports.
Ricardo: Thanks again for the Hazlitt. But as I mentioned before, it was nothing more than slightly warmed over (and narrower version) of what gets taught in high school economics, except without the nuance (!!!).
Anonymous (6:43AM): Very strange — I recall quite vividly talking to GoJ officials in 2001, and they had not embarked upon anything like QE at the time; in fact they were somewhat worried about hyperinflation, much like some of our economics commentators (to call them economists would be going a bit far) here in the US. To the best of my knowledge, 2001 is less than 20 years ago….
fladem: If other countries reflate in the same way, it’s true that nominal and real exchange rates might remain unchanged. But if the reflation then induces a higher price level, then the aforementioned effects (loosened collateral constraints, reduced government debt ratios) occur. See here.
jonathan: I guess I should’ve stated a development on the external accounts — as opposed to implying it was kind of exogenous. Sloppy description…
Robert Fulghum wrote “All I Really Need to Know I Learned in Kindergarten.” Menzie, perhaps a quick return to high school economics could teach you a lot wisdom you have forgotten.
Ricardo perhaps a quick return to high school economics could teach you a lot wisdom you have forgotten.
I don’t know about you, but in high school I took advanced economics and we used Samuelson’s text. What did you use?
And baffling beat me to correcting your misunderstanding of the Keynes quote.
For XO’s question on demographics, it’s already too late. Because birthrates were already below replacement ca. 1970, the number of potential mothers is in decline – population growth exhibits lots of momentum. Even a rise in fertility to replacement levels (the reported boost is from very low levels to still very low levels) would stabilize the labor force only 40 years in the future.
The same turns out to be true of female labor force participation. Even if it continues rising at younger ages, as has been happening since the late 1970s, the number of young women is so small that it won’t make much of a difference.
See my blog for graphs on this (and most recently on my own more pessimistic take on Japan’s deflation, based however primarily on the CPI and not the broader set of metrics that Menzie uses). Unfortunately due to student demand most of my teaching is now on China’s economy, so I don’t update my Japan blog very often. For my China course see http://econ274.academic.wlu.edu
2slugbaits, I really cannot say I corrected ricardo. I imagine he knew full well he was making a very dishonest statement-or is he really that ignorant of economics history??? probably not.
There is no hope for Japan. I know you are desperately searching for evidence that the “right” central planning can allow economies to have their cake and eat it too, but that’s not reality. Japan will limp along at best for awhile before declining.
anonymous, do you have a plan for japan? or do you subscribe to the confidence fairy and animal spirits?
Japan has dug itself so deep by pulling future consumption into the present for decades on end that there is no way out short of complete default and a decade of chaos.
anonymous,
“Japan has dug itself so deep by pulling future consumption into the present for decades on end”
really? pulling future consumption into the present for decades? really? its a great sound bite, but show me the numbers. a decade of future consumption? really? your predictive capabilities are truly baffling!