That’s the title of a paper coauthored by Matthieu Bussiere (Banque de France), Gong Cheng (Sciences Po), Noemie Lisack (European University Institute) and myself, in which we examine two key questions:
[F]irst, has the accumulation of reserves effectively protected countries during the 2008-09 financial crisis? And second, what explains the pattern of reserve accumulation observed during and after the crisis?
More specifically, the paper investigates the relation between international reserves and the existence of capital controls. We find that the level of reserves matters: countries with high reserves relative to short-term debt suffered less from the crisis, particularly if associated with a less open capital account. In the immediate aftermath of the crisis, countries that depleted foreign reserves during the crisis quickly rebuilt their stocks. This rapid rebuilding has, however, been followed by a deceleration in the pace of accumulation. The timing of this deceleration roughly coincides with the point when reserves reached their pre-crisis level and may be related to the fact that short-term debt accumulation has also decelerated in most countries over this period.
To place matters in context, recall that reserve accumulation has been proceeding apace over the past decade and a half, with the bulk of the accumulation undertaken by emerging market central banks. This is shown in Figure 1 from the paper.
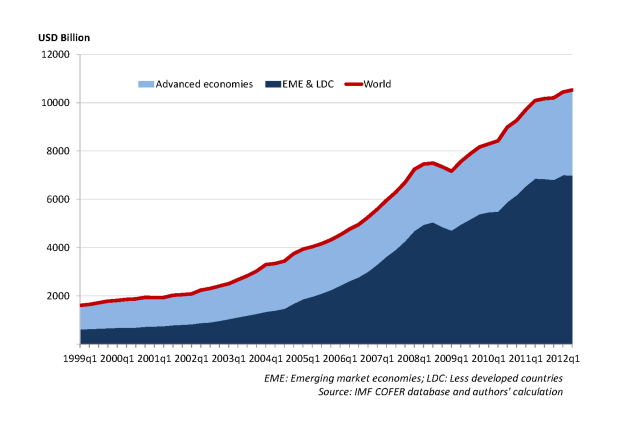
Figure 1 from Bussière, Cheng, Chinn and Lisack.
Reserve accumulation has taken different paths for advanced and emerging market/developing country groups. The paths have also diverged depending on the degree of financial openness. This is shown in Figure 2 from the paper.
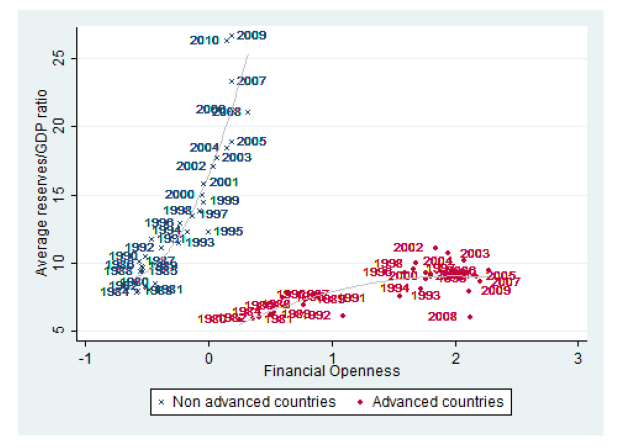
Figure 2 from Bussière, Cheng, Chinn and Lisack.
The capital openness variable is the inverted Chinn-Ito index, described here.
The accumulation of foreign exchange reserves must have some motivation; one motivation (among several possible) is that reserves are particularly helpful during times of financial stress, when liquid assets are needed (or their presence assuages investor fears of a currency collapse).
We find that growth is about 0.6 to 0.7 ppts higher than would otherwise occur if the reserves to short term debt ratio were to double (i.e., the regression coefficient on income growth deviation from baseline on log reserves to short term debt is about 0.6-0.7).
This coefficient is from a linear specification that omits any interaction effect from capital openness. We find that the lower the degree of capital openness, the greater the marginal impact of reserves/short term debt. This is shown in Figure 3.
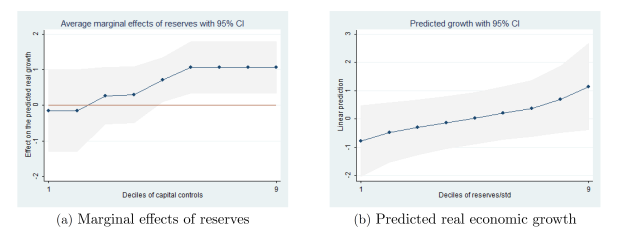
Figure 3 from Bussière, Cheng, Chinn and Lisack.
We have subjected our findings to a series of robustness tests (described at length in the paper, and documented in the appendices). One point that is notable is that dropping outliers and/or small countries typically increases the coefficient on log reserves/short term debt.
There is a question of why reserves matter. It could be that the reserve depletion itself (for defending a currency) mitigates economic distress; or perhaps the mere existence of large reserves deters speculation against a currency. We augment our regressions with a reserve depletion dummy variable and find the log reserves/short term debt coefficient retains its statistical significance, while the coefficient on reserve depletion is not statistically significant. This finding is suggestive of the deterrence channel.
We find that after the crisis, countries have sought to rebuild their stocks of foreign exchange reserves. Figure 5 from the paper illustrates this point.
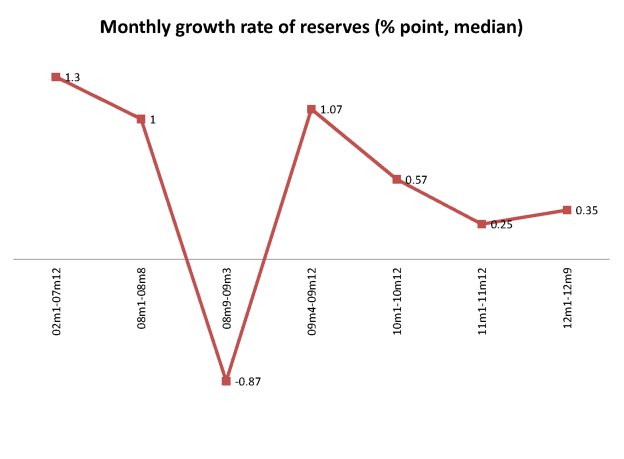
Figure 5 from Bussière, Cheng, Chinn and Lisack.
The paper concludes with some observations on the recent the recent stabilization in reserves-to-short-term-debt ratios.
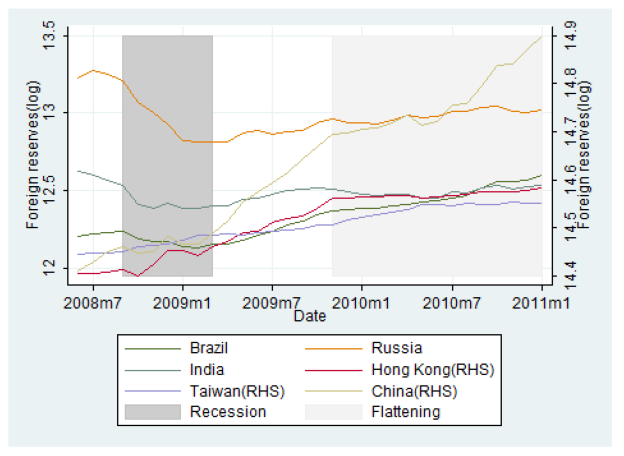
Figure 8 from Bussière, Cheng, Chinn and Lisack.
For several countries, the ratio has plateaued. China is one notable exception. (However, since the end of the graph’s sample, Chinese reserves (in levels) have stabilized, with a slow resumption of growth in 2013.)
The entire paper is here [gated NBER version here — MDC 1/10/14].
The only reference I found in the paper to “rollover risk” is in the references but I assume the findings – that countries with mid but not high or low levels of reserves tended to deplete or materially reduce them – speak to rollover risk. Yes? High reserve levels would indicate less and low levels would indicate other, bigger problems that can’t be solved by drawing down reserves. I know there’s a big assumption in that last part.
The following article has a very interesting graph, showing Gross Total External Debt, as a percentage of GDP, for 22 advanced and for 22 emerging economies. Note the huge increase in the ratio for advanced economies, starting around 2002. I couldn’t help but notice the correlation to my GNE/CNI* ratio charts:
GNE/CNI Ratio* Vs. Annual Brent Crude Oil Prices:
http://i1095.photobucket.com/albums/i475/westexas/Slide1_zps5f00c6e5.jpg
GNE/CNI Ratio* Vs. Total Global Public Debt:
http://i1095.photobucket.com/albums/i475/westexas/Slide2_zps01758231.jpg
GNE/CNI Ratio* 2002 to 2012, with 2005 to 2012 rate of decline extrapolated to 2030:
http://i1095.photobucket.com/albums/i475/westexas/Slide1_zps9ff3e76d.jpg
*GNE = Combined net oil exports from top 33 net oil exporters in 2005, EIA data, total petroleum liquids + other liquids
CNI = Chindia’s net oil imports
Debt burdens in developed nations have become extreme by any historical measure and will require a wave of haircuts, warns IMF paper:
http://www.telegraph.co.uk/finance/financialcrisis/10548104/IMF-paper-warns-of-savings-tax-and-mass-write-offs-as-Wests-debt-hits-200-year-high.html
Excerpt:
Debt as a percentage of GDP chart:
http://i.telegraph.co.uk/multimedia/archive/02779/Chart1_2779973c.jpg
My comments, from a previous thread:
What I define as Available Net Exports (or ANE, i.e., GNE less CNI*) fell from 41 mbpd (million barrels per day) in 2005 to 35 mbpd in 2012.
While there has been a rebound in US consumption, there is some question about how accurately the EIA is accounting for product exports in the short term, but in any case I would argue that the dominant post-2005 pattern, at least through 2012, was that developed net oil importing countries like the US were gradually being forced out of the global market for exported oil, via price rationing.
To the extent that we have seen a rebound in the US economy and in US oil consumption, it’s important to remember how many trillions of dollars in deficit spending we have seen in recent years (largely financed by the Fed).
I think that the fundamental reality we are facing is that we are in the middle of a relentless transformation from an economy focused on “Wants,” to one focused on “Needs.” But governments in developed net oil importing countries refuse to acknowledge, or are incapable of acknowledging, this transformation, and they are desperately trying to keep their “Wants” based economies going via increased deficit spending, despite the post-2005 decline in the volume of Global Net Exports of oil available to importers other than China & India.
*GNE = Combined net oil exports from top 33 net oil exporters in 2005, EIA data, total petroleum liquids + other liquids
CNI = Chindia’s net oil imports
The decline in official reserves in currency manipulators during the 2009 recession may have been endogenous. For example, China may have found that keeping a fixed rate in the face of declining foreign demand required smaller exchange market interventions.
China’s exchange rate policies (which they and smaller “Asian Dragons” seem to have copied after Japan’s export-led-growth model) have led to the external debt shown by J. Brown above.
In our present world of secular stagnation, it is a bad idea to allow such policies to continue. I’m afraid if left to current political forces, however, they will be tolerated until we get another lesson in why “Trends that can’t continue…won’t.”
Jeffrey,
Why are you suggesting that “we are in the middle of a relentless transformation from an economy focused on “Wants,” to one focused on “Needs.” Economic growth doesn’t depend on oil imports.
We’re in the middle of an historic shift away from fossil fuels – the faster that transition happens, the better for everyone. Countries that reduce their oil imports will grow faster, others will increasing find oil imports dragging them down.
It has some parallels to smoking in the US. If you’d asked the Tobacco Information Agency in 1960 about their future, they would have told you that Americans would go on smoking at high rates forever. Now, of course, smoking is embarrasing in educated circles. Fossil fuels are dirty, expensive and cause wars. Soon, their image will be similar to tobacco – heck, it already is in Europe.
I love the index. Great charts Menzie!
If larger reserves reduce perceived risk, the cost of capital and thus encourage more private investment in the home economy, you would think that the security of economic property rights would be negatively correlated with reserve/GDP ratios.
In addition to the Chinn-Ito index, the reserve/GDP ratios also indicate and help order country risk for investors.