Governor Walker delivered his State of the State address tonight (video here). From the press release:
“Tonight, we are laying out a plan to move Wisconsin further down the road to prosperity,” Governor Walker said. “Our friends and neighbors are going back to work and job creators are expanding their businesses. Thanks to sound fiscal management, I am proud to announce further tax relief for Wisconsinites and additional funding for worker training. We will continue to work diligently until everyone who wants a job can find a job.”
Here is a comparative assessment of Wisconsin’s performance, as measured by the Philadelphia Fed’s coincident indices.
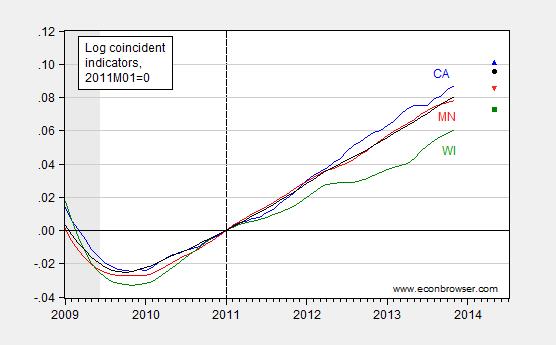
Figure 1: Log coincident indicators for California (blue), Minnesota (red), Wisconsin (green), and US (black); observations for 2014M05 are forecasted values using Philadelphia Fed’s leading indices, all normalized to 2011M01=0. Source: Philadelphia Fed and author’s calculations.
From the Philadelphia Fed’s website:
The coincident indexes combine four state-level indicators to summarize current economic conditions in a single statistic. The four state-level variables in each coincident index are nonfarm payroll employment, average hours worked in manufacturing, the unemployment rate, and wage and salary disbursements deflated by the consumer price index (U.S. city average). The trend for each state’s index is set to the trend of its gross domestic product (GDP), so long-term growth in the state’s index matches long-term growth in its GDP.
Hence, one can roughly interpret the trend in the coincident index as a measure of real GDP. In this context, Wisconsin growth has lagged the overall United States by 2 percent cumulative growth since 2011M01 (keeping in mind that several prominent individuals have castigated the US growth record over the past two years, while studiously avoiding comment on the lagging growth performance in Wisconsin).
Using the Philadelphia Fed’s leading indices as forecasts, the gap will widen to 2.3 percent in the next six months. The gap between Wisconsin and California will widen to 2.8 percent.
In terms of policies, the governor proposed additional tax cuts. From the Marley and Stein in Milwaukee Journal Sentinel:
He said his “blueprint for prosperity” would trim property and income taxes by $504 million over the next 18 months and put more than $100 million more into the state’s rainy-day fund.
What are the fiscal implications?
Walker’s overall plan would add perhaps $100 million to the $708 million shortfall previously projected for the next two-year budget, under the approach used by the Legislative Fiscal Bureau. If the new tax money were simply put in the bank, the state would go into the 2015-’17 budget with a $1.25 billion surplus, the budget office reported Wednesday.
The fiscal bureau’s so-called “structural deficit” isn’t the only way to measure the health of the state budget, but it’s a tool that many lawmakers embrace.
See also Wisconsin Budget Project for more on blank spots in the proposed budget, the structural budget deficit, and investment (or lack of) in education (including technical colleges).
For a survey of the academic literature on tax cuts at the state level and economic growth, see here.
Finally, for a take on the State of the State, it is useful to refer to employment; employment figures for December are not yet out, but here are the November figures.
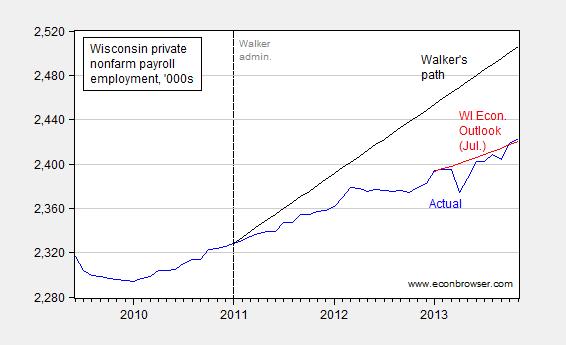
Figure 2: Private nonfarm payroll employment for Wisconsin, seasonally adjusted (blue), July 2013 Wisconsin Economic Outlook forecast, interpolated from annual data using quadratic match (red), and Walker’s promised path for private NFP (black). Source: BLS, Wisconsin Economic Outlook, and author’s calculations.
As of November, private nonfarm payroll employment in Wisconsin is 83 thousand below the trend consistent with the 250,000 net job creation target recommitted to by Governor Walker back in August of 2013 (and originally declared in his 2010 campaign).
This is another view of the State of the State.
Update, 1/23 1:40PM Pacific: Reader rd asks for how Washington fares.
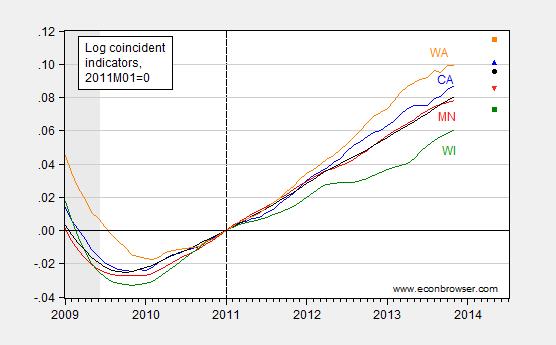
Figure 3: Log coincident indicators for California (blue), Minnesota (red), Wisconsin (green), and US (black), Washington state (orange); observations for 2014M05 are forecasted values using Philadelphia Fed’s leading indices, all normalized to 2011M01=0. Source: Philadelphia Fed and author’s calculations.
As far as I recall, Washington state did not embark upon massive cuts to k-12 education, at least nowhere near slash-and-burn Wisconsin. See this CBPP post, and the figure drawn from that post, below.
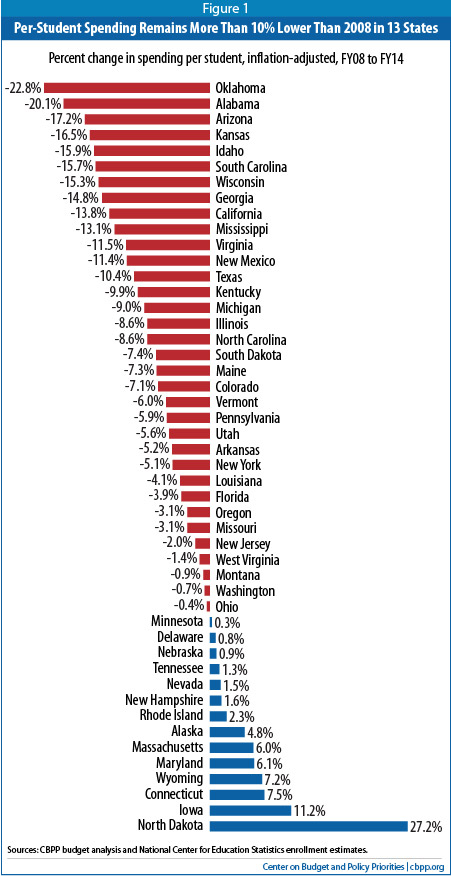
Figure from CBPP.
So, Wisconsin is 7th…in slashing per pupil spending.
Side note: Has to be read to be believed: [2].
Yawn.
Menzie, I agree that the Philadelphia Coincident Indices show that Wisconsin has been lagging Minnesota and indeed, the rest of the country during the present expansion. But, this has been the case since the late-1990s. Trailing Minnesota is not exactly something new for Wisconsin. So, why do you think Wisconsin has been lagging for the better part of two decades? And, why the focus on Walker? Jim Doyle was a Democrat last I checked, and this chronic economic under-performance existed under him too.
Neil,
This gets very tiresome, so here it is, again, for the umpteenth time, from the Scott Walker press release of Feb. 23, 2010:
“If you elect me as your next Governor, I’ll get government out of the way and lower the tax burden so Wisconsin business owners and factories can create 250,000 jobs and 10,000 businesses in our state by 2015,” said Walker to the group of over 800 business owners and community leaders.”
So the deal was that: 1) if he was elected (last time I checked he was), 2) that he would get gov’t “out of the way” (he has controlled both houses since his election and gotten every piece of legislation but two through and signed them), 3) he would lower the tax burden (there were several tax cutting pieces of legislation since 01/2011) and that this would create 250,000 jobs (Walker said “can create” not “might create”). If Walker is correct, and if there are less than 250,000 jobs then it can only be true that either: a) Walker wasn’t in fact elected; or b) Walker erroneously though that job creation was tied to cutting taxes and regulation (I’m assuming that “getting out of the way” has something to do with regulation and not that government is physically obstructing commerce).
So there you have it, in Walker’s own words. He failed, he continues to fail, and bringing up his predecessor is irrelevant since Walker didn’t bring up that antecedent at any time (I didn’t see anywhere in his press releases or statements on this issue that the 250,000 jobs might not happen because of the actions of former governors, and I looked at all his references to Doyle).
Walker diagnosed a problem, suggested a remedy, identified a quantifiable objective, got the power to enact all he wanted–and he failed to meet his own objective. End of story.
Neil: Because in the 2000’s, per capita income growth were roughly the same, and diverged starting in 2011; see Figure 1 in this post.
Anonymous: On August 11, 2013, you wrote:
Well, I’m writing about economics, and yet now you yawn, when you can’t accuse me of making unsubstantiated claims of traveling internationally on UW funds.
In any case, I thank you for your continued posting as you ably represent the intellectual and personal characteristics of those that hew to your views.
But Menzie, you do agree that the coincident indices that you cite in this post show Wisconsin lagging since the late-1990s, right? I see that over the 10 year period ending in 1997, Wisconsin lagged Minnesota by 0.5ppt (1.9% annualized vs. 1.4%). So, is there something at an industry or sector level that accounts for Wisconsin’s underperformance. I also see that in the Philly Fed’s leading indices, Wisconsin has been doing a bit better over the last quarter. So, perhaps we could see a catch-up.
Dr. Morbius: I am sure Walker is not the first politician to fail live up to a jobs promise and he won’t be the last. Your outrage seems very selective.
That is why I love Professor Chinn, he is so feisty. I was going to take one of his classes, however, I do not want to be cracked over the head with a ruler (he use metal ones).
Let’s look at the entire upper mid-west for employment gains for 2013.
N Dakota – 3.1%
Taxesota – 1.3%
Badgers – 1.2%
S Dakota – 1.o%
Illinois – .9%
Iowa – .6%
California – 1.2%
I think these repeated posts about the current economic state of Wisconsin document the “success” of popular conservative views.
Sad to watch.
The Schadenfreude analysis is a little superficial.
Gov. Walker proposed his budget repair bill February 11, 2011. The Democrat legislators fled to Illinois forcing the Wisconsin legislature to remove some provisions so that the bill could be passed by a simple majority. On March 18, 2011 Judge Maryann Sumi refused to allow the Secretary of State to publish the law. The Democrats then protestedd that the law could not take effect until it was published and Sumi enjoined the law from being enforced while there were legal challenges. On June 14, 2011 the Wisconsin Supreme Court overturned Judge Sumi. So the law did not take effect until June of 2011.
If you look at Menzie’s first graph and remove the period of time the Democrats refused to allow the budget repair bill to be implemented the slope of Wisonsin is greater or the same as that of CA and Minn.
Gov. Walker’s budget is now law and his administration is following the lead of North Carolina and Texas, not California and Minnesota. A better measure of what the future will bring for Winsonsin would be to look at those two states.
Wisconsin still has a long way to go to match North Carolina and Texas ubt it is headed in the right direction, and will continue as long as the people can prevent the public unions and Democrats from sabotaging the recovery.
Could you throw Wa. State into this mix. I swear we have been trying to out do Wisconsin with bad economic policy. We also seemed that it was necessary to prove that what we hated most in the great recession was kids and teachers. What we liked most was giving tax breaks to corps. We did have a couple of things going for us. 1. Highway construction was going on and Boeing did not experience a cyclical downturn.
ricardo, in think you are mistaken. Wisconsin would certainly improve if only Walker would quit sabotaging the economy of his own state in order to showcase his economic ideology. funny how you blame lackluster performance on democrats, when the republicans control the government. and texas would be a nice comparison, if only Wisconsin was blessed with an overabundance of oil to sell. you think texas success is a result of sound policy-or simply access to an abundant natural resource it can sell to other states?
Hans: I do not understand your calculations. For nonfarm payroll employment (from BLS, data up to November 2013), the change in Wisconsin employment, November over January, I obtain 3.2%. For California, I obtain 5.1%. What series are you using?[edit MDC 1/24, 11am, these are figures for 2013M11 over 2011M01 — correct numbers for 2013M11 over 2013M01 are WI 1.3% (not annualized) vs CA 1.5%.]
rd: I’ve added a picture. Apparently having a high tech sector helps, as well as an environment welcoming of diversity. WA cut inflation adjusted spending relative to pre-recession 0.7%; WI 15.3% [1] (For information on where Wisconsin sits in high tech, see this report — it ain’t real pretty, and I’m not sure that current slash and burn policies on K-12 will help).
Neil: I use the coincident indices because I don’t have it normalized by population; I’ll try to get a monthly population measure so I can normalize the coincident index. Once I do that, it will reproduce the per capita trends I mentioned. Let me reference once again this blogpost, you will see that per capita, WI has lagged MN by 2.2% since 2011, even though in the decade before Governor Walker took office, WI and MN growth was comparable. In other words, if you are having a hard time following, per capita trends diverged post 2011.
Thanks, I could have sworn that I saw a similiar graph that showed Wa. among the top 10 in education cuts – could have been trying to read w/o my glasses. We are now under a court order to spend more on education so someone thinks we have been underfunding education. Also no raises or cost of living adjustments for teachers in 5 years.
Menzie,
Your side note reached a new low for this blog. You would make Joseph Goebbels proud! Oh, I know you didn’t write it – plausible deniability.
Perhaps Gov Walker should take a trick from the Minnesota playbook and underfund public pensions to the tune of 17 billion dollars. Then he could have Minnesota’s incredible growth!
Menzie
You have added a new comment about a projection derived form the Philly Fed Coincidence. I find it telling that suddenly you have shifted emphasis to the west coast away from Minnesota. I take it you are concerned with the political ramifications that the gap is closing since the two Midwest states enacted major tax policy differences in 1/13 and that very worrisome tail in the Minnesota line.
And of course, it would be easier to visualize if you would simply add a chart normalized to 1/13.
However, I am quite interested in the predictability over time of the coincidence index. It would be quite informative if you documented what a projection made in January of 2013 would have predicted for the subsequent two six months periods after that date. After all we now have the real data. My guess, the gap is less than predicted. And throw in Minnesota. it is much more relevant than the west coast.
Ed
And when the argument doesn’t go your way, time to pull out the Nazi Card, eh, Ricardo? You do realize that you are referencing 70-year-old history, and that the analogy is not only laughably inaccurate, but betrays a deep misunderstanding of actual history?
But let’s return to substantive debate and eschew the personal attacks. So you say we should follow the lead of Texas and North Carolina? Well that would be a strange lead to follow:
Labor Force Participation: WI 68.3%; TX 65%; NC 61.8% (Source: Governing Magazine)
Median Income: WI $50,395; TX $49,392; NC $43,912 (Source: BLS)
Median Hourly Wage all occupations:: WI $16.18; TX $15.55; NC $15.31 (Source: BLS)
Unemployment Rate: WI 6.3%; TX 6.1%; NC 7.4% (Source: BLS)
Seeing that Texas unemployment is the only one of these statistics that is superior to Wisconsin, you are going to need to tell me, what direction you want Wisconsin to move towards?
I could go over educational statistics, morbidity and mortality information, where Wisconsin stands above TX and NC, but I don’t want to be accused of bragging. But one wonders what kind of post-apocalyptic dystopian nightmare land you would really wish to call home?
Ed Hanson: Oh, am happy to reiterate the continuation of the outperformance of WI by MN; as of November, it’s 1.7%, and the projection is still 1.3% by May 2014. Doing a proper out-of-sample forecast evaluation takes time; the documentation for the projections is at the Philadelphia Fed — see here.
I look forward to your next no-date defense of current WI performance.
Ricardo: Since you’ve learned a German word, then let me ask regarding the side note — wahr oder nicht wahr? In other words if it is true, is it propaganda because it does not fit into your world view? That seems to be your implication. If not true, I would like to see your documentation. To my knowledge, the Walker Administration has not denied the assertion.
I am sorry, Professor Chinn, that I did not provide the link for my numbers.
http://www.governing.com/news/headlines/gov-states-adding-most-jobs-2013-map.html
I am not sure which data base they used, however, Wisconsin did not have 3% employment growth for 2013, unless I am not understanding the BLS statistics.
Hans: Thanks. I understand the discrepancy; the article uses y/y through October. November data has been available for nearly a month, and I used November data. I did the calculation for November over January 2011 (my mistake — apologies!). For the November over January 2013 period, WI is 1.3% vs MN 0.8% (not annualized, not in log terms). The fact that the number varies substantially if one does y/y suggests that one not report merely one statistic but rather a time series, which is what I have done in Figure 2, and in Figure 2 of this post (which you commented on on December 22 — three times(!), if you do not recall).
Menzie you wrote in part;
“Oh, am happy to reiterate the continuation of the outperformance of WI by MN; as of November, it’s 1.7%, and the projection is still 1.3% by May 2014.”
I like the trend. And taking it further, on Jan 1, 2011, (taking out my new and improved Menzie tape measure) the gap was ~2.1%, and as you say November 1.7%, with 1.3% coming. Among other changes, supply-side tax cuts work to accelerate recovery and unfortunately for Minn., untimely and poorly constructed tax increases retard growth. This would be marvelously illustrated with normalization to Jan. 1. 2013.
As for recalculating Philly Fed projection. I do appreciate your limited time. I was just curious how well the projection worked when the period encompassed major tax policy changes. I will look at the referenced Philly after work tonight.
Finally, as for your “no-date defense”, I do not know what you mean. I will attempt to explain my ways if and when you explain further.
Ed
Ed Hanson: Apologies — that’s a typo: I meant to write “no-data”.
I would be a little careful about the forecasts; I believe there is lots of variability. At an earlier time — August 26 — it was pointed out to me in that the forecast was for WI to surpass CA. That (clearly) did not come to pass. So I am with you in the sense that we should ascribe more importance to the coincident indicators.
Ed Hanson: Point of clarification — you cite a gap of 2.1% as of 2011M01; I’ve normalized on 2011M01 so the gap is by definition 0. Do you mean 2013M01?
By the way, even if there is eventually a catch-up (I’ll believe it when I see it), the WI cumulative economic loss relative to MN is 3.8% of gross state product, if one thinks of the coincident indices as proxying for Gross State Product (essentially the integral of the space between the MN and WI series from 2011M01-2013M11).
Menzie
Yes, I meant Jan. 1, 2013, typos abound.
As for my “no-data” approach, I have carefully used the data which you have published or that linked by you. I trust your data, and am quite comfortable using it to make my points.
Yes, there has been a relative change in GSP since 2011, as there was before 2011, and will be after November 2013. You already know my opinion on that, Wisconsin chose to deal with the problems left over from the recession immediately, while Minnesota postponed the pain and punted by use of unfortunate accounting manipulations. The payoff of the two policies is now evident. Wisconsin is able to reduce taxation, both personal and business, allowing both people and business to keep more of what they earn, and to create a sound basis for accelerated wealth creation. As President Kennedy so aptly said, “a rising tide”. One indication of the rising tide in this case, is demonstrated by the tax revenues to the state of Wisconsin far higher than projected. Minnesota, on the other hand, had to pass a huge tax increase on both personal and business and who knows what else in that monstrous 500 some page legislation. Much of the revenue taken from those who earn it going to pay for those accounting manipulations. Already, tax revenues are, at best, static to projection, and shortly the tide will be falling.
One last comment. Unlike some it seems, I have no animus toward those states which embark on a different path than I would choose. I hope it works out for Minnesota, but I am afraid its citizens will pay for tax policy that is beyond its tax capacity.
Menzie,
In rerponse to your comment about your tasteless side note consider this headline:
ECONOMISTS MENZIE CHINN WELCOMES CHILD ABUSERS AND DRUG ADDICTS TO HIS CLASSROOM
Then the story notes, “Chinn has never denied that he welcomed child abusers into his classroom and has never disavowed their actions.”
Because of your bias you missed the fact that the Walker administration said that had they known of the man’s past they would have never welcomed him. You are becoming more and more a political hack who is more interested in slander than truth. You have to be out of your mind if you really believe any politician would welcome a child abuser intentionally.
“Wisconsin is 7th…in slashing per pupil spending.” So, I take it that SAT, ACT scores have plummeted in Wisconsin too, yes?
Applying the Menzie standard to the auto industry: management and their brethren in the UAW should not strive to “slash costs”……… because consumers prefer more expensive cars to less expensive cars with equal quality.
ricardo, menzie did not write that article. so the only person guilty of slander in this exchange is YOU! and I assume you share a similar display of outrage with the publishers of drudge report?
Menzie, do you suppose there may be an underlying anti-competition attitude in Wisconsin’s unions that are a drag on industry and other business enterprises?
http://youtu.be/PqyYqLgkhnw
The chart shows Walker’s projected jobs versus actual. OK, fair enough. Walker promised 250K and so far with 1 year to go Wisconsin has seen an increase of about 104K. It’s positive job growth but not nearly as fast as expected.
I don’t have a problem with comparing the promise to the reality. But if we are going to do that, let’s apply the same standard to the other side.
Take a look at this video of the President-elect’s radio address on Jan 10, 2009 in which he predicts that his policies will create 3-4 million jobs. He notes that his CEA chairman, Christina Romer, is putting out a report with the estimates. Romer explains the report in this video. If you look at the report, you can see that the new Administration believes that its policies will create 3.675 million jobs in the following 2 years.
Now let’s apply the same standard that is being applied to the Walker Administration. How did the Obama Administration’s promise fair? Over the next 2 years, instead of creating 3.675 million jobs, the economy lost about 3 million jobs.
While noting that job growth has been positive in Wisconsin but has fallen short of the goal so far, let’s also remember the massive, abysmal failure of policy on the other side.
stryker,
since you don’t like the Obama outcome, tell me what policy you would have implemented and how successful it would have been. and you even have the advantage of hindsight. have at it.
Rick Stryker: In the pre-inaugural Romer-Bernstein analysis, the impact was expressed relative to a baseline. Governor Walker made no such caveat — he merely said there would be 250K more jobs by January 2015. Perhaps he should have expressed it relative to a baseline — but he didn’t. Moreover, he recommitted to this promise just five months ago!