Tensions between Russia and Ukraine have prompted some discussion of revisiting U.S. policy on exports of oil and natural gas.
Speaker of the House John Boehner (R-OH) last week called for faster Energy Department approval of facilities to export liquefied natural gas (LNG). Senator Lisa Murkowski (R-AK) called for lifting the ban on U.S. crude oil exports. Here I offer an assessment of these proposals.
There is no question that Russia’s critical importance in world energy markets is a key factor deterring the West from responding more vigorously to recent events. Russia accounts for about 1/8 of world production and net exports of crude oil and 1/5 of world production and net exports of natural gas. Russia is a key supplier of natural gas for Ukraine and Europe. The rest of the world cannot get by without energy from Russia. If the U.S. or Europe try to respond to recent events by imposing significant sanctions, one possible response would be a partial embargo by Russia on sales of energy to those countries that would be most vulnerable to such a disruption.
Although Russia’s strong hand derives in part from its role as a critical supplier of energy, it is hard to see how relaxing restrictions on U.S. exports of oil and natural gas would make much difference for any of these calculations. Even if more LNG facilities were approved tomorrow, it would still take years before they would begin delivering gas to customers, and it’s inconceivable that the U.S. could ever replace the 7.4 trillion cubic feet of natural gas that Russia exported in 2012. Notwithstanding, Europe’s vulnerability to a disruption in natural gas supply is going to be an issue for some time, and more U.S. exports might mitigate that. Ambassadors from Hungary, Poland, Slovakia and the Czech Republic support Boehner’s call for increased LNG exports.
In the case of crude oil, it is even harder to make the case for relaxing export restrictions because of geopolitical considerations. Despite recent increases in U.S. production, the U.S. still imports on net around 5.5 million barrels a day. And the U.S. will continue to be a major net oil importer as far into the future as anyone can see.
The principal arguments for relaxing restrictions on U.S. oil and natural gas exports are economic rather than geopolitical. In the case of oil, the first obvious question to address is why we would want to export any oil at all when the country as a whole remains such a huge net importer? The answer has to do with differences in the types of oil that can most efficiently be processed by different refineries and the cheapest way to transport the right type of oil to each refinery. For example, the overall mix of light and heavy crude used by U.S. refineries has changed relatively little over the last decade.
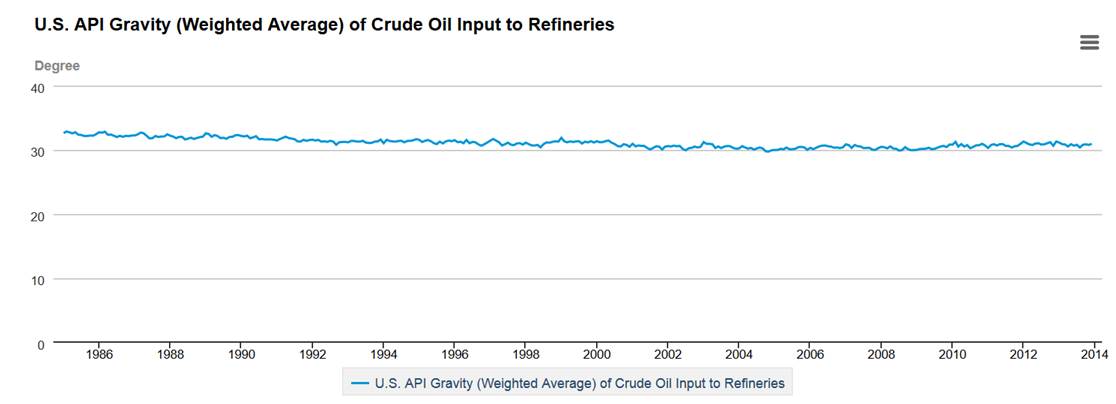
Source: EIA.
Notwithstanding, the surge in domestic crude oil production has been disproportionately in the lighter crude oil. The result is that U.S. imports of light oil have plunged while we’re still importing as much of the heavier stuff as ever.
![Tan: U.S. imports of crude oil with API above 25, in millions of barrels per day; blue: U.S. imports of crude oil with API less than or equal to 25. Data source: EIA [1], [2].](https://econbrowser.com/wp-content/uploads/2014/03/api_imports_mar14.png)
Tan: U.S. imports of crude oil with API above 25, in millions of barrels per day; blue: U.S. imports of crude oil with API less than or equal to 25. Data source: EIA [1], [2].
Given the existing infrastructure for transporting and refining oil, the cheapest way to get each individual product to the location where it is most valuable could turn out to involve simultaneously importing and exporting different kinds of crude oil from different locations.
We’re already doing a version of that. Access to cheap crude in the central U.S. has given refineries there a big international advantage. Unlike crude oil, we have adequate transportation infrastructure to move the refined product to wherever it’s most in demand, and no legal restrictions on export. As a result, refined products like gasoline and diesel end up being shipped all over the world, and U.S. exports of refined products have surged.
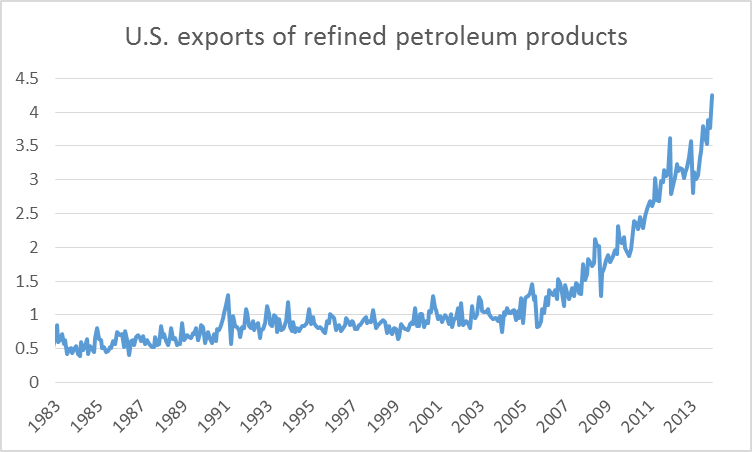
U.S. exports of refined petroleum products in millions of barrels per day. Data source: EIA.
Note nonetheless the scale on the above graph. We’re exporting about 4 mb/d in refined products, but simultaneously importing about 9.5 mb/d in crude oil and refined products; hence the net import figure of 5.5 mb/d quoted above.
Interestingly, even without legislative action on relaxing the ban on crude oil exports per se, companies are getting more creative in figuring ways around it. We’re starting to see mini-refineries that process the hydrocarbons just enough to qualify as producing a “refined product” for purposes of getting around the legislative ban, which can then be shipped abroad for further processing.
What are the economic consequences of all of this? Any time one relaxes trade restrictions, there are winners and losers. Domestic producers of the crude oil would be better off because they are able to sell their product for a higher price to international buyers, and domestic consumers (for example, U.S. refineries) would be worse off because they have to pay that higher price for buying the product they use. But exporting a product when there is a foreign buyer willing to pay more than the domestic buyer is usually a more efficient way to do things. The benefits to domestic producers from allowing those exports are bigger in dollar terms than the losses to domestic consumers.
Any geopolitical implications of those efficiency gains have to be modest indeed. One might argue that the higher price received by producers of crude oil in North Dakota and Texas will provide an incentive for more total production than we would otherwise see. While I believe that to be the case, to propose that the quantities are large enough to make a difference for the balance of geopolitical power seems farfetched.
Similar issues are at play in the question of exporting U.S. natural gas. U.S. producers of natural gas would gain, U.S. consumers of natural gas would lose, but the benefit exceeds the cost in dollar terms. One might try to argue that an important consumer of cheap U.S. natural gas is American manufacturers, and that trying to rebuild U.S. manufacturing has other benefits beyond the immediate profits for the companies and workers involved. And it’s possible that the companies seeking to export LNG have miscalculated what the supply and price are going to be at the time those facilities come on line.
There are clear limits to the ability of an overseeing government planner, however wise and benevolent, to make these calls. Indeed, the success of modern economies comes from letting these decisions emerge from the decentralized calculations of thousands of different individual stakeholders. If somebody thinks they can make a profit– in other words, thinks they see a more efficient way to make use of existing resources– by investing their own money in new LNG export facilities, I’m inclined to say, let them try. For this reason, I would be in favor of relaxing restrictions on U.S. exports of both crude oil and natural gas.
But I would not want to make excessive claims about how much that is likely to accomplish.
The US instead should ask Qatar to increase its natural gas production and LNG exports to Europe. Didn’t the US do something similar in the 1980s with Saudi oil?
US refineries are dealing with 3 million bpd of imported light oil now. What potential purchaser of exported light oil is closer than existing US refineries? Unless it is somehow cheaper to ship light oil to a refinery in Europe or Asia than to a refinery in the US, I see no incentive to export. Since we are still importing that 3 million bpd of light oil, why should anyone expect any significant exports until future increases in domestic production of light oil exceed the amount we are still importing?
“Unless it is somehow cheaper to ship light oil to a refinery in Europe or Asia than to a refinery in the US, I see no incentive to export.”
It is indeed cheaper to ship light oil to a refinery in Europe or Asia than to a refinery in the US, The Jones Act which mandates that oil transported between American ports must be transported in a very limited number of tanker ships built in the US and manned by American sailors. There is essentially no foreign light oil imported into the US Gulf Coast. All of the splitters designed to process crude oil just enough to permit its export are on the Gulf Coast. If the Jones Act were repealed light oil would be transported by foreign tanker to the East and West Coasts. Oil producers would gain. Oil product consumers on the East and West Coasts would gain. The only large loser would be Warren Buffet’s railroad which is the major rail shipper of dangerous oil products at the risk of thousands of lives in the cities where this explosive oil passes. But Warren is the key supporter of the Democrats in the business community. No exemption from the Jones Act for oil shipments is likely to come from this Administration.
Thank you Levis for reminding me of the Jones Act. I live in Hawaii, which is greatly affected by the Act, so I should have known better.
I take it then that Gulf Coast and Midwest refineries that process light oil are glutted with domestic production. The East and West Coast refineries that refine light oil have a choice between imported oil and oil delivered by rail or what few pipelines might exist. Still, if exporting were allowed, it would only happen if transport by pipeline to the closest port, thence shipping to Europe and Asia, were cheaper than by rail to the East or West Coasts. I guess that must be the case or there would be no calls for export from light oil producers.
On the political front, exported light oil would do the refineries and consumers on the Coasts no good, so there is not likely to be much political support from them. In fact I suppose they would like to keep the domestic producers of light oil hostage. If they can’t export, they have to sell to the East and West Coast refineries at a delivered price lower than the imported price to be able to sell at all. And Gulf Coast refiners (not splitters) would be against exports, since they could lose their cheaper domestic sources of light oil. So it looks like it’s the domestic producers of light oil against everyone else on the export issue. I would be surprised if they win.
As Steven Kopits noted down the way, it’s really Mid-contienent producers versus Mid-continent refiners, since consumers largely pay Brent based prices for refined products. Basically Mid-continent refiners are paying WTI based prices for crude oil but charging Brent based prices for refined products, and pocketing the difference as high crack spreads.
I’m fascinated by the widespread reporting in the media about how exports of US oil and natural gas to Western Europe could reduce Western Europe’s dependence on energy imports from Russia. Of course, one small, itsy-bitsy, tiny little problem is that the US is a net importer of both crude oil and natural gas. By why let a fact like that get in the way of a good story?
The most recent four week running average data showed that we net imported about 48% (7.3 mbpd, million barrels per day) of the crude oil processed daily in US refineries (15.2 mpbd). However, I think I have a solution as to how we could reduce Western Europe’s dependence on Russian oil. The US could boost crude oil imports from Russia by 2 mbpd, and if we could change the US law on crude oil exports, the US could then export 2 mbpd of crude oil to Western Europe. Problem solved!
In any case, if we assume a (conservative) estimate that the underlying decline rate from existing US oil production is about 10%/year, then in order to just maintain current US crude oil production for 10 years, we would have to replace 100% of current US crude oil production over the next 10 years. Or in round numbers, based on the foregoing, just to maintain the current US crude oil production rate (7.4 mbpd in 2013) for 10 years, over the next 10 years we would have to replace the productive equivalent of the combined 2012 crude oil production from Canada + Mexico + Norway
On the natural gas side, Citi Research estimates that we have to replace 100% of current US natural gas production (66 BCF/day in 2013) in about 4 years, just to maintain current US natural gas production for 4 years. Or in round numbers, based on the Citi Research estimate, in about 4 years–in order to maintain a production rate of 66 BCF/day–we need to replace the productive equivalent of the combined 2012 dry processed natural gas production from: Iran + Qatar + Canada + Norway + Netherlands.
Luke,
In answer to your first question: Canada. Gulf Coast producers have been shipping 200 000 barrels of light crude a day to refineries in eastern Canada for some time now, according to a colleague in the Texas oil patch. Canada has preferential status when it comes to exporting US crude oil, and the Eagle Ford Shale (east Texas) produces very light oil. The Permian Basin (west Texas and adjacent New Mexico) will be adding more and more too.
The economics apparently make it worthwhile to ship to Canadian refineries even with the cost of transport.
Here are the most recent net import data for the US (EIA):
Net Crude Oil Imports: 7.3 mbpd
Net Product Imports: -2.0 mbpd*
Net Total Liquids Imports: 5.3 mbpd
*Net product exports expressed as negative imports
A couple of things are being missed:
If the US encourages exports, that will raise prices for both US oil *and* gas production. ND production is significantly discounted, and that discount makes a real difference. More importantly, US gas is *far* below the world price, and production could be raised very significantly if prices rose. For instance, about 35% of ND gas is being wasted: just burned (flared)! Much US gas production is accidental: it comes along with the oil which is the real production goal. Oil companies are running away from deliberate gas production as fast as they can, and moving to find oil (or “liquids”).
In turn, if US gas production were priced near the world price, that would raise the price of natural gas electrical generation well above that of wind (NG is the only source of generation cheaper than wind in the US), and around that of solar, which would accelerate the transition to wind and solar and free up much more gas for export.
Finally, it’s worth noting that the US has reduced it’s oil imports by about 50% in just the last 7 years – it could eliminate the rest of it’s imports in 10 years, if it chose the proper public policy (higher CAFE and fuel taxes). It may get close to that even without changes in policy.
I have my doubts about Russia cutting of either oil or gas exports to Europe. If they cut off the gas, the Russians have to count on the long-suffering Nabucco pipeline being built and the Aphrodite and Leviathan eastern Med fields being brought on line faster.
As regards prices, US consumers of course pay Brent-linked prices for gasoline. An increase in the domestic oil price would primarily affect refineries.
During the period Dec. 2010 to Dec. 2013, US oil consumption declined by 750 kbpd, even as refinery inputs increased by 1.1 mbpd. During these period, net product exports increased by 2.4 mbpd. Were it possible to export crude oil, US refinery inputs could have fallen by 0.7 mbpd; as it is, export restrictions (combined with such comparative advantage as the US refiners might have) have bolstered US refining by on the order of 1.2 mbpd, of 16 mbpd current refinery inputs.
Now, I am as pro-oil and gas as anyone, but this is pure insanity. Export restrictions are leading to a refinery boom, including the constructions of “splitters” (mini-refineries) noted by Jim above. If I were a Democrat, I would insist on export restrictions being lifted as being preferable to beefing up the refinery sector. Democrats, however, seem to prefer a robust and growing US downstream sector. Bizarre.
Steven,
There is a steady stream of claims that the current “occupant” is an enemy of US oil production and a proponent of hurting US oil consumers, and it seems like a safe bet that lifting export restrictions would be used as material for those attacks. That’s a strong disincentive to intervene in this intra-industry food fight.
Further, it may be more efficient overall to allow exports, but expanded US refining and rail transportation helps US employment. Heck, ceteris paribus, an expansion of domestic value-added refining is a good thing. Of course, all things aren’t equal, but it’s not a bad idea to keep in mind.
If you want more refining, well, you’re going to get it.
Keep in mind that I have forecast US consumption to fall (leaving aside the unresolved issue of the impact of increased US oil production on US oil consumption). Refining is a business we should be exiting over time. It’s the left-wingers among us who should be screaming about building new or expanding existing refining capacity in the US. I find it a bit ironic that all the AGW guys are OK with building more capacity in the US.
It’s helpful to keep in mind that the “AGW guys” aren’t the same as “left-wingers” – there are a fair number of conservatives who recognize that AGW is the scientific and international consensus. Those who disagree with that general consensus are those who blindly follow their political leadership, which has decided to ally itself with carbon emitting industries that want protection from the inevitable “creative destruction”.
That said, you’ve got a good point: tar sands oil is somewhat stranded right now, and unbottling N. Dakota oil would also uncork Alberta. Personally, I think coal is a far more important problem than tar sands, but containment of Alberta has become symbolic of fighting CO2 emissions. Oddly enough, Canadian oil is also imported oil – I don’t know why US politicians would feel a need to assist it.
Because they understand that oil is a globally priced product and any production added to world supply helps to drive price down?
Nony,
Yes, that’s true. But if you add the cost of pollution, it’s probably more expensive than the alternatives, so it’s not really all that desirable.
It’s that hidden cost that gets ya.
The Professor wrote:
Professor,
This is one of the most enlightened paragraphs I have seen on this site in a long time. Thank you.
What if we slightly change the words from “investing their own money” to “investing their own debt”. A lot of investment today is funded through debt, not actual cash on hand. Any idea how much better/worse investment outcomes are between your own cash vs somebody else’s cash? In failure, I can declare bankruptcy and wipe out debt. Losing my cash hits my bottom line more, since I would have bankrolled the whole investment.
One might ask what would happen to Europe if the Russians decide to export more oil and NG to China rather than Europe. Don’t even go into whether it makes sense economically. The world is dealing with the Russians… specifically Putin. You don’t think he’d have a smile on his face watching the EU twist in the wind and seeing the U.S. scramble to figure out how to “save” Europe… along with all of the other “saves.” First comes NG to China, then they’ll work on the oil. Europe is SOL if it thinks it can get away with their “green” agenda and “pressuring” Russia over the Ukraine at the same time.
Bruce Hall,
your assumptions are strange and a little bit naiv.
First, we have a global market for oil, therefore, Russia does not gain anything by selling oil to China, somebody else is replacing the “loss”.
However, at least in case of NG the situation is more interesting. 🙂
Russia exports the NG via pipelines, i.e. Russia is chained to her European customers. BTW until 2018, 60% of the exported NG run through Ukraine.
It is not possible to change this situation within a few years and BTW nobody expects that China would pay European prices. In addition, it does not improve the Russian strategic situation that the Russian LNG capacity is quite low.
The Russian government depends to a very high extend on energy exports and all attemps to diversify the Russian exports have failed yet, therefore, the whole affair is more a problem for Russia than for Europe in the medium and long term, esp. when we consider that Russia faces declining conventional oil production and higher domestic demand.
A partial solution for us poor European souls are more LNG facilities and higher energy efficiency, this would offer alternatives. For Russsia a (civil) war in Ukraine is the worst case scenario, therefore, I do not expect occupation of larger parts of the Ukraine, it does really not make sense IMHO.
Baffs asked in an earlier post about IOC cost increases.
I deal with situation of IOCs on slides 40-50 of my Columbia presentation (link below). I would add this presentation really does seem to be the state of the art in oil markets theory, so if you’re a reader from the Fed, CBO or a major university, you could do worse that flip through the slides or actually watch what turns out to be a very fast-moving one hour presentation. It’s quite accessible and touches on pretty much everything you need to know about oil markets today.
Now, back to Baffs’ question. You’ll recall that I have consistently stated that there was an inflection point in the oil supply in 2005–it pretty much stalled out. And that’s still true. The legacy system of 2005–that is, excluding shale oil and oil sands–produces less today than it did in 2005. Jim has also noted this.
If this is true, then we can make the case that the legacy system did indeed peak out in 2005. If it did, then we would expect a normal distribution around that peak, that is, the rate of departure from the peak should be the same as the approach to the peak.
But that didn’t happen. As you can see on slide 48, legacy oil production remained at levels much higher than expected by a normal distribution with a 2005 peak. Why? Well, because we threw a vast amount of money at the system, about $1.5 trillion more than we would have in the 1998-2005 period for a similar result. If we assume that a flowing million barrels of capacity costs $150 bn today, then that $1.5 trillion translates into about 10 mbpd of gross capacity, figure maybe 7-8 mbpd net of subsequent declines. (Deepwater, for example, can decline by as much as 25% in the early years of production.) And if you look at the graph, you see that actual legacy oil production was around 81 mbpd, when the expected would have been around 75 mbpd. Therefore, we can argue the case that all this extra investment did have a positive effect–it prevented the oil supply from declining faster than it would have otherwise.
Now, if you use supply-constrained forecasting (which I introduce in the beginning of the presentation), you could have forecast that we would see oil price resistance around $110 / barrel, which we have. Thus, the strategy of increasing capital intensity (investing more) due to higher oil prices–well, that strategy ran its course in 2011. Therefore, IOCs can–and now, could–no longer expect material oil price increases to save them from diminishing drilling and production opportunities.
But what of costs? If the normal curve concept is correct, then trying to maintain oil production at earlier levels becomes increasingly expensive. The natural decline floor falls away from peak oil production levels, and does so at an increasing pace. So, in a normal curve, as you depart the peak, the rate of decline increases at an increasing pace until you hit the inflection point somewhere halfway down the curve.
Thus, in attempting to hold earlier production levels, we would expect the IOCs to see increasing costs at an increasing pace. Is there any supporting evidence for this assertion? Let’s take a look at Shell’s opex (production and manufacturing expense) on a per barrel basis to see if this is true:
2008: $21
2009: $23
2010: $22
2011: $26
2012: $27
2013: $33
In just three years, Shell’s opex has risen by $11 per barrel, even as Brent oil prices have eased. I have earlier described Shell’s decision to suspend production guidance as “catastrophic”. This sort of dramatic deterioration in costs is truly catastrophic–and consistent with a model postulating a legacy peak around 2005.
I have earlier written about the collapse of capital efficiency at the oil majors, which is (nominally) one fifth of what it was in 2000 (slide 40). Thus, if we combine the collapse of capital efficiency with exponentially increasing opex, then we have a very, very ugly scenario before us. If we assume the oil majors develop their projects in order of economic attractiveness, that means most of the remaining oil projects in their portfolios are worse than the ones they’ve already developed–and they weren’t that great. How many of the remainder are viable at all?
In turn, this suggests we’ll be seeing falling capex from the majors; perhaps dramatically falling capex. We’re already beginning to see it pretty much across the board at the IOCs, just as I predicted more than a year ago.
Now, the way this plays out not only can be forecast, it can be calculated. If we accept the normal curve, then at best, the IOCs will be able to run parallel with the decline curve from here on out. But is that strategy profitable? It may be that the IOCs (and others affected by market economics, including the likes of Petronas and Pertamina) have to return to the natural decline curve. That would involve letting off something like 10 mbpd of production over the next, say, seven years. As it is, the IOCs production has been falling at a pace of 750 mbpd / year (2010-2012), and that was with massively increasing amounts of upstream spend. What will happen when capex is falling by 10% per year? In any event, I can tell you that there are virtually no degrees of freedom in how this plays out (leaving aside some sort of major improvement in technology or market access.) The outcome is not a forecast, it’s a calculation. (I haven’t worked through it yet.)
If I consider this from the policy perspective, then we have to consider how the aggregate oil supply might play out. US shales are considered to have maybe 2-3 more blowout years before peaking. Shale production is currently growing in excess of 1 mbpd / year; however, the EIA projects this growth to be only 600 kbpd in 2015 (which is still a fantastic number by any normal measure). By 2017, shale growth could be pretty minimal, perhaps 200 kbpd. Supply may also increase from the petro-exporters like Mexico and Venezuela. The pressures on them will surely cause them to open their markets. How much will this help, and when? And how much more can we expect from Saudi Arabia? If the answer to the latter two questions is “not much”, then there is the real prospect of the oil supply peaking out in absolute terms around 2017.
And then Menzie, Scott Sumner and Mark Sadowski better hope like hell that there’s no linkage between oil and GDP growth (slides 51-57), because if there is, the global economy is going to start seeing some real pressure around that time. That’s the policy concern.
So, Baffs, that’s my view of IOC costs and their implications. And now you know something that Exxon, Chevron, BP and Citi don’t. They don’t use supply-constrained forecasting, so everything that is happening to them is a surprise. They don’t have this model. They don’t know why oil prices stalled out at recent levels. They don’t know why oil prices aren’t increasing. They don’t know why capex and production costs are increasing exponentially. They’re on the train, but they don’t know where it’s going or why.
To wit, here are a couple of quotes from CERA Week:
“We cannot continue to swallow this huge inflation,” said Christophe de Margerie, CEO of Paris-based Total. Lars Christian Bacher, executive vice president for development and production at Norwegian energy company Statoil, put it in existential terms. “The capital intensity of this industry is heading in a direction that’s not sustainable,” he said.
Indeed, over the last decade, global oil companies have increased capital spending more than 400 percent; production is up just 2 percent in that time, Bacher told the audience. Changing that equation, he said, “is a question of whether we will survive or not in the long-term.”
Indeed. That’s where we are today.
http://energypolicy.columbia.edu/sites/default/files/energy/Kopits%20-%20Oil%20and%20Economic%20Growth%20%28SIPA%2C%202014%29%20-%20Presentation%20Version%5B1%5D.pdf
http://energypolicy.columbia.edu/events-calendar/global-oil-market-forecasting-main-approaches-key-drivers
Thanks Steven and Jeffery. Slowly I am becoming a convert to what is your reality predictions.
Your comment about “the real prospect of the oil supply peaking out in absolute terms around 2017” is interesting , because it is what the CDS is signalling since 2008 (that s when data about CDS are available), that is a potential economic slowdown around 2017:
http://fantazzini.narod.ru/int.html#cds
The plot above is in log-scale to filter out the fact that the 5-year cds is the most liquid cds.
Dick –
I don’t know. The oil futures curve argues differently–it’s not showing any peak there. The notion that the oil supply could peak out around 2017 is not a widely appreciated point, even by peak oil acolytes.
And let me re-affirm, at this junction, a 2017 peak is for the moment just a plausible scenario. It’s too early to call it a forecast or prediction.
I don’t know what it will be, but we appear to be on the verge of another technological shift for energy production. I am positive that the current set of alternative energy sources will not suffice as a break through. I am however watching movement in the cold fusion/Low energy nuclear reaction (LENR)/ electron induced nuclear reaction (EINR) areas. LENR and EINR have recently received patents. Toshiba holds the EINR patent, and describe EINR: “Moreover, the experimental results of the above-described example one and example two are extremely well explained by the EINR (Electron-Induced Nuclear Reaction) model that appeared in the journal Fusion Technology, published by the US Atomic Energy Conference (Y. Iwamura, T. Itoh, N. Gotoh, and I. Toyoda, “Detection of Anomalous Elements, X-ray, and Excess Heat in a D2-Pd System and its Interpretation by the Electron-Induced Nuclear Reaction (EINR) Model”, Fusion Technology, vol. 33, no. 4, p. 476, 1998).” Their patent number is: ep1202290b1
And the patent discussion: http://www.google.com/patents/EP1202290B1?cl=en&dq=Nuclide+transmutation+device+and+nuclide+transmutation+method+EP+1202290+B1&hl=en&sa=X&ei=vnQNU-KoEeHl2AXdpICICQ&ved=0CDUQ6AEwAA
I am a supporter of fusion technology, but I think that is still a long way off – perhaps decades. We are a long way from experimental success, much less commercial success.
Baffled, check on LENR progress. there are at least 3 commercial efforts currently underway. 1 in the US, 1 in Korea, and another in Greece, with US Govt interest at NAVSEA and NASA that I know of with MIT doing much research. If EINR if commercially viable it has already been successfully tested.
I am leaning to LENR moving faster, because it is a much smaller, cheaper unit because its components are common. Here’s one blog that follows some of the technologies: http://coldfusion3.com/
OTH, how long AND IF the technology reaches commercial production is still in the air. Some say 1-2 Yrs and others are less sanguine. I’m just reporting here not advocating, too much anyway.
Nuclear technology -fission or fusion- has essentially nothing to do with oil since nuclear is (except for the nuclear navy and Tesla) does not provide fuel for transport and very little oil is used for anything other than transportation.
the current set of alternative energy sources will not suffice as a break through.
Ah, but they already have. Wind is already cheaper than coal in the US, and solar’s cost is affordable (the current level of about $.15 per kWh is below the grid price in a lot of areas), and still plummeting. Plus, conventional fission is here, and will work if needed.
Alternative energy is not except for Tesla used for transportation and is not a substitute for oil.
except for Tesla
That’s an enormous exception. Electricity is indeed a substitute for oil, whether it’s generated from nuclear, wind, coal, or scavenged from regenerative brakes in a hybrid electric vehicle (HEV).
levis,
keep thinking that way. we are moving toward a fully electric society. in the not too distant future, we will no longer think of hybrids-they will all be electric. will we have resistance-of course-the oil industry will scream and holler. but the inevitable future is electric and integrated. that is why alternatives are so interesting. but ultimately, if and when the next leap in fission or fusion occurs, the deal will be sealed.
Sorry, instead of Toshiba it was requested by: Mitsubishi Heavy Industries, Ltd.
RE: “NET EXPORT MATH”
I usually get qualitative objections to what is a set of quantitative mathematical observations about what I call “Net Export Math.” In any case, I would like to ask if anyone can identify any errors in the following statements. Note that I have added an ANE corollary.
EXPORT LAND MODEL (ELM)
Production declines in net oil exporting countries are inevitable, and given an ongoing production decline, unless they cut their domestic consumption at the same rate as, or at a rate faster than, the production decline rate, the resulting net export decline rate will exceed the production decline rate and the net export decline rate will accelerate with time. Furthermore, if the rate of increase in consumption exceeds the rate of increase in production, a net exporter can become a net importer prior to a production peak, e.g., the US and China.
ANE* COROLLARY
A decline in GNE* is inevitable (we have already seen, through 2012, a post-2005 decline in GNE), and given an ongoing production decline in GNE, unless China & India cut their net imports at the same rate as, or at a rate faster than, the GNE decline rate, the resulting ANE decline rate will exceed the GNE decline rate and the ANE decline rate will accelerate with time.
*GNE = Global Net Exports of oil, (2005) Top 33 net oil exporters, total petroleum liquids + other liquids (EIA)
ANE = Available Net Exports = GNE less Chindia’s Net Imports (CNI) = Supply of GNE available to importers other than China & India
Following is a link to my first article on net exports, focusing on the three top net exporters at the time (Saudi Arabia, Russia & Norway), where I introduced the ELM (Export Land Model) concept, which is just a simple mathematical model to help me understand, and then explain, “Net Export Math.”
Here is the link to, and the concluding paragraph from, my early 2006 essay on net exports.
Hubbert Linearization Analysis of the Top Three Net Oil Exporters (January, 2006)
http://www.theoildrum.com/story/2006/1/27/14471/5832
Excerpt:
“As predicted by Hubbert Linearization, two of the three top net oil exporters are producing below their peak production level. The third country, Saudi Arabia, is probably on the verge of a permanent and irreversible decline. Both Russia and Saudi Arabia are probably going to show significant increases in consumption going forward. It would seem from this case that these factors could interact this year produce to an unprecedented–and probably permanent–net oil export crisis.”
End Excerpt.
In retrospect, I was too pessimistic about Saudi and Russian production, but on the other hand, Saudi net exports have been below their 2005 rate for (probably) eight straight years, and Russian net exports stopped increasing in 2007, with Russian net exports in subsequent years being at or below their 2007 net export rate. As expected, Norway’s net exports continued to decline. The bottom line is that after combined (Top Three) net exports increased sharply from 2002 to 2005, their combined net exports were below their 2005 rate through 2012, which of course contributed to the post-2005 decline in Global Net Exports of oil.
We saw a very small increase in (2005) Top 33 Exporters’ production from 2005 to 2012 (a rate of change of +0.3%/year), but consumption (a rate of change of +2.2%/year) outpaced production, and GNE fell slightly, with a rate of change of -0.5%/year, from 45.5 mbpd in 2005 to 43.9 mbpd in 2012, as annual Brent crude prices doubled from $55 in 2005 to $112 in 2012.
Following is a link to the GNE “Gap Chart.”
http://i1095.photobucket.com/albums/i475/westexas/Slide1_zps3161a25b.jpg
Regarding ANE, as noted above the observed rate of change in GNE from 2005 to 2012 was -0.5%/year. Chindia’s combined net imports (CNI) did not decline at the same rate, they of course increased, and the rate of change in CNI was +8.7%/year, from 2005 to 2012. Therefore, ANE (or GNE less CNI) fell from 40.7 mbpd in 2005 to 34.9 mbpd, a rate of change in ANE of -2.2%/year. In other words, ANE fell about four times faster than the observed rate of decline in GNE.
Following is the ANE “Gap Chart.”
http://i1095.photobucket.com/albums/i475/westexas/Slide04_zpsd68833b7.jpg
Note that at the 2005 to 2012 rate of change in the GNE/CNI Ratio, the ratio would hit 1.0 in the year 2030 (16 years hence), which would theoretically mean that the supply of Global Net Exports of oil available to importers other than China & India would be zero.
Do I think that China & India will actually be consuming 100% of Global Net Exports of oil in 16 years? No, but it’s going to be one hell of an “interesting” ride.
Clearly, it’s time we kicked our addiction to oil. It’s been useful, but now it’s clear that it’s expensive, dirty and unreliable.
How expensive? I suspect that your intuition is that Peak Oil could cause a deep, lasting depression. In other words, our current dependence on oil could cause, say a loss of GDP of $3T per year for, say, 10 years. That’s enormous. That’s far greater than the cost of converting from ICE vehicles to various forms of electric (PHEV, HEV, EV, EREV, etc).
Or think of it another way: $3T per year is a lot of money per bbl of oil consumed in the US. Give it a discount and just tax fuel $5 per gallon (and rebate it, to eliminate the fiscal effect on the economy). That would cause a really fast transition away from oil.
Nick –
US oil consumption is 9% off peak; UK, 19%; Italy 25%; Greece, 32%. As you can see, we’ve already kicked our addiction to oil, as well as our addiction to prosperity.
No, that reverses causality – I think James and Menzie would agree that the main causes were multiple credit crises and real estate bubbles, complicated by the inflexibility of fiscal policy for the PIIGS countries. And, of course, a sharp recession will indeed reduce oil consumption, both industrial and discretionary.
Now, I think there is an argument that the depth of the PIIGS problems for each country was related to the level of their oil consumption, but that just shows that being heavily dependent on oil (and imports especially) is a bad thing.
The fact is that Europe has better and cheaper alternatives for oil. They properly tax personal transportation fuel consumption, but they heavily subsidize industrial/commercial consumption. That causes many bad results, like over use of diesel (because diesel is lower priced), and over use of inefficient long-haul trucking instead of rail (US freight goes mostly by rail, but most European freight goes by truck).
The US imports 5.5M barrels/day of oil, but 3M/day of that is from Canada and Mexico. So only 2.5M/day is imported from countries outside of North America.
If we can get a better regime in Venezuela, and get more imports from Brazil, then we can rely on our own hemisphere. It is quite absurd for oil to be shipped from the Persian Gulf, or for any oil to be crossing the Atlantic at all..
Combined net oil exports from Canada + Mexico fell from 2.5 mbpd in 2004 to 2.2 mbpd in 2012 (total petroleum liquids + other liquids, EIA). Combined net exports from the seven major net oil exporters in the Western Hemisphere in 2004 (Canada, Mexico, Venezuela, Colombia, Argentina, Ecuador, Trinidad & Tobago) fell from 5.9 mbpd in 2004 to 5.0 mbpd in 2012.
Brazil is a net oil importer, even if we count biofuels as “oil production,” with a recent pattern of increasing net imports.
The global macro trend is that developed net oil importing countries like the US are gradually being priced out of the global market for exported oil, as the developing countries, led by China, have consumed an increasing share of a post-2005 declining volume of Global Net Exports of oil.
I’m not sure why I should care one way or the other about a p**sing match between millionaire oil producers and millionaire refinery operators over who should get the most money. Consumers get nothing out of it.
You’ve clearly never driven through Elizabeth, New Jersey. Or visited the refineries south of Houston. If you’re not going to consume that oil, it’s not really an industry you want on your shores, all other things being equal.
Good to see James coming back to his classical economic roots and supporting free trade. [I still remember several years ago when he was talking 200/bbl oil and my take was that the best Bayesian bet is the futures market’s view. ;-)]
In addition to all of the above, it should be mentioned three things:
1. Construction of splitters in the US is a destructive use of capital for the economy. Steel in the ground that would not be there in a free trade scenario.
2. Energy does not turn on a dime. Takes time for supply to build, for export terminals etc. But oil/gas geopolitics and the Russia/Putin problem are not short term issues either. So, just because it does not immediately bail us out of Crimea crisis is no reason that it will not have impact over time. Look how the US buildup in early 80s military helped bring on the USSR collapse. Or how US oil/gas freed of price controls was a helpful wedge in the 80s to break the OPEC cartel.
3. Putin probably looks at US like I look at women. Judge by actions, not talk. Approving Keystone, fast-tracking LNG terminals etc. would send a message. Much more than G-8 dance-card snub.
P.s. Steve Kopits, I like your stuff. I think I am more cornie than you are peaker, but appreciate your brains and time spent. Had some questions for you at Gail’s site on the second page: http://ourfiniteworld.com/2014/02/25/beginning-of-the-end-oil-companies-cut-back-on-spending/comment-page-2/#comment-28572 Would be a treat to get your replies. I think you give me better econ insights than Gail.
Nony –
Some answers from Gails’s blog:
“a. why the demand versus supply view sides? I am used to seeing both discussed in micro-economics. A supply curve and a demand curve. Both changing as a function of time. And not just something out of a book, but normal for commodity analyses (metals, chemicals).”
If you’re demand constrained then supply will adjust to demand. If people want more BMWs, BMW will build more cars. If you’re supply-constrained, demand adjusts to supply. In a nutshell. This is the crucial point in my approach and the single differentiator between, say, Chevron, CERA, BP and me. It has absolutely huge implications for strategy. For example, if you believe demand is low due to a weak economy, then oil consumption will increase with an improving economy. If you’re supply-constrained, that’s not going to happen, to over-simplify a bit.
“b. The GDP effect of oil price is interesting and I agree it occurs. Oil is a fundamental feedstock of our economy. But I think this can still be captured by just some feedback in modeling (tweak the number lower from 3% or whatever, based on initial intersection of supply and demand). Probably some equation to do this. It’s more of an issue for someone who is mindlessly plugging in 3%, but then they shouldn’t do that. They should be considering segments of demand, substitutes, etc. 😉 ”
The price of oil is bounded by i) global carrying capacity, ii) cost of extraction, and iii) availability of substitutes. Carrying capacity is a knowable number. Cost of extraction is a knowable number. Then we come down to substitutes. You can see a furious pace of substitution for non-transportation fuels on slide 38. If we have to reduce oil consumption, it all comes down to how fast the economy can adjust. There’s no compelling evidence it can adjust at a pace above 3% indefinitely. If consumption is falling by 1.5% per year, then GDP growth will be capped around 1.5%. That’s what we’ve seen so far, plus or minus. But I agree, this topic deserves more research, something which I note in my upcoming article, “Seven Hot Topics in Macro Oil Markets”, as oxymoronic a title as that may seem to be.
“c. Talk a little bit more about the futures. Why backward? Obviously, you can just say “market is wrong” (and that can be valid…e.g. I was a dotcom bear). But I wonder what is behind long term futures being down. Are the expecting more supply? Less demand (but we are already in recession and starting to pull out…for instance equities are high). ”
I’ll have an article on this entitled “Insanity in Oil Futures”. There are three possible outcomes, as I see it. The most likely: the futures value is wrong by a significant margin. It’s extrapolations versus forecasts, which I discuss in my article ‘The Tyranny of the Futures Curve”.
“d. Is there some way to settle (to analyze) if OPEC is exerting market power or pumping full out? I would really love to crack that cartel like we did in the 80s…if that is possible.”
There are significant enhanced oil recovery projects in Kuwait and the UAE. I don’t expect miracles there. I don’t think the Saudis will pump much more. Remember, they’re not a profit-maximizer like Shell. They’re a national budget optimizer, and keep in mind the Saudis want to be in the oil business 100 years from now. Why should they run down their reserves if they don’t need the money now for internal budgetary purposes? And Saudi is a mature producer. You can’t just stick a straw in the ground and see the crude gush. They’re now going offshore to heavy, sour and metal-rich crudes–junk, in other words. This suggests onshore production is not such a no-brainer anymore.
Iraq could be doing much better. They currently producing 3 mbpd, they could be producing 10 mbpd. But the politics are fragile. If the US had implemented the FAA (a different topic) there, then Iraq would be on its way to 10 mbpd. As it is, just holding 3 mbpd is beginning to look challenging. Iran similarly could be producing maybe 7-8 mbpd rather than the less than 3 mbpd it is producing now. I leave it to you to call the end of the embargo and the normalization of relations with that country. That’s about it, really, for the Persian Gulf.
Venezuela could be producing comfortably twice or three times as much as today, but it would take some a decade or more to ramp up. Nigeria could produce a lot more. I have my doubts about Angola, offshore seems to be moving in the wrong direction there. Libya obviously could be doing much better.
If you applied US governance to OPEC (and made them profit maximizers), then OPEC could in theory be pumping, say, 15-20 mbpd more. That’s a lot. But it’s not going to happen, of course. Expect Saudi, Kuwait, UAE, Angola, Iran flat. Let’s be a bit optimistic on Iraq. I’d hold Nigeria, although the politics are dreadful there just now (another FAA case). I’m long on Venezuela. I think Maduro’s days are numbered. I think in the better case, you could see production rising by 1 mbpd / year in OPEC. But that’s the better case. I could as easily make the case that the Syrian war gets out of hand and the region largely collapses.
“e. What do you make of the crude drop to 40 back in 2008? It should drop in a recession, but the drop should be limited, because the expectation is for future prices to be high, implies storing oil for later. Was it a weakening of OPEC? Speculation binge? Or expectation of even worse and more prolonged recession than we had?”
Demand collapsed during the recession for a period. But the marginal cost of production was already around $70 then, and prices bounced back pretty quickly. Note that Chevron’s CEO just stated the marginal cost of production for that company around $100 / barrel. That a near 50% rise is five years.
“f. Does it really matter that the majors decline by selling off assets? Non-OPEC share of oil production has increased. US minors have added ~3 million bpd. Is it just dinosaurs being replaced by mammals? Maybe they were too fat and bloated and political anyway? Similarly CAPEX declining of majors does not reflect CAPEX of EOG/CLR increasing.’
The oil majors provide 14 mbpd, about 16%, of global oil production. The oil majors embody access to deepwater, Arctic and major LNG projects. If the majors go down, by implication, so do those sources of supply. You should not, by the way, assume the majors are stupid or incompetent. They are not. They are somewhat bureaucratized and do have a restrictive mindset, but their analysts and operations teams are often very, very good.
“g. I also wonder about reading too much into a this year change in CAPEX by the majors. Could be a trend. But, it’s the first year. ”
It’s the third year for Hess. It comes down to whether the majors can unwind their capex-in-progress. Chevron thinks it can improve production by a lot, that all it’s investment to date will bear commensurate fruit. Maybe. On the other hand, UBS sees Exxon production falling by 4% this year–that’s a lot. And after some real record years of upstream spend. When Shell said it was no longer providing forward production guidance, that was the critical signal, I think. That’s the white flag. But let’s see what happens.
“h. Yeah, CAPEX has gone up a lot and total production stayed flat (implying that replacing declines has become much more expensive). But the dollar revenue of production has gone up a lot also. So I wonder what percent CAPEX has done. Some peakers think “how can they keep spending”, but won’t price motivate the spending?”
No, that’s exactly the point of supply-constrained forecasting. The dollar value of production, for oil, is at best flat and actually down per barrel in many cases over the last three years. Meanwhile, costs are coming up at a pace as high as 11-13% per year. The majors are being eaten alive. When Statoil’s Bacher says it “is a question of whether we will survive or not in the long-term,” that’s what he’s referring to.
I’m reminded of Stephen King’s book and movie “Thinner,” in which a guy has a curse placed on him. He loses weight every day, and only by consuming vast amounts of food every day is he able to keep the daily weight loss down.
If we have to reduce oil consumption, it all comes down to how fast the economy can adjust. There’s no compelling evidence it can adjust at a pace above 3% indefinitely.
I’m not sure what evidence you need. It’s perfectly clear that PHEVs like the Volt can eliminate 90% of transportation fuel consumption. If HEV/EV/EREV volume were increased by 40% per year, it would take 10 years to double the entire fleet’s fuel efficiency: that’s 7% per year. And, of course, that could be done indefinitely until we reached 5% of current levels.
Heck: we could double the average number of vehicle passengers (from 1.2 to 2.4) with HOV lanes and carpoolings, in a matter of months. That’s an inconvenient extreme, but it still would be more convenient than the extended stagnation you’re forecasting.
If consumption is falling by 1.5% per year, then GDP growth will be capped around 1.5%.
The argument went from “there’s no compelling evidence” to “growth *will* be capped. That really, really doesn’t follow. We haven’t seen dramatic reductions in oil consumption because we haven’t made a very serious effort. Europeans use 18% as much personal transportation fuel as the US per capita: that’s certainly affected by their legacy infrastructure, but mostly that’s due to much more sensible levels of taxation at the pump.
The most likely: the futures value is wrong by a significant margin.
You’re claiming to be able to beat the market. I hope this doesn’t sound impolite, but there’s an obvious question here: why aren’t you rich (or planning to become so)??
Nick –
You’re correct. I’m looking to focus more on trading.
But do I believe the futures market is wrong? Well, consider that two days ago Chevron announced that it was budgeting with $110 Brent–the full carrying capacity value. Does Chevron belief the futures curve?
See my comment above regarding dramatic declines in consumption.
That’s great – I wish you the best of luck.
Let us know how you do!
I think that the progression in year over year annual oil price declines is very interesting. A recent essay I put together:
Recent Global Annual Crude Oil Prices Versus Global Net Exports of Oil and Rising US Crude Oil Production
Recent Global Annual Crude Oil Prices
We have of course seen a cyclical pattern of higher annual highs and higher annual lows in global (Brent) crude oil prices in recent years, but I think that the rates of change between successive annual price lows, or troughs following annual oil price peaks, is very interesting.
Peak to Trough Annual Brent Crude Oil Prices, 1997 to 2013
1997: $19
1998: $13
2000: $29
2001: $24 (1998 to 2001 rate of change: +20%/year)
2008: $97
2009: $62 (2001 to 2009 rate of change: +12%/year)
The 11 year 1998 to 2009 overall rate of change in trough prices was +14%/year. And then we have 2012 to 2013.
2012: $112
2013: $109
The four year 2009 to 2013 rate of change in the trough price would be +14%/year ($62 to $109).
The long term 15 year 1998 to 2013 rate of change in trough prices would also be +14%/year ($13 to $109).
If the (+14%/year rate of change) pattern holds, and we were to see a year over year decline in annual Brent crude oil prices in 2017, it would be down to an annual Brent price of about $190 in 2017.
Following is an an excerpt from a recent OECD study which forecasts potentially much higher oil prices:
“A return to world [economic] growth to slightly below pre-crisis rates would be consistent with an increase in the price of Brent crude to far above the early-2012 levels by 2020. This increase would be mostly driven by higher demand from non-OECD economies – in particular China and India. The expected rise in the oil price is unlikely to be smooth. Sudden changes in the supply or demand of oil can have very large effects on the price in the short run.”
“Based on plausible demand and supply assumptions there is a risk that prices could go up to anywhere between $150 and $270 dollars per barrel in real terms by 2020 depending on the responsiveness of oil demand and supply. These projections account for a negative feedback effect of higher oil prices on economic growth.”
Source: http://www.financialsense.com/contributors/joseph-dancy/oecd-study-forecasts-sharply-higher-global-crude-oil-demand
GNE/CNI* Vs. Annual Brent Crude Oil Prices for 2002 to 2012:
http://i1095.photobucket.com/albums/i475/westexas/Slide1_zps5f00c6e5.jpg
GNE/CNI Decline Extrapolated to 2030:
http://i1095.photobucket.com/albums/i475/westexas/Slide1_zps9ff3e76d.jpg
*Definitions:
GNE = Combined net oil exports from (2005) Top 33 net oil exporters (total petroleum liquids + other liquids production, EIA)
CNI = Chindia’s Net Imports of oil (EIA)
ANE = Available Net Exports = GNE less CNI
ANE, the supply of Global Net Exports of oil available to importers other than China & India, fell from 41 mbpd in 2005 to 35 mbpd in 2012.
Jeffrey –
You can’t use that methodology once you’re at carrying capacity. If we allow that carrying capacity is increasing empirically by 4.5% and theoretically by 7%, then the year end 2020 oil price comes out at $150-175 / barrel, assuming no major change in production trajectories (which is probably untrue). I’d probably opt for the higher end of the range. (2020 futures are currently around $90.)
Right now, the oil-to-gas btu equivalent price ratio is 4:1. With the oil price increasing to $150-175, it’s 5: 1 in 2020. This suggests substitution pressures will build over time. It also suggests you’re going to see a massive swing in IOC strategy in the next 12-24 months.
Did you notice that Chevron’s now using the carrying capacity price for their projections? That’s the first time I’ve seen anyone use it.
Steven,
On balance, I’m probably more inclined to lean toward your point of view, but three interesting points:
First, the OECD report (referenced above), which oddly enough seems to be somewhat at odds with the OECD’s oil agency, the IEA. From the report: “Based on plausible demand and supply assumptions there is a risk that prices could go up to anywhere between $150 and $270 dollars per barrel in real terms by 2020 depending on the responsiveness of oil demand and supply.”
Second, if we are barely able to maintain around 75 mbpd of global crude oil production with high capex expenditures, what happens to crude oil production as capex falls?
And third, and most importantly in my opinion, what I call “Net Export Math.”
EXPORT LAND MODEL (ELM)
Production declines in net oil exporting countries are inevitable, and given an ongoing production decline, unless they cut their domestic consumption at the same rate as, or at a rate faster than, the production decline rate, the resulting net export decline rate will exceed the production decline rate and the net export decline rate will accelerate with time. Furthermore, if the rate of increase in consumption exceeds the rate of increase in production, a net exporter can become a net importer prior to a production peak, e.g., the US and China.
ANE* COROLLARY
A decline in GNE* is inevitable (we have already seen, through 2012, a post-2005 decline in GNE), and given an ongoing production decline in GNE, unless China & India cut their net imports at the same rate as, or at a rate faster than, the GNE decline rate, the resulting ANE decline rate will exceed the GNE decline rate and the ANE decline rate will accelerate with time.
*GNE = Global Net Exports of oil, (2005) Top 33 net oil exporters, total petroleum liquids + other liquids (EIA)
ANE = Available Net Exports = GNE less Chindia’s Net Imports (CNI) = Supply of GNE available to importers other than China & India
2002 to 2012 Rates of Change in GNE & ANE
GNE: -0.6%/year
ANE: -2.2%/year
In other words, the supply of Global Net Exports of oil available to importers other than China & India fell almost four times faster than the the supply of Global Net Exports of oil fell, from 2005 to 2012. ANE, the supply of Global Net Exports of oil available to importers other than China & India, fell from 41 mbpd in 2005 to 35 mbpd in 2012.
GNE = Combined net oil exports from (2005) Top 33 net oil exporters (total petroleum liquids + other liquids production, EIA)
CNI = Chindia’s Net Imports of oil (EIA)
ANE = Available Net Exports = GNE less CNI
Should read:
2005 to 2012 Rates of Change in GNE & ANE
And speaking of Chevron, a news item from this morning: (Note the oil price Chevron is using in their forecasts.)
Chevron has projected $10 billion-worth of asset sales in the next three years with capital expenditure also to drop. ,/b>
The California-based supermajor also sees lower 2017 production than previously expected, albeit basing its new estimate on a significantly higher oil price than previously thought.
In Tuesday’s analyst presentation, Chevron said proceeds from asset divestments from 2014 to 2016 are projected to hit $10 billion.
This compares with $7 billion taken between 2011 and 2013, with just over $2 billion of that coming from the upstream sector.
More than 80% of this $10 billion is set to involve upstream asset sales, as Chevron nears the end of the rationalisation of its downstream portfolio.
The net production outlook for 2017 is now 3.1 million barrels of oil equivalent per day from a previous outlook given in 2013 of 3.3 million boepd. The new 2017 guidance assumes, however, a per-barrel price of $110, as against the guidance in 2013 that assumed a price of $79.
Chevron pointed to project delays as part reason for the drop in expected output, highlighting issues at the Chuandongbei sour gas development in China. Upstream reported in November that production-sharing partner PetroChina urged the US supermajor to put its efforts into completing the project’s first phase before tending to the second phase.
The Chevron-led Tengizchevroil (TCO) venture developing the Tengiz field in western Kazakhstan is also subject to project slippage, it said.
Chevron also said that 2013 represented a “peak” when it comes to capital expenditure, with capex to come down in the next three years. Last year saw more jsut over $40 billion in capex.
Although the company will spend more this year than last year on upstream projects, it will spend nothing on business development and about the same on downstream and chemicals.
The projected total spend for 2015-2016 is about the same as 2014.
Chevron will spend less on liquefied natural gas and US gas plays, but unconventional plays will receive more cash.
Both North America and the Asia-Pacific region will receive 34% of the capex total, with 17% set aside for Africa-Latin America and 15% earmarked for Europe, Eurasia and Middle East.
Base upstream projects will receive 21% of capex, with LNG getting 22% and deep-water 13%. Shale and tight resources will get 11%, other upstream 15%, exploration 7% and downstream and chemicals a combined 8%.
Chief executive John Watson commented: “World energy demand continues to grow and the outlook for the energy business remains excellent.
“Our strategies are sound, and we’re poised to deliver significant production growth through the end of the decade.”
Jay Johnson, senior vice president of upstream, continued: “Our plan for production growth is solid and will be driven by near-term project ramp-ups as well as our larger major capital projects which begin starting up later this year.
“These projects are attractive, and when combined with profitable production growth from our shale and tight resource developments, are expected to add over 800,000 boepd by 2017.
“We also have a deep queue of other growth opportunities which should allow us to continue growing production to the end of the decade.”
Steven Kopits & Jeffery J. Brown,
Any chance you could briefly summarize how we go from supply constraint causing demand to stall, GDP to stall and the comments above discussing oil prices increasing dramatically in the future? Also for the terminally slow, could you provide a brief summary of “carrying capacity” related to the oil discussion? I also continue to wonder if coal usage will increase in China and India, if oil is going to be scarce or expensive.
Mr. Kopits, excellent Columbia presentation and hard copy slides. Thanks
Mr. Brown, thanks for the prescient insights.
AS –
A constrained supply does not cause demand to stall per se. However, if supply is constrained, then obviously observed demand can only grow as much as supply. So if supply is only increasing by 1 mbpd, then demand growth is also limited to 1 mbpd (assuming no inventory draws).
If supply is constrained, then something which would have happened doesn’t happen. For example, US vehicle miles traveled are 16% off trend, even allowing for the recession. Thus, one car in six is missing from the road. This in turn presumably affects GDP. Whether it does so is a function of how fast the economy can adjust, which I refer to as ‘efficiency gain’. If consumption has to fall by 1.5% per year and efficiency gains were, say, 6% per year, then GDP growth could be as much as 4.5% per year. In other words, oil would not be a binding constraint on GDP growth. However, if efficiency gains are limited to 3%, and oil consumption falls at 1.5% per annum, then growth would be limited to 1.5%. In other words, we’d expect to see unaccustomed poor growth and chronic over-forecasting by the various agencies, which is in fact what we have seen in recent years. So, in a demand-constrained (traditional demand driven) model, which assumes as much oil as needed can be produced at a reasonable price, the residual, the element which balances the equation is the call on OPEC. That is, if there’s not enough oil, OPEC produces more. If prices are too low, OPEC produces less. The call on OPEC balances the system. This is what, say, BP or the IEA uses.
In a supply-constrained model, all the oil producers are willing or able to supply is sold, with incremental demand left over for more. Thus, the price rises until someone yields their consumption. In practice, this has meant that the advanced economies are ceding their oil consumption to the emerging economies. In this case, if you had more oil, it would quickly be absorbed, such that GDP would grow faster. So, if oil consumption didn’t have to fall–let’s assume it’s flat–and efficiency gains are 3% per annum, then US GDP growth could be 3% per annum. In a supply constrained model, the residual is GDP growth. If there’s more oil, GDP grows faster. If there’s less oil, GDP grows slower.
That’s the basics of supply versus demand constrained analysis.
Ken Deffeyes correctly predicted Peak Oil virtually to the month. I am predicting the point of no return for the so-called Seneca cliff for global net liquid petroleum potential and effective exergy per capita to occur in Q1-Q4 2016 (the world following the trajectory per capita of the US from the mid- to late 1970s and after the mid-1980s). Global oil-based industrialization is over.
The trend of log-linear change rate of inexorable decline per capita implies that the first order collapse threshold will be encountered by no later than Q2-Q3 2015, which will likely coincide with global recession and an equity market crash.
Therefore, between Q2-Q3 2015 and Q4 2016, the world debt- and oil-based economy will have fallen permanently off the Seneca cliff and onto the downslope back to Olduvai, i.e., a once-in-history decline to a post-Oil Age epoch, returning the bottom 90% of the population to real material consumption per capita of the 1930s-50s, and the late 19th century or early 20th century for the bottom 50%.
The probability of regional and global war and the last-man-standing competition for the remaining resources of our finite planet will dramatically increase later this year and into 2015-16, lasting indefinitely into the next decade and through mass die-off into mid-century or after.
Resource wars between the West and China and the rest are inescapable in the Pacific, ME, Central Asia, and Africa, a theme that will define the 21st century.
Prepare accordingly, assuming one realistically can, which, of course, most of us in the bottom 99% cannot.
Ken Deffeyes correctly predicted Peak Oil virtually to the month.
Deffeyes was quite incorrect. He started forecasting the peak on a date that was several years before 2005, and kept moving it up to 2005 as previous predictions proved wrong. And then he settled on 2005 prematurely: peak oil still hasn’t happened.
Global oil-based industrialization is over.
Perhaps. That doesn’t mean industrialization is over, it just means that oil’s dominance is ending. That’s a good thing.
Resource wars between the West and China and the rest are inescapable
Only if world leaders are deeply stupid (or controlled by incredibly narrow-minded and short-sighted oligarchs, like the Kochs). Of course, we can’t rule that out…
AS,
I’m just an amateur supply side analyst, with a focus on Global Net Exports of oil (GNE, as defined below) and Available Net Exports of oil (ANE). The real pro, especially in regard to demand side analysis, is Steven.
In any case, what has happened from 2002 to 2012 in regard to GNE & ANE is clear, but the $64 Trillion question is what happens from 2012 to 2022, and beyond. As noted above, the respective 2005 to 2012 rates of change for GNE and ANE were -0.6%/year and -2.2%/year. The volume of ANE, which is the volume of Global Net Exports of oil available to importers other than China & India, fell from 41 mbpd in 2005 to 35 mbpd in 2012.
As noted above, given an ongoing decline in GNE, unless China & India cut their net imports at the same rate as, or at a rate faster than, the GNE decline rate, it is a mathematical certainty that the resulting ANE decline rate will exceed the GNE decline rate and the ANE decline rate will accelerate with time.
Annual Brent Crude Oil Prices Vs. Normalized Consumption for China, India, (2005) Top 33 Net Oil Exporters and the US:
http://i1095.photobucket.com/albums/i475/westexas/Slide14_zpsb2fe0f1a.jpg
Annual Brent Crude Oil Prices Vs. GNE/CNI Ratio
http://i1095.photobucket.com/albums/i475/westexas/ECI%20Paper%20Slides/Slide19_zpsde2dd95e.jpg
GNE/CNI Ratio* (with 2005 to 2012 decline rate extrapolated to 2030):
http://i1095.photobucket.com/albums/i475/westexas/ECI%20Paper%20Slides/Slide21_zps695d84ae.jpg
ANE Gap Chart:
http://i1095.photobucket.com/albums/i475/westexas/Slide04_zpsd68833b7.jpg
*At a GNE/CNI Ratio of 1.0, the supply of Global Net Exports of oil available to importers other than China & India would theoretically be zero.
Definitions:
GNE = Combined net oil exports from (2005) Top 33 net oil exporters (total petroleum liquids + other liquids production, EIA)
CNI = Chindia’s Net Imports of oil (EIA)
ANE = Available Net Exports = GNE less CNI = Supply of GNE available to importers other than China & India
Small correction, two links above only show data through 2011. Links to Brent vs. GNE/CNI and GNE/CNI (Extrapolated) are respectively shown below (with data through 2012):
http://i1095.photobucket.com/albums/i475/westexas/Slide1_zps5f00c6e5.jpg
http://i1095.photobucket.com/albums/i475/westexas/Slide1_zps9ff3e76d.jpg
Carrying Capacity
The notion of carrying capacity is central to supply-constrained forecasting.
During late 2007 and into 2008, a number of pundits, including Goldman Sach’s Arjun Murti and the late Matt Simmons, speculated that oil could go to $200, or even $500, per barrel. I had my doubts. Ordinarily, there are natural limits on these sorts of numbers, given primarily by our propensity to try to equalize marginal rates of substitution (a very important forecasting concept). We wouldn’t spend 100% of our income on oil regardless of the price. Nor would we spend 50%. Nor 25%. In fact, if you check the historical record for the US, when oil consumption of GDP has exceeded 4.25% of GDP, the consumer has chosen to reduce consumption rather than sustain spending at that level. This was true after the first modern oil shock (1975), the second oil shock (1979), the fourth oil shock (2008) and the fifth oil shock (2011). (The third modern oil shock, the 1991 Gulf War, really didn’t qualify on a number of fronts.)
If we know the budget constraint (P*V, specifically 4.25% in terms of GDP), and we know the volumes, which are relatively stable, then we can calculate the maximum price which the economy can sustain over an extended period of time. For the US, it’s estimated in the $105-108 / barrel Brent basis range.
The notion of carrying capacity and the monopoly price are pretty close. In essence, if a commodity is supply short, then the price rises until it approaches the monopoly price, that is, where any movement from this price leads up or down leads to lower profits. From this point, the price can only increase with increasing GDP (more income allows you to pay more for a commodity); efficiency gains (if you use less of it, you can pay more per unit); and dollar inflation (the value remains the same in real terms). In theory, carrying capacity could grow around 7% (2.5% GDP growth + 2.5% efficiency gain + 2% inflation). In practice, carrying capacity appears to have grown more slowly, around 4.5%.
Thus, at the carrying capacity level, P does not equal MC. That is, if your costs go up, prices will not follow you. So, imagine that the cost of ingredients go up at Papa Johns, and it now costs $11 to make a Pizza. You’d expect Papa John to raise the price to $11 and pass the cost increase on to the consumer. However, at the carrying capacity price, any movement from the previous price, let’s say it’s $10, reduces revenues. Thus, if Papa John wants to raise price by 5%, volumes will fall by more than 5%. So Papa John is essentially stuck with the price. Thus, if costs are rising, Papa John will have to absorb them.
Now, if that cost increase is small and one-time, then that may not be the end of the world. However, if costs are rising by 11-13% each year and the total profits are 10-15% of revenues, then you can see that Papa Johns will be loss making within a short time. And that in turn means the supply of Papa John’s pizza must fall, and it could fall a lot. And if Papa John has to invest a lot to stay in business, you can see that the investment stream is going to dry up.
This is exactly what is happening to the oil majors.
Thus, the concept of carrying capacity is very important, because it establishes limits on oil prices and price rises over time. It tells us that oil prices are not going to rise that fast from hereon out. They will not rise to cover costs; instead oil companies are going to be pushed off their projects. Capex is going to fall; hence the expression “capex compression”, which is exactly what we’re seeing now. With falling capex, we can also infer that production will also fall. Indeed, we can calculate exactly how much production will fall.
That’s where we are in oil markets theory today.
Don’t feel bad if you don’t understand this. BP, Exxon, Chevron, EIA, IEA, Barclays, Goldman Sachs–not one of them understands the concept of carrying capacity or how to calculate it. And they’re professionals.
if you check the historical record for the US, when oil consumption of GDP has exceeded 4.25% of GDP, the consumer has chosen to reduce consumption rather than sustain spending at that level.
The flaw in this sentence is the word “sustain”. If the price of oil rises, and makes a hybrid vehicle make sense, the consumer has chosen an equally good or arguably better substitute, while instantly reducing consumption as much as 50%. This is not the same as “not being able to sustain consumption”.
Thus, the phrase “the maximum price which the economy can sustain” is misleading, as it suggests that the economy is suffering because of stagnant oil consumption.
Have you read anything I’ve written? Did you watch the presentation?
Yes, and we agree that supply is constrained, and that demand is limited. But, we appear to disagree on the primarly limits to demand. I argue that demand is limited by the availability of alternatives, not by the impact of oil shocks on GDP growth. Further, I argue that oil consumption can be reduced much faster than you see, and that reduction would be beneficial all in all, not harmful.
For instance, it’s very clear that personal transportation modes (or the lack thereof) in the US are not driven by a need to economize. The average new car sells for 2.5x more than the lowest vehicle price, and the distribution of sale prices shows diminishing demand at the low end of prices – in other words, Nissan sells 2.5x as many Elantras as Sentras, Toyota sells more Camry’s than Corollas, and about 10x as many Camry’s as Yarises, etc, etc. Yearly depreciation of vehicles is far higher than is accounted for by increasing repair costs. It’s very clear that consumers are not being driven by necessity or deprivation in their vehicle and transportation choices.
On the other hand, no one wants to pay more than necessary, however much money they have (unless we’re talking luxury goods, of course…). So, people resist paying more than a certain amount for oil, and they start switching to better and cheaper alternatives.
I agree that the high cost of oil is harming importing countries. They’re transferring large amounts of wealth and income to oil exporters. There is a straightforward solution: on the national level, implement polices that accelerate the transition and reduce oil consumption by at least -5% per year, and individually to buy vehicles that use much less (and cost less, overall for the same performance).
http://www.feasta.org/wp-content/uploads/2012/06/Trade-Off1.pdf
Steven, BC & Jeffrey,
Thanks for the tutoring. Much appreciated! Still seems like coal may see increased demand if petroleum is in short supply or priced too dearly.
Steve,
1. I read something from DEC saying that total E&P spend was going to be up 6% this year. So, it does appear that other sectors (e.g. NOCs) are investing even while IOCs are harvesting.
2. Maybe the majors are worried about a price collapse and pulling back. (I don’t really think so, but just wanted to joke around about it.)
3. At least for US onshore, it does seem that some of the majors feel that their structure does not work well for shale mining. Exxon kept XTO separate and BP is running a separate division now.
4. I almost like your explanation of carrying capacity. But I think you can (and it would be better to) explain it with crossed lines on a P-V chart. Just like Hamilton teaches the undergrads in freshman econ. There’s a lot of insights from those pictures…have seen them used well in chemical industry and metals. Don’t only do supply or only do demand. Do both. and don’t confuse demand or supply response to price (movement along the line) with movement of the whole line itself.
Leaving aside the discussion of monopoly maximizing price (since you assume that cartel is not functioning), I think we can explain what you did, just fine as a change in the cost (supply) curve. Like here:
http://www.sec.gov/Archives/edgar/containers/fix031/811809/000119312511077138/g168085g56i56.jpg
If there’s “less oil” (e.g. from depletion), then some of the boxes on the left are getting skinnier. If there’s higher costs, then boxes are getting taller. And of course, the tallness or wideness of each box is going to be varying differently. (E.g. if train travel for shale oil gets expensiver, or if a pipeline gets built and it gets cheaper…that is just Bakken affecting. It affects that rectangle, but not the Saudi rectangle.
Your whole comments about carrying capacity and the like are wrong. If we lose supply and underlying demand (the curve) remains the same, then price will rise and volume will drop. So YES WE CAN go higher than 108. If the price gets higher, poor people will take the bus more. Sectors that can change to other fuels will do so (heating oil first, trucks next, cars next, planes last).
5. I would not underestimate the effect of fundamental demand changes (the curve itself, not sliding along it). ME consumption of oil, China, and the like. Jeff confuses it up with a bunch of Aggie algebra, but he’s right that demand makes a difference (he’s just wrong to think that supply and demand from a given country are not separable for analysis).
6. I basically applaud you for analyzing the majors. We can definitely learn from attempting to generalize. So, it’s good. Just a small uncertainty caveat: sometimes companies go in herds. Russia and the stans. Beyond Petroleum green foofoo stuff. Then jumping into shale (late). Now cost cutting. They might be being rational. But they also might be doing whatever’s the latest corporate fad. What Goldman and McKinsey are feeding them at the moment. Big companies can be like that. “You won’t get fired for buying IBM.” There’s a reason why a lot of innovation comes from small companies…
(Pre-empting expected caveat from Steve):
I’m sure to hear an argument about macro effects and demand destruction and the like. But realize, that if you argue that price can not rise above 108, you are saying that demand is perfectly elastic (at least on the downside). I can’t buy that. There will be some sectors that have different willingness to pay based on ability to substitute, percent of income, etc.
And we can get ourselves all tangled up with time dimension of substitution, but no matter. At the end of the day…those crossed lines…that X that we learned in freshman micro class is powerful. I think Saint Milton would back me up, even if I am just an Internet yipyap arguing with a top notch saltwater econ professor and a rich New York analyst with 30 years of industry experience. 😉
Good points. But, when you say ” If we lose supply and underlying demand (the curve) remains the same, then price will rise and volume will drop. So YES WE CAN go higher than 108. ” I would argue that the demand curve isn’t the familiar straight line: above around $60 consumers start paying attention, and above roughly $100 they start working on substitutions. Roughly around $125-150 they change into urgent mode, and implement short term measures like slowing down their container ships and carpooling.
In fact, if oil prices were to stay well above $150 for a prolonged period, that would overwhelm the barriers to entry have slowed down alternatives, and they would expand quickly and achieve economies of scale. At that point substitutes would be clearly cheaper than oil even if prices fell back below $100, and oil would be in serious trouble.
This process of discontinuous and non-linear change is taking place around us now, just slowly enough that we’re not thinking about it a lot (helped by a generally pro-oil media). For instance, at some point BMW and Mercedes will realize they’re in serious trouble competing with Tesla, and become serious about EVs.
I’m well aware that neither demand, nor supply is a “familiar straight line”. That’s an extreme abstraction (but still better than views like Kopits or EIA that don’t even draw P-Q diagrams!). Elasticity is a tangent to a curve. The linear slope at a point.
And for that matter, I posted a cost curve (just follow the link…sigh). Those “rectangles” are how we approximate the curving curve. In addition to showing the non-linear…ness, they are powerful in that you separate segments of demand (or supply).
Sigh.
Well, I like your cost curve. But I’m not sure that captures the non-linearity that I’m talking about. I’m talking about costs that rise to a certain volume, and then start to fall again as economies of scale, and manufacturing experience cost reductions kick in. The PV market is an obvious comparison, as are consumer electronics. The Tesla is a very close-to-home example.
Metric question for Steve/Jim:
How volumetrically significant are the net exports of refined petroleum? IOW, let’s say we consume 18 MM bpd oil and produce 10. So net import of 8. But if we import 1 bpd of gasoline or diesel and export 2 bpd…that would be net export of 1 bpd. So maybe we’re even a little less dependent on oil than we think?
I don’t know the current scale and if it moves the needle, but something to watch for. In particular with the damned splitters getting built. At least we all agree that is silly anti free trade waste to be putting that steel in the ground!
CNE (Cumulative Net Exports) Depletion Marches On, the question is, at what rate?
Following is my graph of the Six Country Case History*, showing the normalized production, net exports, ECI Ratio (ratio of production to consumption) and remaining post-1995 Cumulative Net Exports (CNE) by year (1995 values = 100%):
http://i1095.photobucket.com/albums/i475/westexas/Slide2_zps55d9efa7.jpg
Note that based on the seven year 1995 to 2002 rate of decline in their ECI ratio, estimated post-1995 Six Country CNE were 9.0 GB (billion barrels). Actual post-1995 Six Country CNE turned out to be 7.3 Gb.
*Combined production and consumption values for the major net oil exporters, excluding China, that hit or approached zero net oil exports from 1980 to 2010.
I’ve got someone working on a similar graph for Saudi Arabia, but following are the normalized values, with 2005 values = 100%. Estimated post-2005 CNE, based on the seven year 2005 to 2012 rate of decline in their ECI Ratio are about 56 Gb (total petroleum liquids + other liquids, EIA).
Normalized Saudi Values (2005 = 100%)
Production
2005 100% (2005 value 11.1 mbpd)
2006 96
2007 92
2008 97
2009 88
2010 95
2011 101
2012 104%
Annual Net Exports (2005 value 9.1 mbpd)
2005 100%
2006 95
2007 89
2008 96
2009 83
2010 89
2011 91
2012 95%
ECI Ratio (Ratio of Production to Consumption, 2005 value 5.7 )
2005 100%
2006 93
2007 85
2008 96
2009 79
2010 78
2011 70
2012 71%
Estimated Remaining Post-2005 CNE by Year**
2005 100%
2006 94
2007 89
2008 83
2009 78
2010 74
2011 69
2012 63%
**By definition, remaining post-2005 CNE are declining, the question is, at what rate?
The clearest example I have yet found of the stark difference between production and CNE (Cumulative Net Exports) depletion is the Six Country Case History. As their production increased by 2% from 1995 to 1999 (all is well!), their remaining post-1995 CNE fell by 54% (all is not so well after all).
Normalized Six Country Graph:
http://i1095.photobucket.com/albums/i475/westexas/Slide2_zps55d9efa7.jpg
Nony –
Responses from above.
“1. I read something from DEC saying that total E&P spend was going to be up 6% this year. So, it does appear that other sectors (e.g. NOCs) are investing even while IOCs are harvesting.”
The 6% number I have seen comes from Barclays semi-annual survey. In aggregate that may be right. Some NOCs continue to increase investment, and US onshore continues to do pretty well. So we see an increasingly differentiated environment:
– IOCs, high capex deepwater, Arctic, LNG projects: under pressure, expect reductions
– Onshore, shallow water NOCs in low access markets (Saudi): increased capex
– Closed access markets (Arg, Venez, Mexico, parts of Africa): expected increased capex, increased access
– North America onshore: expect increased capex, albeit with uncertain economics for the producers
“2. Maybe the majors are worried about a price collapse and pulling back. (I don’t really think so, but just wanted to joke around about it.)”
Chevron raised its budgeting value from $79 / barrel last year to $110 this year. That’s all in, baby. Full carrying capacity value. This has the same interpretation as Shell discontinuing production guidance last year.
“3. At least for US onshore, it does seem that some of the majors feel that their structure does not work well for shale mining. Exxon kept XTO separate and BP is running a separate division now.”
Is US shale profitable? Jim has posed that question. So have I. Shell can’t make the Eagle Ford work. Maybe there’s a reason. But yes, the majors are poorly suited to compete in shale plays. Shales call for light infantry; the majors are really heavy artillery. By the way, I had earlier speculated that BP would be sold this year. I think I’ll hold that position for the now. Something’s going to be sold there.
“4. I almost like your explanation of carrying capacity. But I think you can (and it would be better to) explain it with crossed lines on a P-V chart. Just like Hamilton teaches the undergrads in freshman econ. There’s a lot of insights from those pictures…have seen them used well in chemical industry and metals. Don’t only do supply or only do demand. Do both. and don’t confuse demand or supply response to price (movement along the line) with movement of the whole line itself.”
So now I have to provide charts and graphs, too?
“Leaving aside the discussion of monopoly maximizing price (since you assume that cartel is not functioning), I think we can explain what you did, just fine as a change in the cost (supply) curve.”
I don’t disagree with cost curves. I use Goldman Sach’s curve myself. But the true costs appear considerably higher. For example, Chevron pulled the Rosebank project due to costs concerns. Goldman shows that project with a $68 / barrel breakeven. Something’s not right there.
However, is a supply-constrained model, the price will not follow supply up the cost curve. Instead, those high cost projects don’t get done. That’s what’s happening, guy.
“If there’s “less oil” (e.g. from depletion), then some of the boxes on the left are getting skinnier. If there’s higher costs, then boxes are getting taller. And of course, the tallness or wideness of each box is going to be varying differently. (E.g. if train travel for shale oil gets expensiver, or if a pipeline gets built and it gets cheaper…that is just Bakken affecting. It affects that rectangle, but not the Saudi rectangle.”
There’s no lack of oil. There’s a lack of accessible oil that can be developed an acceptable cost.
“Your whole comments about carrying capacity and the like are wrong. If we lose supply and underlying demand (the curve) remains the same, then price will rise and volume will drop. So YES WE CAN go higher than 108. If the price gets higher, poor people will take the bus more. Sectors that can change to other fuels will do so (heating oil first, trucks next, cars next, planes last). ”
Did you not seem my comments about the rate of change of carrying capacity? Among price forecasters, I’m in the top 2/3. The problem is that costs are increasing at twice the pace of carrying capacity gains. And that number is definitional, not a forecast. This is exactly the same process we’ve seen since, say, 2003. If supply is unresponsive, then prices rises, profits rise, and capital is drawn into the industry. However, at some point (and we know that point), we hit global carrying capacity, and large scale (20-25% per annum) price increases are no longer feasible. But costs will continue to rise beneath you, indeed, I have argued that they will rise at an increasing pace. So the process which brought riches to the oil community from 2003-2013 will be its undoing on the way down. There is no free lunch in economics, and the tab is coming due. You might re-read my comments above, by the way.
“5. I would not underestimate the effect of fundamental demand changes (the curve itself, not sliding along it). ME consumption of oil, China, and the like. Jeff confuses it up with a bunch of Aggie algebra, but he’s right that demand makes a difference (he’s just wrong to think that supply and demand from a given country are not separable for analysis).”
The historical record does not support your argument. See my Econbrowser post on China’s oil demand which I made maybe four years ago. Also, I’d point out that the US added 800 kbpd of consumption in about few weeks when gasoline prices fell in October and November.
“6. I basically applaud you for analyzing the majors. We can definitely learn from attempting to generalize. So, it’s good. Just a small uncertainty caveat: sometimes companies go in herds. Russia and the stans. Beyond Petroleum green foofoo stuff. Then jumping into shale (late). Now cost cutting. They might be being rational. But they also might be doing whatever’s the latest corporate fad. What Goldman and McKinsey are feeding them at the moment. Big companies can be like that. “You won’t get fired for buying IBM.” There’s a reason why a lot of innovation comes from small companies…”
Big companies are not imaginative. It runs against bureaucracy. The fad today is divestment. Divestment does not solve cost problems; it solves cash problems. Survival’s going to become a fad pretty soon, if I believe what Statoil’s Bacher says. (See my comment above.)
“I’m sure to hear an argument about macro effects and demand destruction and the like. But realize, that if you argue that price can not rise above 108, you are saying that demand is perfectly elastic (at least on the downside). I can’t buy that. There will be some sectors that have different willingness to pay based on ability to substitute, percent of income, etc.”
Demand has been perfectly price elastic in the last three years. OECD oil consumption has fallen even in the face of modestly declining oil prices. Your traditional Hamilton and Lutz elasticity analyses are completely inapplicable during this period. It’s really time to re-visit the whole issue, but you need a supply-constrained model to explain it all. Jim’s not fully convinced of supply-constrained forecasting, best I can tell. (By the way, Jim, I’m happy to come and present the Columbia / Princeton presentation at Harvard, too.)
Personally, I’m on board with Chevron, and I expect that a price floor around $110 Brent should emerge in reasonably short order. Hasn’t so far, though.
“And we can get ourselves all tangled up with time dimension of substitution, but no matter. At the end of the day…those crossed lines…that X that we learned in freshman micro class is powerful. I think Saint Milton would back me up, even if I am just an Internet yipyap arguing with a top notch saltwater econ professor and a rich New York analyst with 30 years of industry experience.”
I’m with you. We conducted a Capstone workshop with graduate students at Columbia University to examine the potential of CNG as a transportation fuel four years ago. However, if you’re running a demand-constrained model–which all the oil majors do–then you assume that oil will be supplied somehow if the demand’s there and that the futures curve is good. And if you’re wrong, guess what, your oil side is going to suffering big time, and you’ll be four years late making a strategic switch to natural gas as a transportation fuel. Is that where we are today? Seems to be.
For Feb:
US crude oil imports: 7.3 mbpd on consumption of 18.4 mbpd
US net imports (crude imports – product exports): 5.3 mbpd
US product exports: 2.0 mbpd
There’s some refinery gain in converting crude to product, 1.0 mbpd in Feb.
Thanks, Steve. So product export is pretty substantial (moves the needle).
US natgas storage withdrawal of 195 BCF last week, leaving storage at one BCF above the 1,000 BCF mark.
http://ir.eia.gov/ngs/ngs.html
Next winter may be “interesting.”
In regard to next winter, there are lots of variables. Among them are: Actual storage level at end of heating season, summer demand (especially as coal fired power plants continue to be shut down, and as we see some problems with hydroelectric plants out west, due to low water levels), rate of change in production and finally the weather next winter.
However, US dry processed natgas production has been flat at about 66 BCF/day since late 2011, and Canada has shown a multiyear decline in production (down from 18 BCF/day in 2005 to 14 BCF/day 2012). Given the Citi Research estimate (that we lose 24%/year from existing natgas production), we have to put on line about 16 BCF/day of new production every year, just to maintain 66 BCF/day. This requires us to add, every year, the productive equivalent of about twice the 2013 output from the Marcellus, just to maintain current production.
Also I suspect that EIA revisions to the 2013 data will probably show a year over year decline in US natgas production.
So, it will be “interesting,” but there is a real possibility of skyrocketing natgas prices and supply shortfalls next winter.
Re: Deffeyes’ Peak Oil Prediction
Deffeyes never backed away from what his model showed, to-wit, a global crude oil production peak between 2004 and 2008, most likely in 2005. He erroneously observed that we had peaked around 2000, but an erroneous observation is not a prediction.
In regard to the data, one would have to be blind, or in deep denial, not to see the major inflection point in global crude oil production that we saw in 2005:
http://i1095.photobucket.com/albums/i475/westexas/Slide1_zpsddc49796.jpg
In regard to the gap on the foregoing chart, I call it the “Yergin Gap,” because circa 2005 Daniel Yergin* was predicting a continued 3%/year rate of increase in global liquids production, which would have put global crude (actually crude + condensate) production at about 91 mbpd in 2012.
So, in retrospect, who better predicted post-2005 global crude oil production, Deffeyes or Yergin?
*I also suggested that we price oil in terms of “Yergins,” with One Yergin = $38 per barrel, since Yergin, in late 2004, asserted that one year later we would be back down to a long term oil prices of $38 per barrel, because of a steady increase in production (at about 3%/year).
Care to bet?
It’s Not the End Of the Oil Age
By Daniel Yergin
Sunday, July 31, 2005
http://www.washingtonpost.com/wp-dyn/content/article/2005/07/29/AR2005072901672.html
Excerpt:
“There will be a large, unprecedented buildup of oil supply in the next few years. Between 2004 and 2010, capacity to produce oil (not actual production) could grow by 16 million barrels a day — from 85 million barrels per day to 101 million barrels a day — a 20 percent increase. Such growth over the next few years would relieve the current pressure on supply and demand.”
(Note that actual global total liquids production in 2010 was 87 mbpd, EIA).
And circa 2005, Deffeyes, in effect, predicted that global Crude + Condensate production would not exceed 74 mbpd (rounding off to nearest one mbpd). In 2010, we were still at 74 mbpd, although 2012 and 2013 were both close to 76 mbpd.
At 76 mbpd in 2013, the 2005 to 2013 rate of increase in global Crude + Condensate production would be about 0.3%/year. Yergin’s prediction, circa 2005, would have put global Crude + Condensate production in the vicinity of 94 mbpd in 2013.
Incidentally, if we subtract out condensate, which is a byproduct of natural gas production, I suspect that it is likely that we have not seen a material post-2005 increase in actual global crude oil production (45 or less API gravity crude oil).
He erroneously observed that we had peaked around 2000, but an erroneous observation is not a prediction.
I’d have to look back at the language he used, but if so, that’s even worse! At least an incorrect forecast is about something in the future, which has built in uncertainty.
one would have to be blind, or in deep denial, not to see the major inflection point
I agree there’s an inflection, and that we’re now in Peak Oil Lite, where supply is more limited. I also agree that Yergin hasn’t done well. But Deffeyes himself said “that close only counts in horse shoes and hand grenades”. More importantly, Peak Oil Lite is indeed pretty different from Peak Oil.
It’s not helpful to pretend that Peak Oil forecasting has been accurate. His approach has done moderately well with oil, but it’s just not looking much like his forecasts. Look at the US, where the chart now looks nothing like the classic Hubbert Curve. Heck, Hubbert tried his methods on natural gas production, and failed miserably.
Finally, we agree on the most important thing, that the oil age is ending. That’s a good thing.
Ron Patterson, who runs the Peakoilbarrel.com blog, pulled together some annual OPEC 12 production data for me. In regard to Crude + Condensate (C+C) production data, note that condensate production is a byproduct of natural gas production. The OPEC countries track crude only production (not C+C).
If we round off to the nearest one mbpd (assuming that we have two significant figures of semi-accurate data) and use complete annual data (through 2012), OPEC 12 crude only production (data from OPEC itself) was 31 mbpd in 2005 and in 2012 (no increase in seven years), while EIA OPEC 12 C+C production was 32 mbpd in 2005 and 33 mbpd in 2012 (3.1% higher than 2005).
Global C+C was 74 mbpd in 2005 and 76 mbpd in 2012 (2.7% higher than 2005). If we assume that the OPEC 12 countries are a reasonable representative sampling of global production (and of course we have a lot of condensate production in the US, which accounts for all of the recent increase in global C+C production), in my opinion it’s a reasonable inference that we have not seen a material increase in global crude oil production (generally defined as 45 or lower API gravity) since 2005. Of course, we need crude oil to produce distillates.
So, based on the foregoing, in my opinion (an opinion shared my many other people) it’s a reasonable conclusion that virtually 100% of the increase in global liquids production since 2005 has been condensate, NGL’s and biofuels. In other words, in my opinion virtually 100% of the increase in global liquids production since 2005 has been from byproducts of natural gas production and from biofuels.
What are we trying to figure out? If we’re evaluating “Peak” prediction accuracy, it’s clearly not very accurate. When you say “virtually 100% of the increase in global liquids production since 2005” you concede that even by the very *narrowest* definition, oil production hasn’t peaked yet. By a normal, wider definition growth has been significant. US production now looks *nothing* like a Hubbert peak. Hubbert’s forecasts for NG were completely wrong: he forecast NG production falling off a cliff in the 80’s, and it still hasn’t peaked.
On the other hand, we’re clearly in Peak Oil Lite: oil production growth has been well below expectations, we have a seller’s market, and prices are very likely permanently higher.
The important thing: we agree that the age of oil is over. It’s time for something else, something better.
Deffeyes was correct about the legacy supply in 2005, 2007, and remains correct today.
Anyone who works with the data regularly is aware if that.
Deffeyes was correct about the legacy supply
It’s easy to be correct, if you keep moving your forecasts up each year they don’t come true.
More importantly, you may be right that one can make the 2005 forecast accurate by making the definition of “legacy oil” *extremely* narrow, but that’s not rigorous forecasting. And, of course, there’s nothing in his writings about excluding “tight” oil, or even tar sands. If his method didn’t anticipate the effect of higher prices on supply, or the effect of technological change, those are flaws in his method.
Now, I agree that the oil market changed from a “buyer’s market” to a “seller’s market” in 2005. Heck, I agree that the age of oil is ending. Now, we just need to agree that’s a good thing.
It has to be appreciated that Ken Deffeyes made his forecast with the technology that existed in 2005, ie, before the shale oil revolution. Any peak oil supply prediction is necessarily contingent on access, technology and prices. In some sense, the technology optimists have been proved right: technology has increased the crude oil supply by nearly 3 mbpd compared to 2005. (On the other hand, 3 mbpd on a global supply of 90 mbpd over eight years is no great shakes.)
Access also matters. Arguably this is not much better than it was in 2005, and maybe worse. As I’ve stated before, I expect access to improve gradually. Mexico is only one case in point. With unlimited access, global production could be, in theory, 15-20 mbpd higher than it is today. But access on that scale in a compressed time frame will never occur.
On the other hand, Deffeyes assertion about the legacy oil supply is also correct. Without subsequent price increases, the conventional supply today would be about 6 mbpd lower than it is. The legacy system looks better than it ought to because we’ve been running exploration and production on steroids since 2007.
By the way, Yergin’s 2005 forecast uses a classical demand-constrained approach. CERA forecasts 101 mbpd in 2010, because that’s what a GDP-linked (demand-driven) approach would suggest. It’s great sport to think we’re all smarter than Dan Yergin (who’s pretty damn smart, actually), but in fact, had I made the forecast in 2005, it would have been the same as Yergin’s. Until late 2007, I thought guys like Deffeyes were cranks (he is little a cranky, as the Princeton lore goes), and that peak oil was just alarmist blather. I assumed that more oil would be produced if people wanted it.
It was not until I sat down to make my own country-by-country oil supply forecast in early 2008 that I became aware of just how challenging raising oil production could be. (For those who want to weigh in on the topic, this is a great exercise. The BP Statistical Review excel spreadsheet is a great place to start. And Scott Sumner, I mean you.)
I was relatively late to the notion of peak oil, and by the time I started to learn about the topic, the Oil Drum and ASPO were going great guns. Given that the leading consultancies like CERA and the oil companies were saying very little about the oil supply (you’ll recall the EIA was blowing its AEO forecasts every year by a margin–I think I have an Econbrowser post on that), the curious by default were forced to turn to the peak oil folks for insight. And some of it, particularly work by Steve Andrews, Dave Summers (‘Heading Out’) and many others was revealing. But had I made my forecast in 2005, it would have been essentially the same as Yergin’s.
As for Deffeyes, he was quite careful about his analysis, and before one criticizes him, I strongly suggest you read his book “Beyond Oil”. He was not Professor of Geology at Princeton University by accident. He is no lightweight. And as BC points out above, Deffeyes predicted peak oil for the legacy system virtually to the month, as those of us who deal daily with the data are well aware. For those of us committed to quantitative analysis of the oil system without preconceptions of outcomes–to let the data speak–Deffeyes remains unequaled in his vision and understanding of the dynamics of the oil system as it existed in 2005.
I wonder how much of an effect the cartel is having. they definitely took very strong “market power” action in 2008. They are not non existent.
Deffeyes has refused to answer questions about his predictions or to talk to reporters. I don’t like that, Steven. I think you would respond either way. Don’t you think Deffeyes would still be in the public eye if he had been more prescient? There is a trend here. Even James with his 200/bbl predictions back in the day.
I don’t know how good Yergin is as a forecaster/analyst. I realize he works for IHS, which I guess is sort of like SRI used to be for chemicals industry. But I’ve never seen him do any charts or graphs or spreadsheets. He is a very good writer and historian and that is what I would use him for. Not for understanding commodity price dynamics. Supply and demand models, game theory, geology, technology and the like are what you need for that. someone like Yergin might be a good input to that kind of work, but he’s not an analyst like you.
Nony –
I understand Deffeyes was in poor health. He moved from Princeton to California to be with his daughter, if I recall the story correctly.
Nick and I are going to disagree about Deffeyes. True, Deffeyes did not talk about the impact of technological change, nor was the impact of price movements well-understood (and something which I have criticized the peak oil crowd for). Technology optimists like Julian Simon were certainly correct that technology has created additional supply. And vast increases in upstream spend also increased supply. But not much. Shale oil production is up 3 mbpd since 2005. Big deal. And last year the industry spent nearly $700 bn on exploration and production and the oil supply was all of 0.7 mbpd higher in the three months ending Feb. 2014 than a year earlier. That’s awful.
If you deal with the data, time and again you’ll see the inflection point at 2005 and the resulting strains in things like vehicle miles traveled. No one else called it like Deffeyes did.
Steven,
I think we’re in reasonably good agreement. I agree that Deffeyes anticipated, and brought attention to, something important (as long as we don’t go overboard about his prescience).
We’re also in agreement that price signals, and market operations, are important. That’s a core part of economics that Peak Oil enthusiasts tend to neglect. Price signals are a big part of what is bringing an end to the Age of Oil. The key thing to remember: price brings additional supply, but that supply doesn’t have to look identical to the old supply.
Ken Deffeyes made his forecast with the technology that existed in 2005, ie, before the shale oil revolution.
Are you sure? I read claims by industry veterans that horizontal drilling, and fracking, both have existed for many decades. They write that innovators in N. Dakota certainly surprised people, but they simply extended old techniques, in formations that had been known for decades.
Their argument is that what really changed was pricing: it became feasible to spend a lot more money on completion of wells.
Any peak oil supply prediction is necessarily contingent on access, technology and prices.
There’s no hint of that in Deffeyes forecasting. None.
That’s a huge change: a recognition that a change in world pricing would affect everything was absolutely not recognized by any Peak Oil enthusiasts, including Hubbert or Deffeyes. Hubbert said often that he was really using simple rules of thumb (heuristics) that he developed in much smaller oil fields in the US. Deffeyes shows no such humility.
Deffeyes assertion about the legacy oil supply is also correct.
That’s hindsight. Deffeyes makes no such rule about “legacy” vs “unconventional” in his original writings.
It’s great sport to think we’re all smarter than Dan Yergin (who’s pretty damn smart, actually), but in fact, had I made the forecast in 2005, it would have been the same as Yergin’s.
Forecasting is very, very hard. On the other hand, if one is going to make a big deal about one’s predictions publically, as both Deffeyes and Yergin have, then you’ll have to live with that.
More importantly, it’s useful to set the historical record straight on Peak Oil forecasting: it has not done well. Hubbert’s predictions on both the US and the world are being falsified as we speak. His forecast for US NG was dramatically wrong.
And, now, Deffeyes is also being proved wrong, year by year.
Deffeyes, he was quite careful about his analysis
No, he really wasn’t. He extrapolated using something he called Hubbert Linearization which Robert Rapier has shown to be unreliable. Worse, he greatly exaggerated the meaning of his forecast, saying it would be the death of industrial civilization.
Deffeyes predicted peak oil for the legacy system virtually to the month
Again, not really. He issued several forecasts as earlier ones were disproved, and his latest is badly false unless one applies tortuous hindsight.
Now, I agree that he was onto something useful. But, he really wasn’t prescient, or rigorous.
Why is this important? Well, besides the value of simple truth, we should clarify that Deffeyes is doing amateur economics, and doing it badly. His analysis of the meaning of Peak Oil was unrealistic, and it’s valuable to show that he’s not a reliable authority – he has no understanding of the complex dance of optimization and allocation that happens in a decentralized free market.
I think Rock overstates the “geology was known, technology was known”. Various aspects were known. Sure. But still, no one was significantly exploiting horizontal drilling in shale for natural gas (in significant amounts) until this millennium. yeah, George Mitchell was working on it in the 80s in the Barnett. but it still took a while to really get it down (e.g. slickwater fracks). And also, we got into the Marcellus rather late for it to be so known. If the point is that elements of things were known…absolutely. But the techniques were not really optimized back “in the Austin Chalk” (which was not primarly exploited by horizontal multistage fracks).
And Rock will say everything was waiting for a price signal. You could buy that for oil…but it doesn’t hold true for gas, where shale drilling is actually displacing conventional gas drilling. And prices are low. So something was different! Something was learned…
Also, some of these various excuses don’t hold together. I remember Gail/Piccollo predicting 200 k bpd and Rune predicting 650 (neither doing a post mortem to explain why they were off and off low). Obviously things are not so “known” or not known in the direction the pessimists know them. And these are all people who expected price to stay high, but just thought the oil would run out faster than it did.
The distinction between actual crude oil production versus crude oil production + (condensate + NGL’s + biofuels) is not trivial.
First, the price of oil is quoted in terms of actual crude oil, not propane or biofuels. It’s as if you ask a butcher what beef costs and they give you the price of tenderloin steak, but if you ask how much beef they have on hand, they give you total pounds of steak, roast and ground beef.
Second, we need crude oil to produce petroleum based distillates.
Third, the virtual certainty that we have not seen a material increase in the actual global production of crude oil production despite a doubling in global crude oil prices since 2005–exactly in the time frame predicted by Deffeyes–is a huge warning sign.
Substitution in response to a price rise is always a factor, but the question is whether the increase in liquids from natural gas sources + biofuels is making a material difference, or just an incremental difference, given that Deffeyes was exactly right about the inflection point in actual global crude oil production–especially in the context of the post-2005 decline in Global Net Exports of oil (calculated in terms of total petroleum liquids + other liquids).
In regard to Hubbert Linearization (HL):
As we have discussed, Deffeyes, using HL, predicted a global Crude + Condensate peak between 2004 and 2008, most likely in 2005. Based on OPEC data, it would appear that he was right about the oil reservoir component, but not the gas sourced (condensate) component, although the C+C average production rate for 2006 to 2012 was the same as 2005 (74 mbpd).
In any case, at a minimum, HL was useful in accurately picking a major inflection point in global crude oil production:
http://i1095.photobucket.com/albums/i475/westexas/Slide1_zpsddc49796.jpg
And using HL, following is what I said about global net exports in January, 2006:
Saudi production was below their 2005 production rate for five years (2006 to 2010 inclusive), before showing an uptick in 2011 to 2013 (and average Saudi production through 2013 remains below their 2005 rate), and Russian production continued to slowly increase after 2007.
However, Saudi net exports have been below their 2005 rate for seven, and probably eight straight years, and Russian net exports have been at or below their 2007 rate since 2007.
Here is the Global Net Exports (GNE) “Gap Chart” for 2002 to 2012:
http://i1095.photobucket.com/albums/i475/westexas/Slide1_zps3161a25b.jpg
As shown on the graph, GNE was increasing at 5.4%/year from 2002 to 2005, versus a 0.6%/year rate of decline from 2005 to 2012.
As these two examples demonstrate, HL, at a minimum, was very useful in picking major inflection points in production and net exports, in a time frame when the conventional wisdom as expressed by Yergin, et al, was that we would continue to see an indefinite rate of increase of 3%/year or so in global crude oil production.
Nony,
We agree things weren’t as simple as Rocky suggested: I used to ask him if things were that simple, why no one predicted it beforehand? He never answered that.
Still, I think we also agree that it’s reasonably clear that price is what made the primary difference for oil.
Jeffrey,
We agree that Deffeyes brought attention to an important inflection point (though not really in the correct time). And we agree that oil importers should not rely on the same volumes of imports.
The age of oil is ending. And, that’s a good thing.
yep and lets never talk about what we are going to do when we run out of fossil fuels
that is just soooooo 70’s