The Bureau of Economic Analysis announced today that U.S. real GDP only grew at a 0.1% annual rate in the first quarter. Some of the reasons for an economic stall appear to be temporary, but it’s a very disappointing start to the year nonetheless.
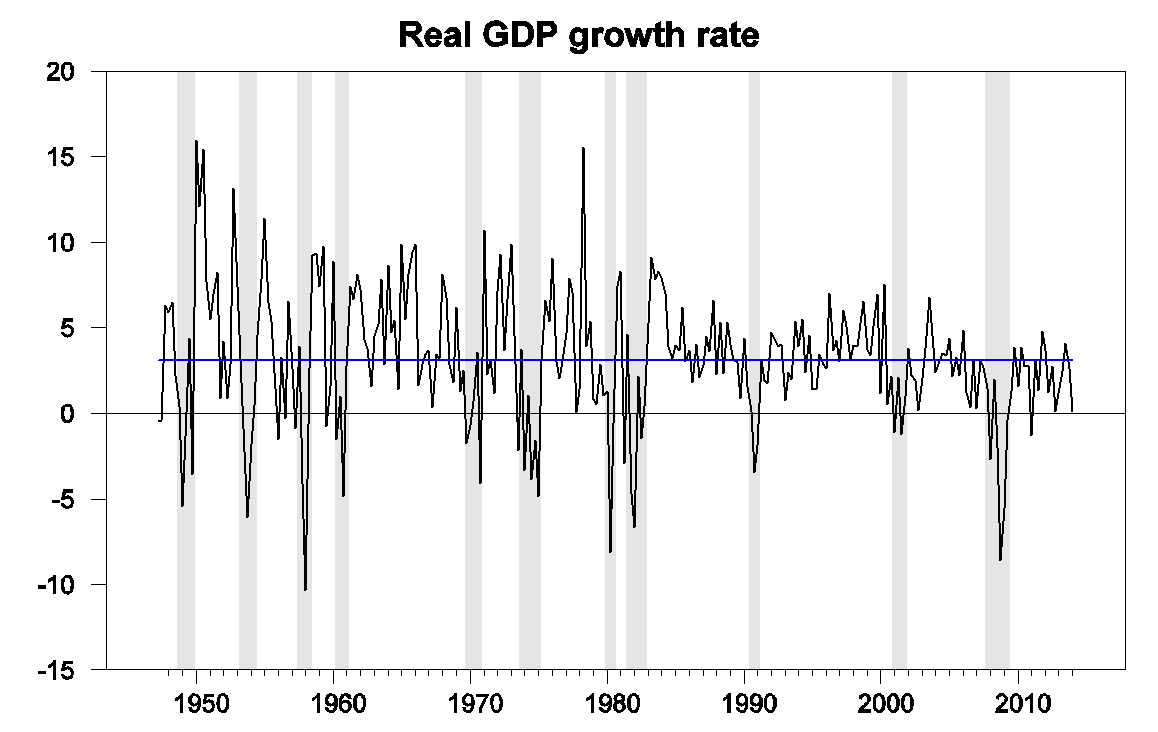
U.S. real GDP growth at an annual rate, 1947:Q2-2014:Q1. Blue horizontal line is drawn at the historical average (3.1%).
Part of the problem was doubtless an unusually cold winter in much of the U.S. Inventory drawdowns also subtracted 0.57 percentage points from that annual growth rate, meaning that real final sales grew at about a 0.7% annual rate during the first quarter– not great, but nonetheless a sign of some positive underlying growth. Both business fixed investment and new home construction fell in the quarter, which would be ominous developments if they’re repeated through the rest of this year. And a big drop in exports reminds us that America is not immune to weakness elsewhere in the world.
Even the 2% growth in consumption spending is not all that encouraging. As Bricklin Dwyer of BNP Paribas noted, 1.1% of that consumption growth– more than half– was attributed to higher household expenditures on health care.
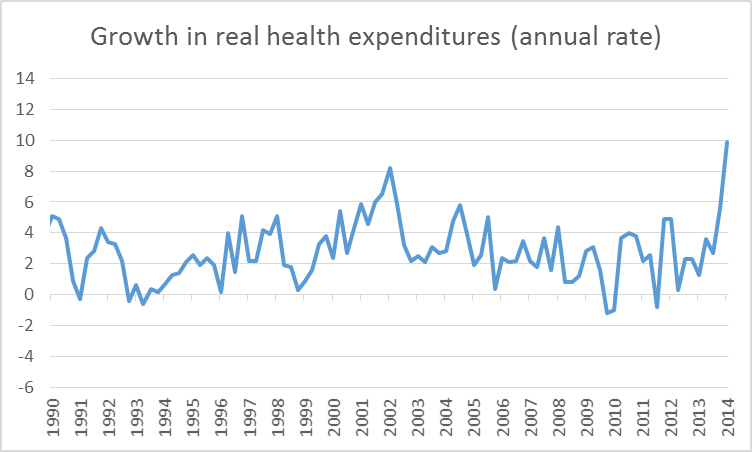
Growth in real personal consumption expenditures on health care at an annual rate, 1990:Q1-2014:Q1. Data source: BEA Table 1.5.1.
The economic stall was enough to produce a modest increase in our Econbrowser Recession Indicator Index up to 9.9%. Note that in calculating this index we allow one quarter for data revision and trend recognition. Thus the latest value, although it uses the disappointing GDP numbers released today, is actually an assessment of the state of the economy as of the end of 2013. However, our index is never revised, so that the numbers plotted in the graph below since 2005 are exactly the values as they were reported one quarter after each indicated historical date on Econbrowser.

GDP-based recession indicator index. The plotted value for each date is based solely on information as it would have been publicly available and reported as of one quarter after the indicated date, with 2013:Q4 the last date shown on the graph. Shaded regions represent the NBER’s dates for recessions, which dates were not used in any way in constructing the index, and which were sometimes not reported until two years after the date.
I am still expecting numbers for the rest of the year to come in much better. But there’s no getting around the fact that 2014 got off to a pretty weak start.
The BEA release link is to 4Q13 instead of 1Q14.
Thanks, fixed now.
sorry, but the government sucks at gdp. they consistantly miss investment spending and it shows on every damn expansion. the only time they overestimate is during the contraction phase. They frankly missed the 90’s tech boom because of this problem.
this report hardly shows a ‘stall’. the economy likely grew at 5% the 2nd half of 2013, weather related disturbances will be added back in the 2nd quarter and yes, years down the road investment growth will be positive.
Exactly, and then follow that evidence through to the secular stagnation thesis, and it just seems very unlikely. 2014-2016 will be boom years. The USA is looking very strong in the next decade, as many major problems have been fixed. And, the population is growing (a major component of the sec-stag thesis is that the population delines), so secular stagnation is just implausible.
XO, what major problems have been fixed? Are there any remaining that haven’t been fixed?
Well, I said fixed, but I meant strongly improved. But here’s my list:
1. Dodd Frank–Banking is more regulated, Finance is more controlled, so less systemic risks.
2. Banking is (more) boring–We will not see exotic loans, liar loans, balloon payments and all that other crazy sub-prime stuff any time soon..
3. ACA–Eventually the cost saving mechanisms will start, and all the experimental stuff will show new ways to save. So, lots of waste gone. General improvement in health leads to a more productive workforce.
4. More educated workforce–millions have gone back to school, or stayed in school longer due to the recession, so we will have a more productive workforce.
5. Iraq and Afghanistan wars–Afghanistan was a just war, Iraq was not. But in both, trillions were wasted. Now over.
6. War on drugs and the incarceration fad is ending—This was a terrible waste, and at least the intellectual battle has been won among elites. Hopefully, policy will change soon also.
7. Crime–Just keeps going down, which adds efficiency.
8. Teenage pregnancy–down, down, down, which adds efficiency.
9. Immigration–compared to our competitor nations, such as Japan and South Korea,, we still attract more of the best and the brightest, and they keep coming and helping improve our economy.
10. Population increasing–Related to above, but Europe and East Asia have aging issues far greater than we do. See the Calculated Risk post on the shockingly positive distribution ratio of workers to elderly, much better than you might think. Generally, see his “Got to wear shades” post for more on all these ideas.
11. Pollution–Under-told story about how pollution has been going down, which will lead to health improvements and more worker productivity.
12. Solar Power–Gigantic potential here, and the costs just keeps falling. Only upsides from solar.
13, Fracking etc.–NG still adding wealth to the USA.
14. Electric Vehicles–Past the tipping point soon, and USA is among leaders of this. Needs more help, but still potentially great for USA.
I could go on. USA is looking great. So sec-stag thesis is just not making sense to me.
13 is correct but scratch all the rest.
Since January, the FED has reduced its asset buying $10 Billion/month while the Federal Government has reduced its expenditures by about $8 Billion/month. Capital gains taxes have been raised… Its not surprising that GDP growth is negligible when the vibrator speed is being reduced.
Without increased liquidity or debt reduction to free-up cash flow, there’s no way for GDP to grow. Stagnation will be our bill-of-fare for many moons to come. That’s the plan… Financial Repression and Bank Deleveraging.
Real non-residential investment to the aggregate of private employment and wages implies that we reached the cyclical constraint for investment and employment in Q3-Q4 2013, which historically is the precursor condition to stall speed ahead of recession.
Moreover, real wages after debt service and health care spending are unambiguously recessionary for US income.
Therefor, the US quite likely entered recession in Q4 2013 and Q1 2014, weather effects notwithstanding.
Investment, production, and inventories will hereafter contract, employment will decelerate and contract later in the year, jobless claims will accelerate, the U rate will bottom, and gov’t spending as a share of GDP will bottom and accelerate hereafter along with an increase in the fiscal deficit in the second half and into 2015.
The secular post-2007 trend rate for real final sales per capita is within the margin of error of 0% for the deflator and import prices, which implies a post-2007 trend rate for employment of no more than 60,000-65,000/month, a structural U rate of ~7%, and no growth of the labor force.
An echo bubble for housing peaked in 2013 and is in the process of bursting and rolling over into another recession today.
Nominal wages, GDP, and reported earnings will again contract during the next recession, along with the trend of CPI and the 10-year Treasury yield continuing a secular decline, if not contraction for CPI and a 10-year yield at 1%.
Prepare for the next global debt-deflationary recession, stock bear market, and wage and price deflation.
Good post, BC!
Slow GDP growth, poor employment numbers, very low inflation, and the Fed tightens monetary policy.
Which of these things is not like the others?
Could someone explain to me what the reason is for the increase in health expenditures? I am genuinely curious.
Obamacare. Maybe there’s a crowding out of other spending going on?
patrick, who are you going to blame for the past decade of increases in health care costs? obamacare argument is a fake.
You are correct, Mr Sullivan, as the cost of BarrockoCare is going
to cost consumer and America dearly…
Watch cost go through the roof, as the numbers come in and the
crony insurance companies have a much higher payout vs income
premium…They will be in WDC with their dirty hands out.
The insured will get reamed again…Those supporting Health
Nationalization are going to look like fools, because it is
unnatural law.
hans, i can ask you the same question as patrick. who are you going to blame for the past decade increase in health care costs? what was the obamacare equivalent for the past decade? rising costs is not a new phenomenon. your obamacare arguments are bogus.
Hugo, I read a piece the other day, which suggested
major capex spending on hospitals and other medical
centers…The largest increase since 2007.
I think McBride is right and the next quarters will bring a GDP improvement- for all the reasons have a look at calculatedriskblog.com.
Consider in your personal life if you have assets that are not leveraged are you able to spend and invest more? Now consider that you are leveraged to your eyeballs. Do you feel free to spend and invest?
A national economy does not change the laws of economics. When a national economy is highly leveraged with homes underwater and on the verge of foreclosure, when unemployment is high and a constant threat, when national tax rates are driving domestic production out of the country, how can you insist that recovery is right around the corner? Until we pay some of the bills and deleverage the value of assets there will be no recovery. It is not really all that hard to see. The average American can see it. It takes and economist to miss it.
ricardo,
private sector has been deleveraging. but you also want the government to deleverage as well, correct. well the private sector plus the public sector is the total economy. if they both delever, can you have any growth? that is why in a recession/depression environment, the government should not be deleveraging, but actually covering the decrease of the private sector. you cannot have growth when all aspects of an economy are cutting back. you need to understand the difference between private and public sector behavior. it is really not hard to see. unless you believe that high unemployment is required as a cure. but again, how does rising unemployment produce growth?
Comrade Ricardo
Happy May Day!
You started off okay, but then you didn’t complete the thought. I believe it’s because you are committing the fallacy of composition. While you as an individual can save, your saving requires a counterparty willing to put that saving to use; that is, someone willing to borrow your saving. Yes, consumers and private businesses have been trying to deleverage. That means they have to save more. And while individuals can save more, every dollar they save has to find someone willing to borrow that dollar. Putting the money in a coffee can or under your mattress takes money out of the economic system and is not saving in the economic sense of the term. So while you “saved” those quarters in the coffee can, someone else now has less income. That kind of savings are just leakages. It’s just a law that in equilibrium saving must equal borrowing. You cannot have more overall saving than there is borrowing. If private consumers and private businesses are deleveraging and less inclined to borrow, and if other countries aren’t inclined to buy your exports to make up for the lost investment, then who else will absorb that saving? The answer is the government. The government is the borrower of last resort. I know that’s a hard thing for you to swallow, but it’s an inescapable conclusion of your own deleveraging argument. You just lacked the intellectual courage to think it all the way through.
Now it’s time to enjoy May Day and listen to the Internationale: http://www.youtube.com/watch?v=t8EMx7Y16Vo
Is it plausibe that much of the healthcare spending is due to uncertainty and expectations of having to switch to higher deductable/co-pay plans? Maybe people have been making use of their current coverage while they still can.
It is hilarious that half the commenters are predicting doom and half are predicting “boom” years (which is laughable). I predict we continue to muddle through, with a recession in 2017.
288000 laughable!
As your own charts show quarterly real GDP growth was negative for one quarter in 2011 and in 2012, so having a quarter like the one just reported appears to be no big deal in a long term stagnation scenario. Current year/year real GDP growth is 1.7% as compared to an average of 2.25% over the previous three years so the single quarter of near zero growth is just another factor showing that breaking out of the 2.25% sluggish trend is much more difficult than the consensus things. Remember, for three or four years now the consensus forecast –both private and government — has been that the economy is on the verge of breaking out of the weak growth trend. We should be very use to the current census of stronger growth ahead.
That is one of the problems with a stagnant growth environment. If trend growth is 4% and the economy is hit with a 2% shock the economy can continue chugging along and have the momentum to quickly rebound. But if trend growth is 2% and the economy is hit with a 2% shock growth drops to zero and the ability of the economy to keep growing is severely damaged.
Game players – US Governmental units.
http://nypost.com/2014/04/30/us-plays-delusional-economic-numbers-game/
http://seekingalpha.com/article/2182623-more-on-the-gdp-mystery
Yes, that’s an interesting article, Hans.
My latest on the Barrel blog:
http://blogs.platts.com/2014/05/01/oil-majors-costs-prices/
Some really terrible numbers out of Chevron today.
http://investor.chevron.com/phoenix.zhtml?c=130102&p=irol-news&nyo=0
Thank you, Mr Kopits! Congrats on the publication on Platts!
That is quite an honor, indeed.
Slug,
You did your communist cronies proud on May Day!!
You analysis is typical of demand side analysis. You do not understand capital. You went into a diatribe on Keynes definition of savings but I was not talking about savings. I was talking about asset value and collateral.
If your home is totally free of any mortgage you have great asset value. A lender is more inclined to lend to you because the asset can be held as collateral for the loan and will reduce the risk.
You make the typical demand side mistake of equating value with quantity of currency rather than the actual value of the asset. You remind me of the TV ad where a woman is in her office and she draws a cake on a piece of paper and eats it. It is funny when you see it because we all know that is absurd, but for some reason when demand side economists do the same thing handing little printed pieces of paper over to the banks demand side economists stand in awe. Trying to paper over the loss of asset value simply does not work.
If the economy is leveraged to the point that the owners of assets can no longer borrow because they have no collateral value does the government increasing loans really correct the problem? Actually that compounds the problem because it serves to increase the debt burden without any increase in the value of assets.
Our economy is suffering today because lenders cannot find qualified borrowers – no asset value. No matter how much currency the government gives the banks this does not change. The result is that much of that excess money simply goes into bank reserves. Banks would rather lend it but they would not rather lose it. Banks do not lend it not because they are mean and refuse to support recovery. They do not lend it because there is a very high risk that the loan will never be serviced.
This is only one aspect of how our current demand side economic policies are preventing recovery. Every time there is a small increase in asset value the government sucks it out of the system by trying to return the leverage to unsustainable levels or by taxing away the value to give to those without assets.
What needs to happen is the currency needs to be stabilized so that it will accruately reflect values and then producers must be allowed to recover the asset values by producing new consumer demanded assets. That is the only way to overcome this faux recovery of currency expansion and return to a real recovery of production and prosperity.
I realize this is foreign to you because you reason in a world of aggregates and averages and have difficulty looking at an economy as the sum of individual transactions. If half of your population is freezing to death and the other half is burning to death in the aggregate your statistics are fine. Then when everyone is dead you shake your head and wonder why they did not understand your calculations. They simply should not have died in the aggregate.
baffling,
what on earth makes you think the private sector is deleveraging?
http://research.stlouisfed.org/fred2/series/TOTALSL/#
anonymous,
you don’t think the three year gap from 2008 to 2011 is deleveraging? look how far below the 15 year previous trend line were are at today? of course total debt is going to increase-our population as a hole is increasing. but we had a three year hole and an additional three years of catchup to trend which did not occur. this is deleveraging! that big hole is the reason for the high unemployment from 08-11, with a slow lowering of that number over the past couple of years. thanks for the chart to illustrate the point.
Monus, that is a killer chart! Mr Roche, at the Pragmatic Capitalist
has been pro-offering the same non-sense.
XO your list is hilarious
1. More regulations do not mean less risk. It means more drag on the economy though.
3. ACA–When will the cost savings start and how will we know? If costs go up by 20% for 6 years and then level off are you going to call that a victory? You will see no productivity boost from “healthy workers” because general levels of health is not the bottleneck holding back the average worker.
4. This is probably the most absurd point. Most degrees add little value to the workplace.
5. You claim these wars are over but we are not returning to prewar military spending, so we are continuing to waste the money.
6. Agreed this was a waste, but it will not have a serious effect on labor.
9. Immigration–most of the immigrants are not the best and the brightest.
10. Population increasing–This isn’t relevant. GDP/capita is.
anonymous,
“1. More regulations do not mean less risk. It means more drag on the economy though.”
you saw the risk from a deregulated financial system a few years ago. you are denying the reality of our experience over the past decade.