Is there a linear relationship over time between the share of workers affected by the minimum wage and the ratio of the minimum wage and average compensation?
Figure 1 shows the seemingly close relationship (following [0]).
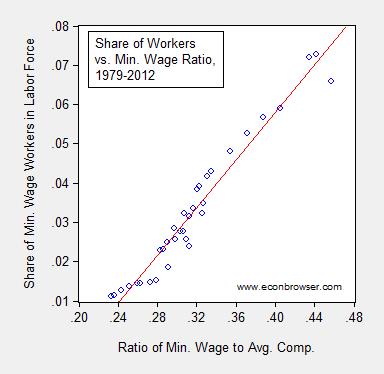
Figure 1: Share of workers affected by minimum wage to labor force against ratio of minimum wage to average compensation in the nonfarm business sector. Average compensation is nonfarm compensation index calibrated to 1979 average hourly wage in private sector. Source: BLS and author’s calculations.
Below is a time series plot of the share of labor force at the minimum wage and ratio of the minimum wage to compensation.
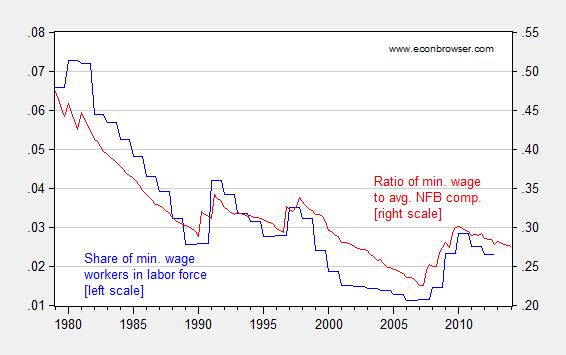
Figure 2: Share of workers affected by minimum wage to labor force ( ratio of minimum wage to average compensation in the nonfarm business sector. Average compensation is nonfarm compensation index calibrated to 1979 average hourly wage in private sector. Source: BLS and author’s calculations.
The Economic Policy Institute has recently estimated the number of workers affected by a $10.10 minimum wage at 16.7 million, which using April 2014 numbers is about 10.7% of labor force. This would at first glance seem out of line with past experience, as shown in Figure 1.
Let’s formalize matters. Consider the regression of the quarterly data on the share on the ratio:
share = α + β ratio + u
OLS yields a slope coefficient of 0.29 (t-stat = 21.2), Adj. R2 of 0.94, which seems to be a tight relationship. However, note the Durbin-Watson statistic is 0.56, considerably lower than the Adj. R2, indicative of spurious correlation. Is this an issue?
An ADF-GLS (Elliott-Rothenberg-Stock) test fails to reject the unit root null for both series (at 10% MSL). Both series reject the trend stationary null at the 5% MSL (and reject the mean stationary null at the 1% MSL). Hence, one can be reasonably sure they are both well characterized as difference stationary series.
Are the series cointegrated? That is a condition which would validate the regression reported above. Using the more powerful Johansen procedure, using asymptotic critical values, the no-cointegration null hypothesis is not rejected at the 5% level (allowing a constant in the c.v., which is consistent with running a line through a scatterplot). Using finite sample critical values, one would fail to reject at the 10% MSL.
One characteristic of a spurious regression is highly variable regression coefficients as additional data points are added. Figure 3 presents regression coefficients over five year increments.
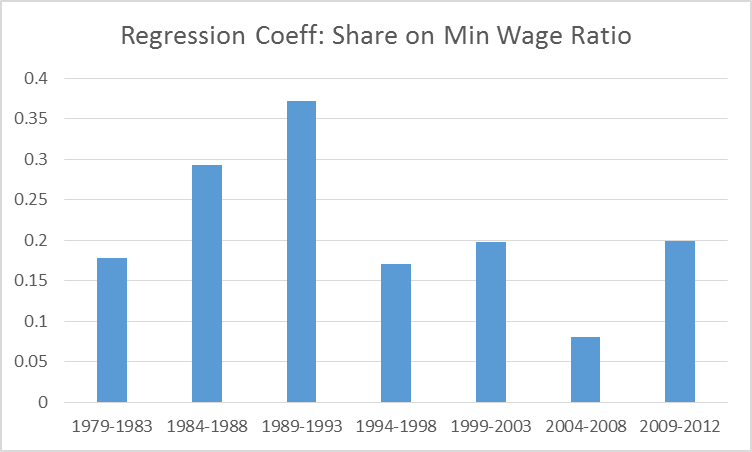
Figure 3: Coefficient estimate of β over non-overlapping five year intervals of quarterly data. Source: Author’s calculations.
What’s going on? My interpretation is that over the past 35 years, the distribution of workers around the average compensation level has shifted, from one Pareto distribution to an even more skewed Pareto distribution. Once one thinks in this context, it’s clear that a linear relationship is unlikely.
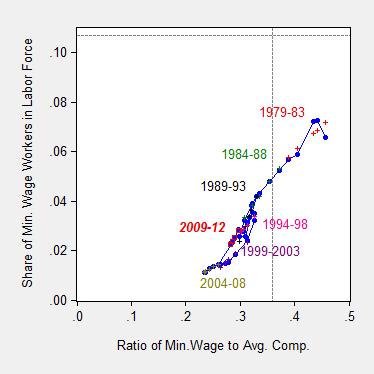
Figure 4: Share of workers affected by minimum wage to labor force against ratio of minimum wage to average compensation in the nonfarm business sector. Average compensation is nonfarm compensation index calibrated to 1979 average hourly wage in private sector. Sample period specific fitted values denoted by colored + symbols (except for 2009-12, by red open squares) Dashed lines at author’s estimate of minimum wage to average compensation ratio in 2016Q2, and share of minimum wage workers, divided by 2014Q1 labor force. Source: BLS and author’s calculations.
Note that by using the 2014Q1 labor force, I overstate the labor share covered; assuming about 0.7 ppts growth in labor force over the next two years, one would then downshift the horizontal dashed line by about 1.5 ppts (0.015).
As a consequence, the Economic Policy Institute estimate that a $10.10 minimum wage in 2016 will directly affect about 16.7 million (estimated workers affected [1]divided by April 2014 labor force) is not, in my mind, surprising.
For more on unit roots, see “Beware of econometricians bearing estimates,” JPAM (1991)..
I was surprised at the linearity of the historical data, also. Even if the relationship turns out to be persistently linear at these levels, the slope would surely have to increase at some higher MW level.
There does appear to be a trend change at MW/AW ratios under about 27%, which I believe is due to the MW decreasing to below the natural minimum at those levels. According to the BLS data, only a small portion of the total MW labor force is at the minimum wage at those levels. Most of the remaining total MW workers are below the minimum wage, suggesting that at those levels the legal MW becomes a much less binding constraint. I think this why the coefficient is lower in the later bins in your test of incremental coefficients. The shift in trend is evident on the way back up, also, in the data from the 2007-2009 hikes, where the number of MW workers remained fairly low until the last hike, and then in 2010, shifted back to the trend that had existed in the 1990s.
I didn’t quite understand your last paragraph.
Thanks.
Michael Erdmann: My point is that 16.7 million might not be out of line with the covered share/min wage to average ratio for recent periods; hence, the implication that lots of unemployment from a minimum wage increase to $10.10 does not necessarily follow.
Chart 2 comparing the share of minimum wage workers to the ratio of the minimum wage to average earnings suggest the the problem is not that the minimum wage is so high that it keeps firms form hiring teen or other low skilled workers. Rather the problem is that the minimum wage is too low to attract such workers in to the labor force.
For example the last time the US economy was a t full employment less than 10% of employed teenagers were paid the minimum wage.
SHARE OF EMPLOYED TEENAGERS ( 16 TO 19)
MAKING MORE THAN THE MINIMUM WAGE.
2003……….90.1%
2004………..90.9%
2005………..91.1%
2006………..91.3%
2007…………93.1%
Even after the latest round of minimum wage hikes and the great recession some three – quarters of EMPLOYED TEENS made more than the minimum wage–
78.9% in 2012.
Source: BLS characteristics of minimum wage workers — various years.
In 2013 the share of teens making more than the minimum wage was 80.5%.
I’m puzzled by why such a graph is interesting or surprising. The independent variable (minimum wage/average age) is not a mere exogenous force acting on the dependent variable, but a property of the distribution also. It actually would be surprising if the graph did not show the pattern—it would imply when the average wage is going up the lowest wage workers were losing.
Menzie,
Do you think that, assuming it was politically feasible, it would be beneficial to the economy and labor force to abolish the minimum wage and, instead, roll those people that are negatively affected by the lack of minimum wage into the current welfare system? Currently, minimum wage is a ‘shadow welfare program’, one that is not directly accounted for in the measure of our welfare system, but is still a transfer of wealth from one group of people to another. Or, do you think we should at least restrict the minimum wage to people that are at least 19 years old. When I was in high school I was such a bad worker that I was probably worth about $1 an hour, but I still got paid minimum wage because the skating rink I worked at had to have someone manning the doors at all times. I still lived with my parents and didn’t need any money, all the money I got just went to frivolous stuff.
Anonymous, an Austrian economist once said:
“What do you call a person whose labor is worth less than the minimum wage?:”
“Permanently unemployed.”
My reply was:
Under 16 or disabled.
Also, I may add, the same Austrian economist stated: “One’s understanding of the minimum wage law in particular (and price controls in general) is an extremely accurate litmus test for basic economic literacy. Anyone who doesn’t understand or ignores the negative consequences of government-mandated price controls like the minimum wage has flunked the most basic economic literacy test, and cannot be taken seriously.”
My reply was: It’s not that economists who favor raising the minimum wage (many of them top economists, including Nobel Prize winners) don’t understand supply & demand, it’s that many economists who are against the minimum wage live in a vacuum and are void of the knowledge how the other 99.9% of economic forces interrelate and interact.
Here’s a new post I did.
http://idiosyncraticwhisk.blogspot.com/2014/05/revisiting-minimum-wage-workers-as.html
It’s amazing how someone can jump to conclusions with so little information. The only value (perhaps) is determining the “natural minimum wage” (somewhere above zero), where the minimum wage is ineffective as a policy tool.
Discussions of minimum wage almost always miss the elephant in the room. Minimum wage increases are only necessary in an economy where the monetary unit is constantly being debased. The intention is to force up the bottom of the wage ladder for a period of time granting those at the bottom income greater than the market rate. Of course this is foolish. In a non-inflationary economy such increase must by necessity create unemployment. Without explicitly stating it all arguments for a minimum wage always assume a condition of monetary debasement. As usual government creates a solution to a problem that they have created that only makes the problem worse and expands the problem to other sectors of the economy.
Opponents of the minimum wage argue that if firms could pay less it would leads to a jump in employment of people who are made unemployed by the minimum wage.
But look at chart 2, as the relative minimum wage declines, minimum wage employment also falls both on both a relative and absolute basis.. That is exactly the opposite of what the opponents of the minimum wage argue.
OK, I’m waiting for an opponent of the minimum wage (or anyone) to explain this.
Actually, in the US the only time minimum wage employment rises is when the minimum wage rises. Yes, I know the opponents have another theory to explain why their first theory fails. Maybe that explains the rise in minimum wage employment rises after a minimum wage hike, but that theory does not explain why minimum wage employment falls when the relative or real minimum wage falls.
Milton Friedman claims that the test of a theory is its ability to forecast, and on this basis the theory of the minimum wage fails miserably.
Spencer,
As the relative minimum wage falls some workers remain employed at higher wage levels. This is evidence of the minimum wage as a binding price floor: relax the constraint and less people (relatively speaking) are affected.
Your comments make no sense.
OK, the minimum wage is a binding floor. But if the real or relative floor falls it still should make it profitable to employee some of the people that had been priced out of the labor market at a higher real or relative minimum wage.
A falling floor price should NOT cause lower demand.
If I lower the price of ice cream more is demanded.
If I lower the floor price of labor more should be demanded.
It isn’t called the Theory of Supply and Demand. Maybe because there have so many tests of it, such as this one in Seattle;
http://kuow.org/post/minimum-wage-limbo-keeps-small-business-owners-night
The five minute audio is even more devastating to the proponents of the $15 minimum than the text of the article (even people who were in favor of it are now having second thoughts as they realize it will affect their businesses). The new law hasn’t even taken effect and it already is demonstrating disemployment effects.
How does the law of supply and demand explain income and inputs?
Uncertainty can create disemployment.
When the minimum wage is actually raised, the uncertainty will be eliminated, and every small business will compete on a level playing field.