Economic Effects and Implications for the Global Trading System
Today we are fortunate to have a guest contribution written by Peter A. Petri (Brandeis University) and Michael G. Plummer (The Johns Hopkins University, SAIS).
Introduction
Are global and regional initiatives to establish new trade rules diverging, competitive strategies? On one hand, the “mini-package” reached at the Ninth WTO Ministerial meeting in Bali this past December was a milestone in the two-decade history of the WTO. While the package was limited in scope—covering aspects of trade facilitation, agriculture, and development-related issues—it demonstrated that multilateral trade initiatives are still possible. On the other hand, more ambitious recent trade liberalization efforts have focused on bilateral and regional arrangements—over 500 have been notified to the WTO as of July 2013—especially in the Asia-Pacific region.
In a series of books and papers (listed and mostly downloadable from our website, asiapacifictrade.org) we argue that global and regional initiatives are proceeding in tandem for practical reasons and are ultimately complementary. Global rules and related enforcement mechanisms are necessary and need to be updated due to rapid changes in the global economy. Yet traditional approaches to negotiating such rules—involving 159 very diverse economies and increasingly complex issues in a single undertaking—have proved unworkable for now. Instead, large regional and plurilateral sectoral agreements can lead to de facto global rules, either because the economies or products covered comprise a dominant share of world trade, or because similar rules are eventually adopted broadly in the WTO. Even ardent champions of multilateralism like Jagdish Bhagwati are now advising governments to pursue regional negotiations (Daniels, 2014).
These possibilities are emerging forcefully in three new mega-regional trade negotiations, the Trans-Pacific Partnership (TPP), consisting of 12 Asia-Pacific countries, the Regional Comprehensive Economic Partnership (RCEP), consisting of 16 Asian economies, and the Trans-Atlantic Trade and Investment Partnership (TTIP), linking the 28 countries of the European Union and the United States. Additional initiatives are underway between the European Union and Japan and between China and its larger trading partners. If these large, overlapping agreements are successful, they are bound to establish new norms for the global system.
To be sure, success is very uncertain and, even if the negotiations are completed, the results could fall far short of expectations. For example, the TPP, the most advanced of the current initiatives, requires only bilateral market access negotiations among members and will likely leave significant barriers in place. Attempts to reduce non-tariff barriers through regulatory harmonization—in areas such as investment, health and safety standards, environment and intellectual property rights—are especially difficult and subject to great pressure from industry lobbies, on one hand, and public interest groups that want leverage over national policies, on the other. The latter are especially prominent on the Internet and in the media. One result is that anti-globalist perspectives are merging with understandable, but mostly unrelated, concerns about unemployment and inequality, leading to considerable public opposition in several countries.
In practice, the final provisions of the new mega-regionals are not likely to go much beyond recent high quality agreements such as the Korea-United States Free Trade Agreement (KORUS), although of course they will cover more trade. The KORUS agreement, now in force for more than two years, appears to be generating modest positive trade effects without any of the regulatory calamities feared by opponents. Still, trade politics is much more contested today than at similar stages of negotiations in the past, and is taking its toll on progress in all three negotiations.
Estimates of the Effects of TPP, RCEP and the FTAAP
Because the Asian mega-regionals cover so much trade, their potential economic effects are large. We use an advanced computable general equilibrium (CGE) model to estimate gains associated with RCEP and the TPP and the incentives that are likely to generate for later enlargement and consolidation if they are completed. Thus, we simulate not only the current 12-member TPP, but also a 16 country configuration that includes South Korea, the Philippines, Thailand and Indonesia, the likely additions in a subsequent enlargement (see Figure 1). In addition, we examine a region-wide Free Trade Agreement of the Asia Pacific (FTAAP), encompassing all members of the APEC forum. Given China’s increasingly favorable attitudes toward the TPP and FTAs, in recent work we also simulated a TPP agreement that includes China, which generates results similar to those of the FTAAP.
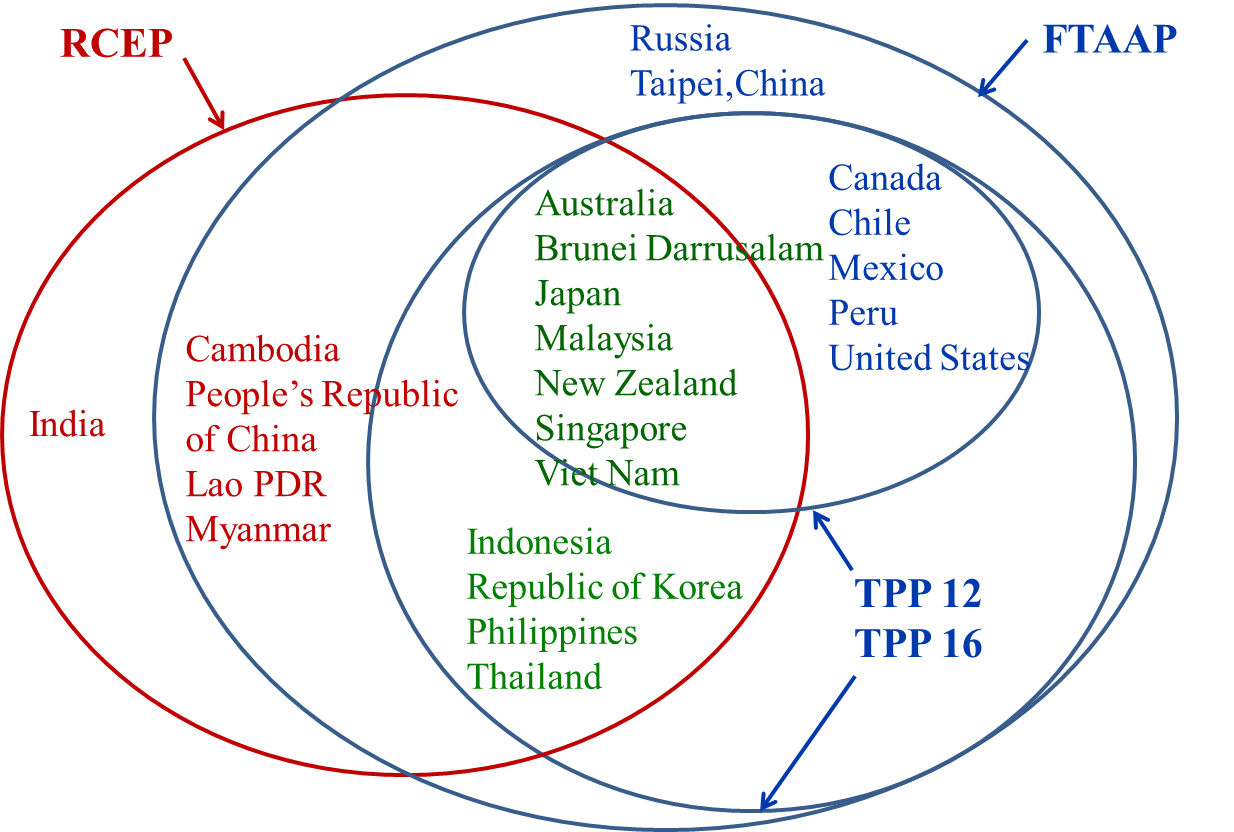
Figure 1: RCEP, TPP, and FTAAP Tracks. Source: the authors.
The details of the CGE model can be found in our papers and on asiapacifictrade.org. One novel feature of the model is that many sectors are simulated with a Melitz-style approach that assumes heterogeneous firms, differentiated products and monopolistic competition (Zhai, 2008). Bilateral trade flows are subject to both fixed and variable costs. Another crucial feature is the detailed treatment of trade agreements. While the actual TPP and RCEP agreements are not yet known, we project their templates using accords previously negotiated by the United States for the TPP and ASEAN for RCEP. In neither case do we assume the full elimination of barriers, but given that US-based agreements tend to be deeper and more comprehensive than ASEAN-based ones, the TPP scenarios include more extensive liberalization than the RCEP scenario. Changes are estimated relative to a baseline that includes all previously-negotiated agreements, even if they are not yet completely implemented, thereby giving us marginal changes attributable to TPP or RCEP.
Key results are shown in Table 1. All scenarios produce substantial benefits; global income rises by $223 billion and $451 billion in the TTP12 and TPP16 scenarios, respectively. Hence, the addition of South Korea, Indonesia, the Philippines, and Thailand in the TPP more than doubles aggregate gains. These sizeable numbers derive because the latter three economies do not have an FTA in place with the United States. Moreover, the lion’s share of gains are due to trade creation; trade diversion comes to about one-fourth the total gains in both TPP scenarios, with China bearing the greatest share of the burden (but less than one-half of one percent of Chinese GDP). In absolute terms, Japan and the United States are the biggest beneficiaries, but relative to GDP the outward-oriented ASEAN economies of Vietnam (14 percent) and Thailand (8 percent) would gain most.
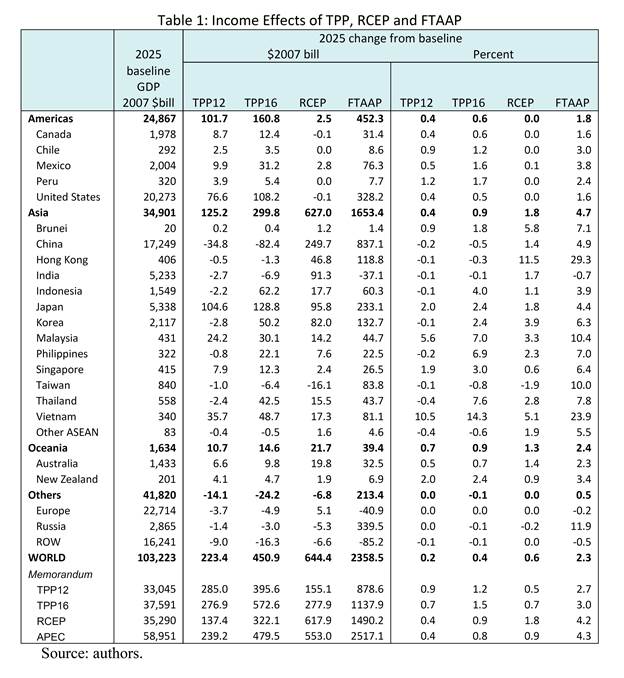
The RCEP scenario generates larger gains than the TPP scenarios, mainly due to the assumed liberalization of trade among China, India, Japan and Korea, the biggest economies of the region, and other factors such as cumulation of rules of origin. The total increase in income is estimated to be $644 billion, or 2 percent of Asian GDP. Trade diversion is just one percent of total gains; in fact, given the associated growth and terms of trade effects, some excluded economies, including the EU, actually benefit from RCEP. As expected the biggest beneficiaries in absolute terms are the countries without FTAs that already cover the block (China, Japan, South Korea, and India).
Finally, we consider the effects of an APEC-wide FTAAP, a goal articulated at the November 2010 APEC Summit in Yokohama, Japan (the “Yokohama Vision”). Indeed, APEC leaders endorsed the TPP and Asian agreements (now taking the form of RCEP) as pathways to this goal. Most encouragingly, launching a feasibility study of FTAAP has now emerged as a key Chinese objective as China hosts APEC in 2014.
The idea is an ambitious, comprehensive, inclusive, outward-oriented FTA by 2020. As Table 1 shows, the gains from the FTAAP are far larger than for the RCEP and the TPP scenarios, coming to $2.4 trillion, or 2.3 percent of global GDP. This incremental increase exceeds estimates of even ambitious scenarios of multilateral liberalization under the Doha Development Agenda. Big gains derive from the fact that this scenario establishes an FTA between the United States and China, the first and second largest economies in the world. Estimated gains to the United States are $328 billion, more than three times those from the TPP16, and to China, $838 billion, more than three times those from RCEP. From an economic perspective, both economies will have a strong incentive to merge the tracks into FTAAP over time.
Implications
In short, the mega-regionals of the Asia-Pacific region offer pathways toward deeper economic integration. This goal has proved elusive in the Doha Development Agenda negotiations, despite 12 years of effort and the Bali mini-package. The TPP and RCEP negotiations are somewhat more manageable and could yield similar or even larger benefits, although their outcomes are still uncertain.
Several key implications emerge. First, the benefits are likely to be substantial for all members of both the TPP and RCEP. The early stages of the tracks favor smaller, low-income economies such as Vietnam; the middle stages larger countries like Japan and Korea; and the final stages China and the United States. Gains derive primarily from trade- and investment-creation and related productivity increases in the Melitz model, and not from trade diversion from excluded economies. The Asia-Pacific is close to a “natural” trading bloc with efficient producers in most traded industries.
Second, templates matter; they significantly affect the gains from integration. Since the TPP template implies deeper liberalization, it would generate greater benefits, including for China and other Asian economies if it were adopted region-wide.
Third, the tracks appear to be following a dynamic path toward region-wide integration. The TPP negotiations, for example, have expanded in stages from 4 to 8, 9, 11 and now 12 members. Many Asia-Pacific economies could eventually join both tracks, with preferential access to most regional markets. That would leave China and the United States among the few countries without such region-wide preferential access, giving them incentive to promote the consolidation of the tracks. As we noted elsewhere (Petri & Plummer, 2012), cooperation between China and the United States should start now with long-term convergence in mind, for example through the Bilateral Investment Treaty now in negotiation.
Fourth, the concern, expressed by some scholars, that the TPP and RCEP will divide the Asia-Pacific into competing blocks is overblown. Overlapping membership helps to ensure that the initiatives do not devolve into inward-looking FTAs. Countries involved in both negotiations are likely to argue for similar provisions in order to simplify internal policy adjustments. The similarity of the RCEP guidelines and the structure of the TPP provide an example of this trend. Most importantly, while China and the United States differ on many issues, they also have a large stake in ensuring that the region’s trade initiatives develop in complementary directions.
Fifth, Asia-Pacific economic integration may well reinforce the global trading system. The region has always championed “open regionalism”—measures that emphasize trade creation and increasingly inclusive agreements. With the EU engaged in negotiations on the TTIP and with key Asia-Pacific countries, over three-fourths of the global economy could be integrated under the new mega-regional accords. Should this materialize—and there are many hurdles to overcome—the case for a global accord may prove irresistible. Thus, mega-regional accords in the Asia-Pacific could emerge as the ultimate “building blocks” of multilateralism.
References
Daniels, F. J. (2014, April 25). Top economist Bhagwati eyes role in Modi government in India. Reuters. Retrieved from http://www.reuters.com/article/2014/04/25/us-india-election-economist-idUSBREA3O0K520140425
Petri, P. A., & Plummer, M. G. (2012). The Trans-Pacific Partnership and Asia-Pacific Integration: Policy Implications. Peterson Institute for International Economics. Retrieved from http://papers.ssrn.com/sol3/papers.cfm?abstract_id=2108399
Zhai, F. (2008). Armington meets Melitz: Introducing firm heterogeneity in a global CGE model of trade. Journal of Economic Integration, 23(3), 575–604.
This post written by Peter Petri and Michael Plummer.
“Yet traditional approaches to negotiating such rules—involving 159 very diverse economies and increasingly complex issues in a single undertaking—have proved unworkable for now.” Like the UN?
The issue is not the hypothetical benefit from various trade configurations, but the political drivers behind them. The recent ruckus in Ukraine and subsequent unsettling of the EU-Russia relationship… and dissension within the EU… points to the political and strategic influences of trade circles that go beyond economic considerations. I’m of the opinion, for example, that Russia’s “pivot to Asia” has more to do with political and military strategy than simply seeking an alternative customer base for its natural resources. China, likewise, sees the focus on Asia as a logical step to increase its position of economic and military dominance… and access to resources globally.
Russia and China are in a position to create an Asia hegemony that could lead to a reversal of NATO’s encirclement or “Anaconda” plan for Russia. With a strengthening of trade and military cooperation between Russia and China, the next step would be a consolidation of their Asian dominance through inclusion of India, Iran, Syria, the Stans, North Korea [Russia has had recent overtures there] and SE Asia in the economic circle along with “security arrangements”. It is also possible that Egypt could be drawn in because of the U.S. blundering there with its support of the Muslim Brotherhood. That would further open the door to northern Africa. This would leave Turkey feeling vulnerable and less inclined toward an EU-centric strategy. To the east, South Korean and Japan would feel isolated and more inclined to accept a “neutral” position with regard to the West.
Longer term, this new hegemony, led by China, would consolidate inroad to Africa and South America, facilitated by present relationships with South Africa and Brazil.
This is not to say that China and Russia will turn their backs on the U.S. and Europe in the near term. But U.S. “pivot to Asia” military bravado and US/EU/NATO hyper-response in Ukraine, including instigating regime change, has probably served as impetus to both Russia and China to seek new arrangements for the future. Timeframe? Give it two decades.
An “Interesting” What-If . . . .
Some definitions:
Global Net Exports (GNE) = Combined net exports from (2005) Top 33 net oil exporters, total petroleum liquids + other liquids (EIA).
Available Net Exports (ANE) = GNE less Chindia’s Net Imports (CNI)
CNE = Cumulative Net Exports (for a given time period)
ANE “Gap Chart” for 2002 to 2012, showing a decline in ANE, from 41 mbpd in 2005 to 35 mbpd in 2012:
http://i1095.photobucket.com/albums/i475/westexas/Slide04_zpsd68833b7.jpg
The following chart shows the GNE/CNI data from 2002 to 2012, with the extrapolation to the year 2030 based on the 2005 to 2012 rate of decline in the ratio:
http://i1095.photobucket.com/albums/i475/westexas/Slide1_zps9ff3e76d.jpg
At a GNE/CNI Ratio of 1.0, theoretically there would be zero Global Net Exports of oil available to importers other than China & India.
In any case, given the observed GNE/CNI decline, we can estimate* theoretical post-2005 Available CNE (Cumulative Net Exports).
Estimated Available post-2005 CNE:
(15 Gb/year X 25 years X 0.5) – 15 Gb = 173 Gb (billion barrels). This is ANE in 2005 times estimated number of years to zero ANE times 0.5 (to get area under a triangle) less 2005 ANE.
We can then estimate the rate of depletion per year in remaining Available post-2005 CNE.
2006 to 2012 ANE, billions of barrels, by year divided by estimated remaining Available post-2005 CNE (estimated simple percentage depletion by year):
2006: 14.6/173 (8.4%)
2007: 14.1/158 (8.9%)
2008: 14.2/144 (9.9%)
2009: 13.1/131 (10%)
2010: 13.2/118 (11%)
2011: 12.8/105 (12%)
2012: 12.8/92 (14%)
In other words, based on the above data, I estimate that we (theoretically) burned through, in 2012, about 14% of the remaining cumulative supply of Global Net Exports of oil available to about 155 net oil importing countries.
*I assume a triangular shaped net export decline. This method was too optimistic for estimating post-1995 CNE for the Six major net oil exporters (excluding China) that hit or approached zero net exports from 1980 to 2010, based on the seven year 1995 to 2002 rate of decline in their combined production to consumption ratio. For more info, search for: Export Capacity Index
The “Chindia Factor” Export Land Model:
GNE have been slightly below the 2005 level, but basically stable. However, given an (inevitable) ongoing decline in GNE, unless the Chindia region cuts their consumption of GNE at the same rate as the rate of decline in GNE, or at a faster rate, the resulting ANE decline rate will exceed the GNE decline rate, and the ANE decline rate will accelerate with time.
GNE = Global Net Exports of oil
ANE = GNE less Chindia’s Net Imports
GNE “Gap Chart”
http://i1095.photobucket.com/albums/i475/westexas/Slide1_zps3161a25b.jpg
… and right on cue:
http://www.bbc.com/news/world-europe-27762139
[see my comment above]