Three years ago I called attention to the NYU Stern Volatility Laboratory. Since then it’s grown into an even more amazing resource, giving anyone access to constantly updated information about financial conditions in dozens of countries around the globe. Of particular interest are recent changes in their measure of the systemic risk posed by financial institutions.
The basic idea behind the NYU measure of systemic financial risk is to use real-time summaries of the valuations and correlations across different equities to analyze how much of a drop would be expected in the stock valuation of a given financial institution if the country were to face another financial crisis, defined as a 40% decline in the broad market stock index over a space of 6 months. Technical details of how that calculation is done are described in a paper by Acharya, Engle, and Richardson (2012). This loss in equity value is then compared with the institution’s current assets and liabilities to calculate how much additional capital might be needed in order to keep the institution solvent in the event of a financial crisis. The sum of this cost across all financial institutions then gives a measure of a country’s overall systemic risk at any point in time.
For example, here’s what their measure looks like for the United States. It peaked at over a trillion dollars in the fall of 2008, but has improved significantly since, and is now down to about $300 billion.
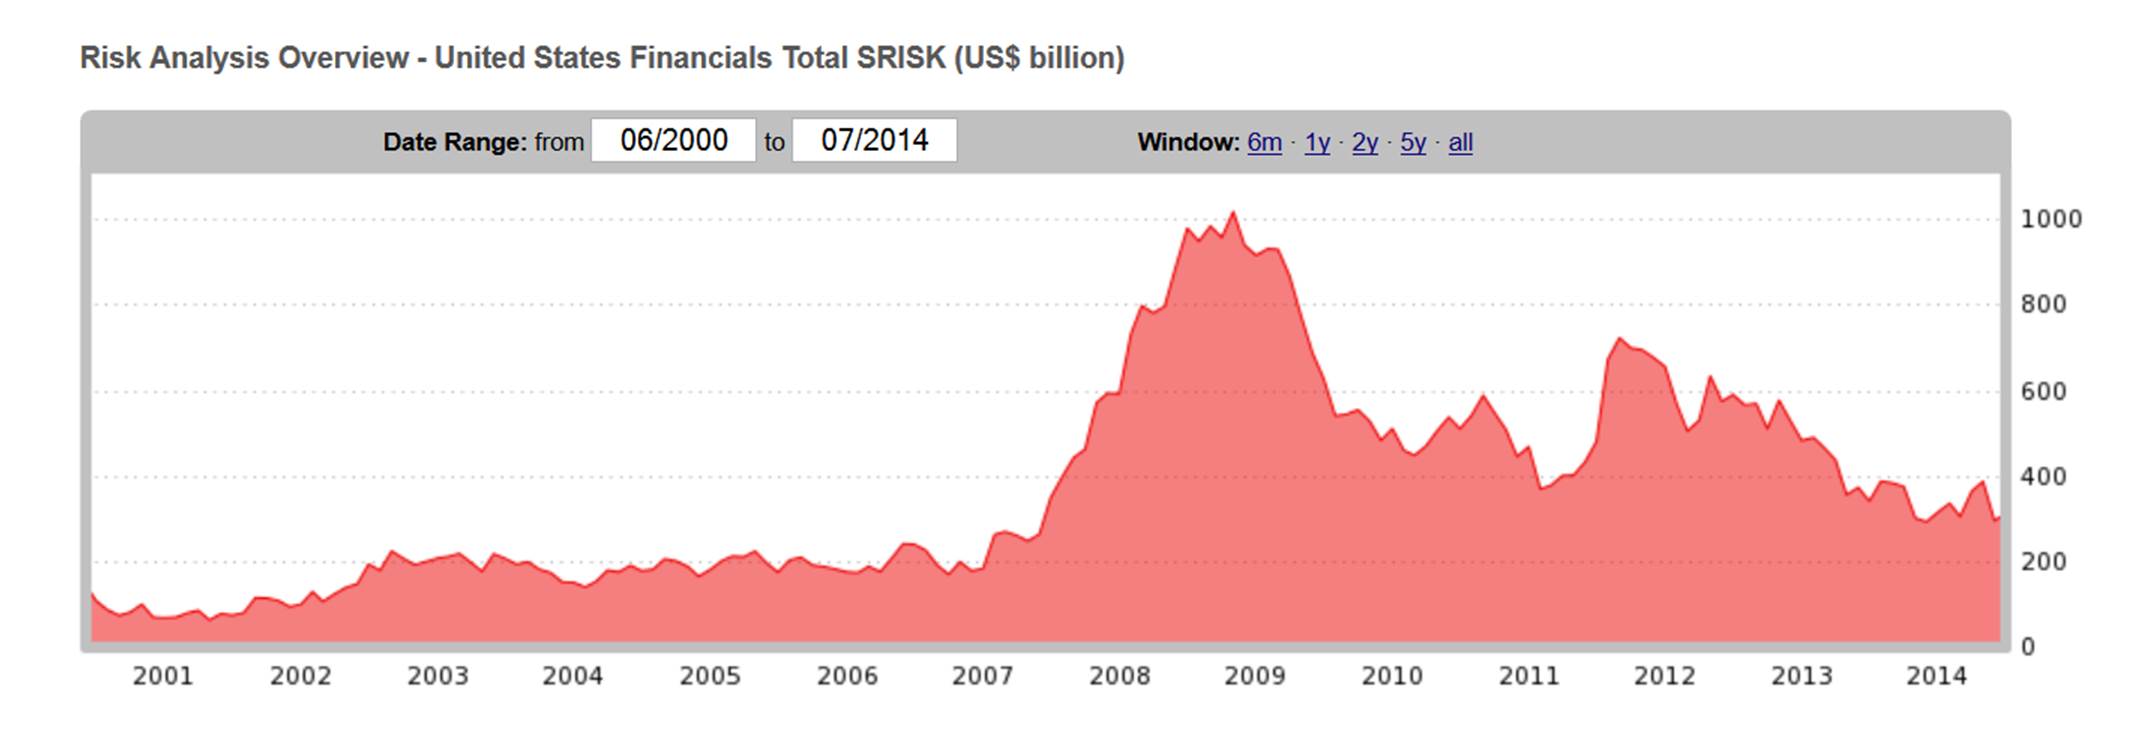
Source: V-lab.
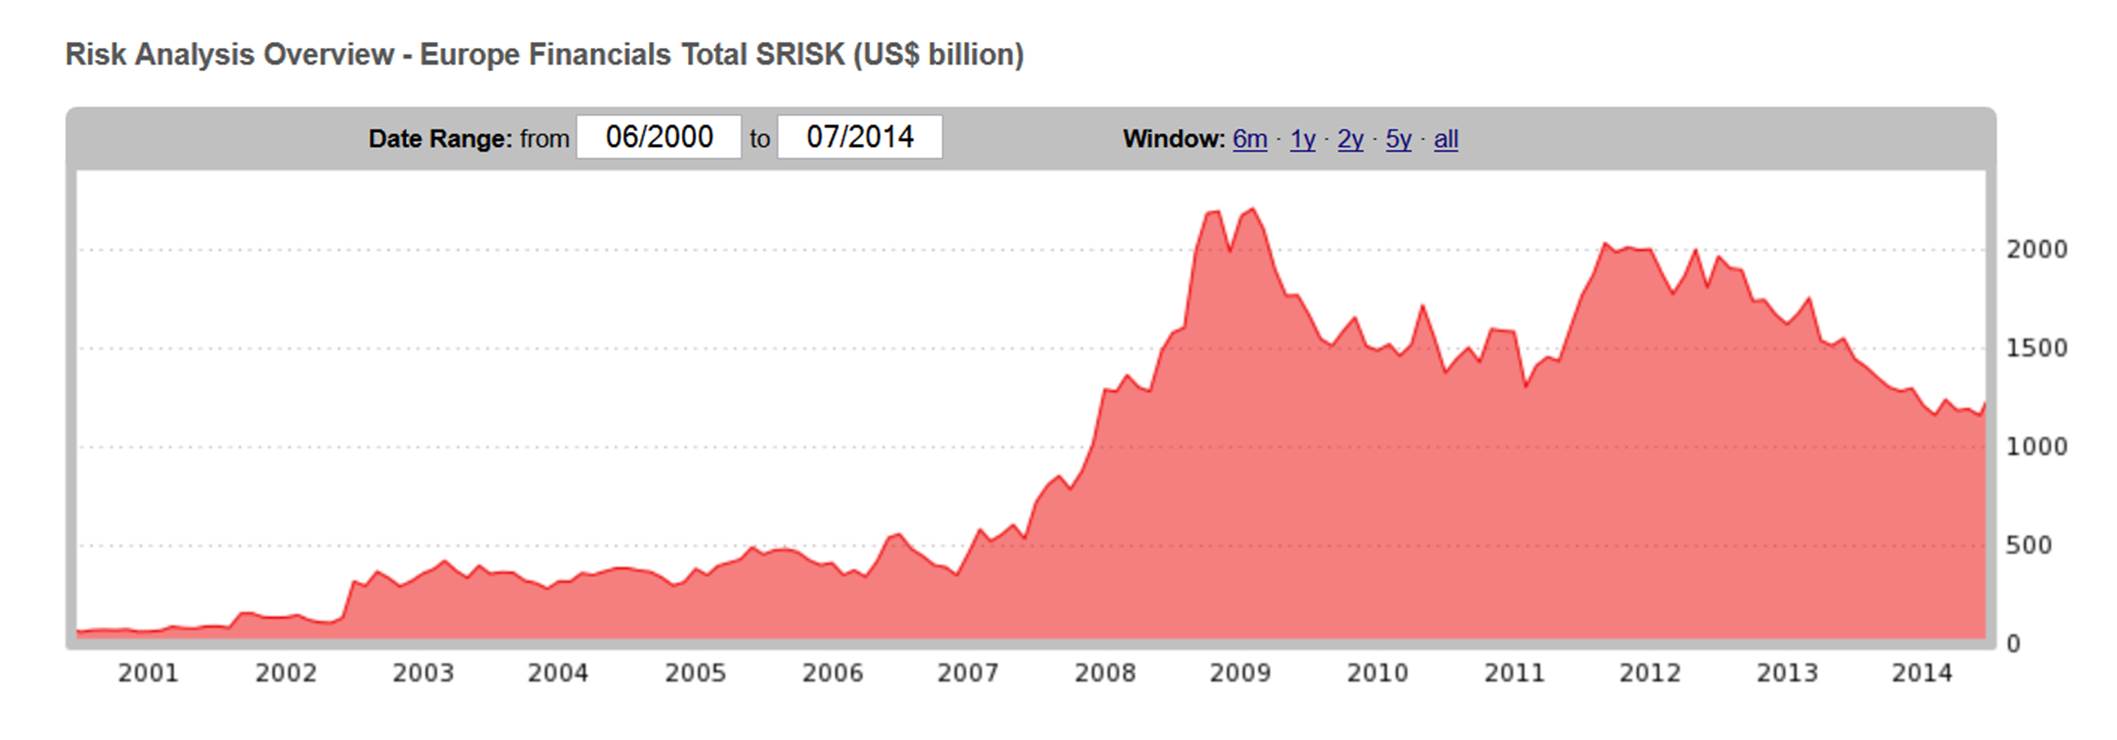
By contrast, sovereign debt concerns pushed the index for Europe in 2011-12 back up near values from the financial crisis of 2008. The measure of systemic risk for Europe has since abated, though it remains quite elevated at about $1.3 trillion.
And reason for concern about Japan has actually increased substantially in the years following the 2008 financial crisis. Notwithstanding, the policies adopted early in 2013 popularly described as “Abenomomics” seem to have helped.
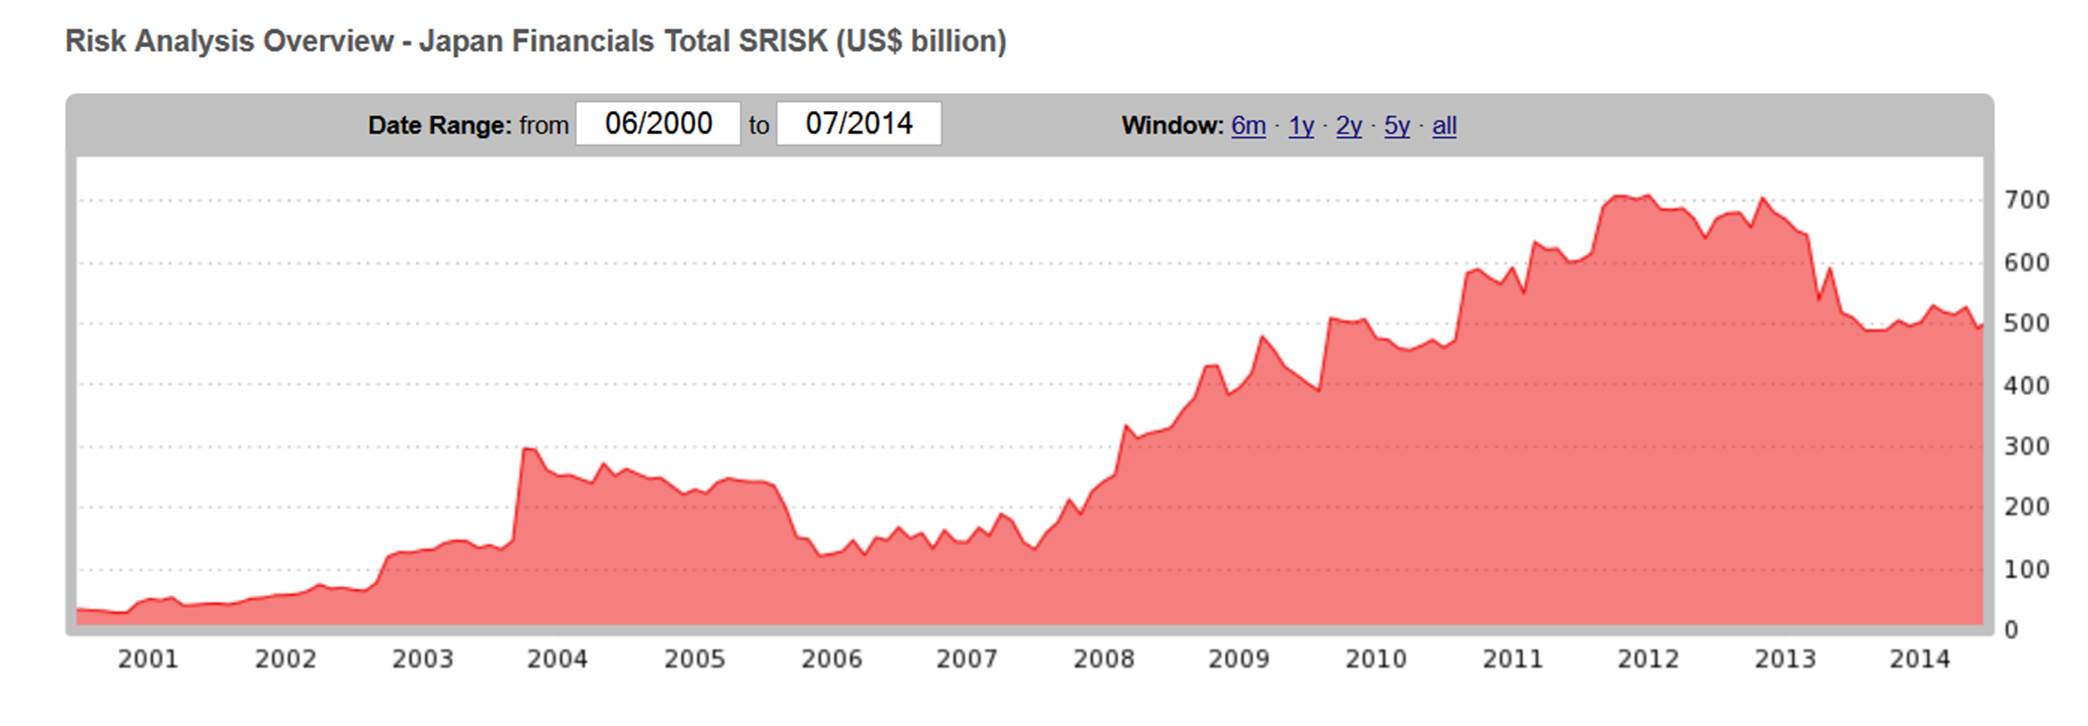
Source: V-lab.
But here’s what really caught my eye– the NYU measure of systemic financial risk for China this year reached an all-time high. This seems to be a result of the fact that liabilities of the Chinese banks have continued to grow rapidly while stock valuations of the institutions appear quite vulnerable to a downturn.
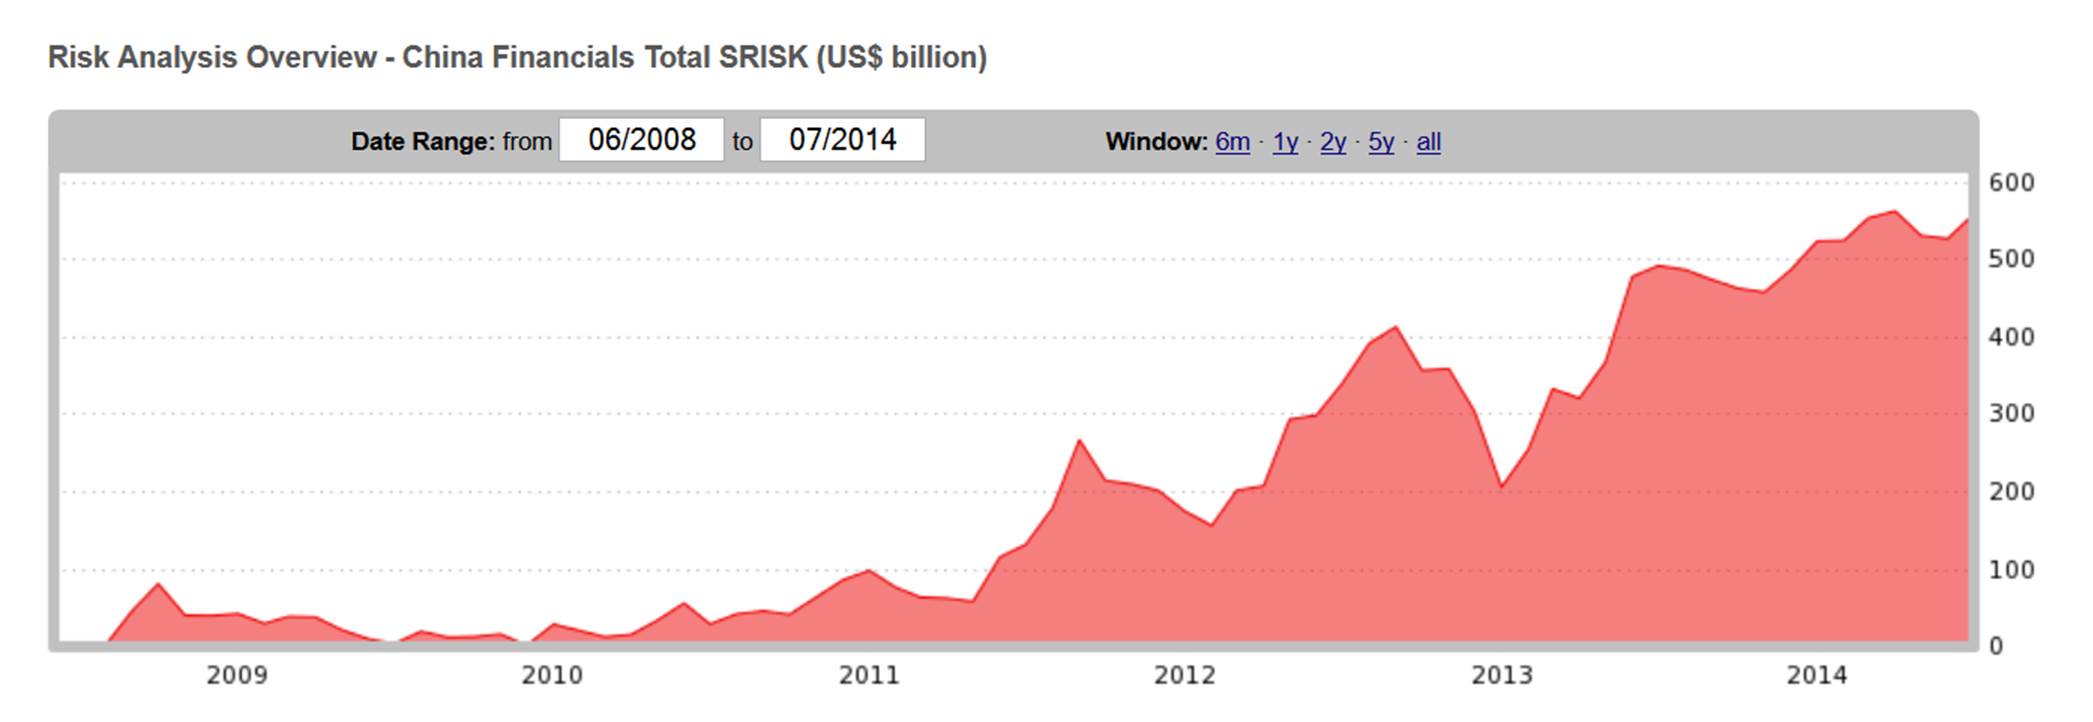
Source: V-lab.
It’s not surprising given China’s “growth-at-any-cost” policy.
I stated before: What the Chinese do best is corruption, crony capitalism, misallocate resources, cause negative externalities, prevent creativity, create inefficiency, and export much of its GDP.
China’s recent bond default is interesting:
“China experienced its first bond default in over 15 years when Chaori Solar, a small privately owned solar panelmaker, failed to pay the interest on Rmb1billion (US$163 million) worth of bonds issued two years ago.”
http://www.blogcastalia.com/chinese-shadow-banking-market-recognition-of-systemic-risk-and-a-real-impact-on-the-shipping-markets/
Thank you, Professor Hamilton…Very interesting indeed.
I will have to take a close look and see if it would helf my
stock investment.
The Red China short (EXP) has recently collapse from the 65
dollar level to 50 bucks..
I can not explain the decline.
Interesting figures. Global risk exposure was increased by the Fed and the ECB. But the exposure was distributed to Japan and China (and most likely oil and other East Asia countries). Risk goes with return. Hence Japan’s stellar equity performance and China’s eye-popping housing performance. This is a free world. Some countries love to take risk to grow their economy, fine. Just make sure you have the ability to clean up the mess.
Does it matter that China’s current peak value (~550) is only a little higher than Japan’s current value (~500) and about half of Europe’s (~1200), though nearly double that of the US (~300)?
I think the key issue is the value relative to the size of the respective economy.
using CIA world fact book GDP data and calculating risk per dollar of GDP, Japan is much worse,
country GDP Risk Risk/GDP
eu 15.85 1200 75.7097791798
japan 4.729 500 105.7305984352
us 13.39 300 22.4047796863
china 16.72 550 32.8947368421
Oops, try again. Looks like a mix of outdated and Ppp.
Professor Hamilton,
Do the values calculated by the Stern school translate into relative currency valuations among countries?
Not really. If the market starts to form an impression that there is a lot of risk, you might see some flight from the currency. The yen and euro might be stronger if people had more confidence that the challenges are going to be resolved. But I wouldn’t think this is a major determinant of currency values in the current environment.
Assuming the Stern metric of risk is a valid one, why wouldn’t the markets also reflect this risk? For example, why don’t the price of Chinese financials reflect the same (rough) trend as the Stern analysis? There seems to be quite a discrepancy between the markets and Stern (I’m assuming this given your comment “that those Chinese financials are quite vulnerable to a downturn”). Are markets not “efficient” in the sense that they don’t have the same information as Stern does (hard to believe, given that Stern shares its analyses with everyone)? Does Stern know something everyone else does not?
The index is not forecasting this will happen. Instead it is one measure of the extent of problems for the financial sector if there was a broad market decline of 40%.
@Vivian: The markets perceived riskiness of each individual security is actually a key input to our model. To reiterate Professor Hamilton’s comments — a common misconception is that our SRISK measures are somehow a probability measure (i.e. those firms/countries at the top of our list represent those firms who we think will fail in a crisis or whose failure is somehow imminent). Note that Lehman wasn’t on the top of our list when it failed and firms such as Bank of America (BAC) and JP Morgan (JPM) have been at the top of our list for quite some time. But we do not imply in our measures that these firms will fail — merely that their failure would have a greater impact to the financial system should they fail, as well as a measure of how much their failure would impact the system (in fact, our aggregate SRISK measures have correlated very well with the size of previous bail-out packages during past crises).
Instead of being viewed as a probability measure, these figures are meant to measure the impact of a firm’s failure on the system as a whole, should they fail. Ironically, being at the top of our SRISK measure doesn’t mean the firm will fail, but perhaps that their failure would cause such harm that they could be deemed “too big to fail.”
Lastly, in terms of the validity of our measure — these figures are calculated using very top-level balance sheet and market measures, calculated automatically each week. Though previous research studies have attempted to measure the correlation between SRISK and other more in-depth measures of stress (see one such paper here), and found a relatively high (though not perfect) correlation, these measures are not meant as a substitute for a more thorough analysis, but instead, perhaps a means of figuring out where to focus efforts of more thorough investigation.
Thanks for this. I had not noticed this response before my follow-up below to your other comment.
Has something happened since your post to lower the systemic risk in China’s financial sector? I just went to V-lab to reproduce that chart, but the latest measure of risk appears to have fallen back closer to 500.
Hmm, that’s interesting. The screen shot was just taken on Friday. I wonder if they added some updated balance-sheet data today that led to a revision of the index.
I guess this might be a good place to ask a follow-up question:
Is it possible the markets know something(s) that the Stern risk analysis metric does not? I’m not trying to be sarcastic, I just am trying to understand the apparent disconnect between Stern and the markets.
The market may know that the Chinese Government controls or coordinates all aspects of that country’s finances. An issuer of sovereign currency and holder of $4 trillion in foreign exchange, it has the authority and tools to respond rapidly and effectively to imbalances, as we saw during the GFC.
On top of that, its real economy is growing 7.5% annually and it commands the trust and support of 80% of its people (Pew, Edelman).
No other currency issuer – including the USA – is in such a strong a position.
@Vivian: It would be particularly distressing if there was a disconnect between markets and our measures, as we use the market as an input to our model. However, perhaps the apparent disconnect lies in the fact that our measures are calculated assuming that we are in the midst of a financial crisis and we currently are not in a crisis. Consider the apparent disconnect between the market and our measures before the GFC. It is not until a crisis occurs that these figures are fully realized (and, given government bailouts and other interventions, they may not be realized at all). However, there is some benefit, I think, in knowing what they are (approximately) before being in the midst of the crisis.
Thanks for your response. I guess I’m trying conceptually to get my head around what it means to measure risk “assuming there is a financial crisis”. There must be some correlation between financial risk assuming there is no crisis and financial risk assuming there is one. Stated otherwise, the degree of risk must also be an input into whether there is a crisis in the first place, so I’m thinking there is some circularity involved here.
Financial reporter: I asked your question to the staff at V-lab. The answer is the model gets updated each week, with Saturday’s new calculations coming after I’d prepared this post. It seems that within the last week there were big gains in China financial equities which helped bring the index down.
Thanks. That makes sense given the big rally recently.
I’m baffled. Why exactly are financial companies’ equity valuations thought to be so crucial? Are bank equity valuations being taken as a proxy for bank asset quality? That would be strange. I’m left wondering if these indicators are any better than or even as good as ratios of bank assets to GDP.
@Tom: We do believe that markets provide information about the quality of a firm’s assets. Perhaps consider the opposite point of view — do markets provide no information? Perhaps there are other proxies for asset quality that one could prefer over market values, but I would submit that a key value derived from markets is the ability to extract such information.
We do not, however, claim that out measures are a substitute for more in-depth research. Perhaps consider different models and methods of research along a continuum of information derived vs. time commitment required. Our measures provide a level of detail that one would expect from an analysis which uses top-level balance sheet and market data and can be automated to run on a frequent basis. In my opinion, I believe that we would provide more value than a simple ratio of assets / GDP, but perhaps there could be more value derived from performing a more in-depth analysis, such as a full-fledged stress test. Indeed, though our measures show a high correlation with past stress tests, it is not a perfect correlation. The difference, perhaps, reflects the added value as a result of the intense time commitment required to derive these figures.
Rather than a substitute for more in-depth research, I believe that we provide a means to augment research and allow researchers to focus their efforts where they can realize the most payoff for their time commitment.
Thanks for the thoughtful reply. Fair points. I definitely agree that some bank equity valuation moves result from changed perceptions of asset quality, and some persistent international differences in bank equity valuations are related to differing asset quality. I think though that bank equity valuation moves have so many other causes that they are more often unrelated than related to changing vulnerability. So perhaps over the long run, your indicator could be somewhat better than bank assets / GDP, if the related-to-asset-quality portion of the equity value info isn’t outweighed by the variance of the unrelated portion. In the short run, though, the likelihood that any given move in bank equity valuations would reflect improvement or worsening of vulnerability seems rather low.
Tom: Part of the idea is that bank equity evaluations should be a leading indicator of how much trouble the market thinks financial institutions might be in. The idea is to compare that valuation with the liabilities that they have on the books. It’s far from a perfect measure, obviously, but it has the advantage that it’s straightforward to calculate objectively and update.
I don’t believe many of the numbers coming out of China. In China, they have a saying, “Numbers make leaders”, and a related joke, “Leaders make numbers.” I think they are incredibly corrupt and inefficient.
On the other hand, they are building a nation by following Friedrich List’s early 19th century playbook, the same playbook that built the US and German economies. It’s a combination of protectionism, government subsidies, government initiatives, limited enforcement of intellectual property rights and so on. To be honest, it is the only playbook to industrialization that has ever worked, at least on this planet. Needless to say, the opportunities for corruption are obvious, but there is honest corruption and dishonest corruption. With honest corruption, the graft gets spread around. The big fish gets the big payoff, but every ward healer gets a chunk and passes bites out to the little guys. More importantly, something of value gets built or installed. The Romans rebelled against their corrupt Tarquin overlords who taxed them for build the Cloaca Maximus, but that sewage channel is still in use today. The US has plenty of corruption, but it tends to be the dishonest kind where the money goes to a small cabal and nothing useful gets built with it.
Given how far China has come over the past two or three decades, I think we’ve been seeing a lot of honest corruption. That New York Times article on the Chinese cold chain was impressive. 95% of the rapidly expanding urban population has a refrigerator. That’s pretty amazing. They are shifting their entire food chain. There progress in solar power is equally impressive. Supposedly some functionary told the politburo that the cost of solar power goes down 20% each time the installed manufacturing base doubles, but it would be expensive to test the idea. “How much?”, asked the bureaucrat. “Ten billion dollars”, said the functionary. After the laughter died down they told the poor guy to pick up the money at petty cash on his way out.
I’m not idealizing the Chinese, but they are doing just what we did, and Japan did, and Germany did, and France did, and even England did, and they seem to be getting same results.
Supposedly, Adam Smith won the big development debate, but Friedrich List still seems surprisingly relevant. Is there financial risk? Sure. But, would you have invested in the US in the 1870s?
The U.S. didn’t keep building more empty buildings, vast excess industrial capacity (e.g. in factories, steel, cement, etc.), and exceedingly too much infrastructure (including shipyards, airports, and even entire cities).
The U.S. capitalist system, and banking system, was based on normal returns on investment rather than credit expansion making up for diminishing returns on investment.
World’s biggest mall a China ‘ghost town’
March 10, 2013
They built it, but the shoppers didn’t come.
New South China Mall in Guangdong Province opened in 2005. With 5 million square feet of shopping area, the mall can accommodate 2,350 stores, making it the largest shopping center in the world in terms of leasable space — more than twice the size of Mall of America.
Only problem is, the mall is virtually deserted. Despite the bombastic design and grand plans, only a handful of stores are occupied. “Most of it empty, with little consumer traffic and a high vacancy rate,”
Part of the problem is location. Dongguan is a factory town and most of its almost 10 million inhabitants are migrant workers struggling to make ends meet. “People coming here to work in factories don’t have the time or the money for shopping or the rollercoaster.”
“To me, many of these projects are a result of easy access to capital and a combination of wishful thinking and speculative behavior rather than rational business calculations,” said Victor Teo, assistant professor at the University of Hong Kong.
“This mall is not the only one that is like that. Elsewhere in China there is the phenomenon of ‘Ghost Towns’, that is to say infrastructure projects, both residential and commercial, with no takers.”
The credit boom of post-financial crisis stimulus has resulted in a proliferation of empty commercial developments and apartments built on rampant speculation.
“What China did in the stimulus credit boom is create a lot of `ghost cities’: projects without a strong commercial foundation, and projects that didn’t get done,” wrote Jonathan Anderson in a research note.
For all intents and purposes you just took the money and poured it down a black hole,” Anderson wrote. And the Chinese banking system “has surprisingly little trouble absorbing that bad debt.”
In a 2007 relaunch, the mall changed name from “South China Mall” to “New South China Mall, Living City” and a revitalization plan was drawn up. But after the relaunch, neither shoppers nor tenants came.
http://edition.cnn.com/2013/03/03/business/china-worlds-largest-mall/index.html
peak trader
you must also acknowledge us capitalist have screwed up more than once as well. as recently as a few years ago, there were empty high rise towers in miami. while they are full today, they were not a few years ago. busted investments occur all the time. at some point the chinese infrastructure will also be populated as well-they will not sit empty for their lifetime. one person’s bust eventually becomes another persons bargain.
Weren’t we saying a decade ago we couldn’t press China too much on currency manipulation because they needed time to stabilize their financial system? Doesn’t look too good of a decision now.
How does the government’s 67% to 83% ownership of China’s big four banks factor into this? Doesn’t it make questions of solvency moot?