I am a little slow responding to the stunning revision to the first-quarter GDP estimates that came out two weeks ago, but here are my thoughts about the new estimates.
The Bureau of Economic Analysis announced on June 25 that U.S. real GDP fell at a 2.9% annual rate during the first quarter, compared with an initial estimate of 0.1% growth for the quarter that the BEA had initially put out in April. The revision sets a couple of records. For one, it makes 2014:Q1 the worst quarter for GDP since World War II that was not part of an economic recession. The next closest contenders were a drop of almost 2.9% in the second quarter of 1981 and a 2.2% drop in the third quarter of 1973. Each of those was followed by a single quarter of solid GDP growth after which the economy fell into a full-blown recession, constituting some of the evidence behind Jeremy Nalewaik’s claim that the economy often reaches a stall speed just before falling into a recession.
A second record was noted by the White House’s Council of Economic Advisors Chair Jason Furman:
the estimates of GDP growth for 2014:Q1 represent the largest revision from an advance estimate to a third estimate, as well as the largest revision from a second estimate to a third estimate, in the roughly thirty years the Bureau of Economic Analysis has done these estimates.
The biggest single source of discrepancy from the earlier estimates came in health care services, which account for 1/6 of total personal consumption expenditures. Last month the BEA had claimed that health care added 1 percentage point to the Q1 GDP growth rate, whereas the new estimate is that it instead subtracted 0.2 percentage points. Jason Furman explains that the main survey that the BEA uses to track health care spending was not available until this month, and hence there was considerable guesswork in the original estimate. MFR’s Joshua Shapiro nevertheless opines:
This is a crazy-sized revision, and speaks very loudly to the fact that nobody has a real handle on how the introduction of Obamacare has affected these data, nor for how long the distortions may last until things settle down.
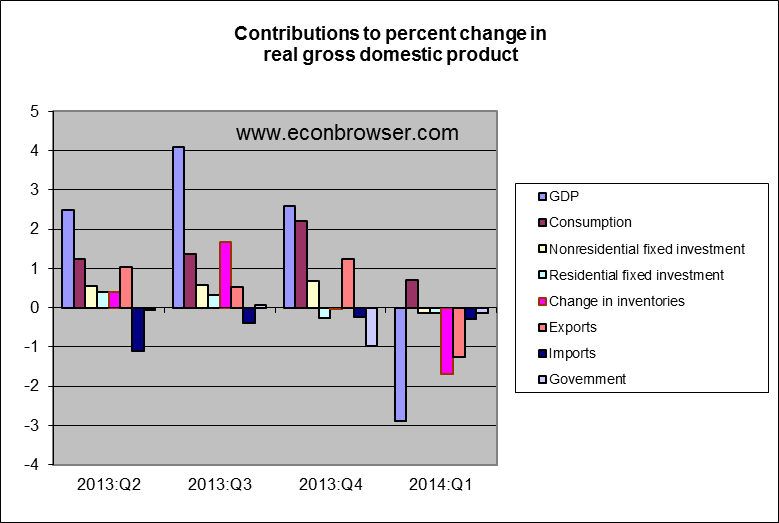
The second most important factor in the revision is that the Q1 deterioration of exports is now seen as even worse than originally reported, with lower exports subtracting 1.2 percentage points from the GDP growth rate. Part of this may be payback for unusually strong export numbers for 2013:Q4. But if it signals a weakening in China or other key trading partners it could be more worrisome.
Jason Furman makes a convincing case that some of the other weaknesses in the U.S. first-quarter GDP numbers represent a temporary effect of the unusually severe winter in much of the U.S., as evidenced for example in the March rebound from the January-February dip down in indicators such as light vehicle sales, core retail and food sales, and core capital goods shipments.
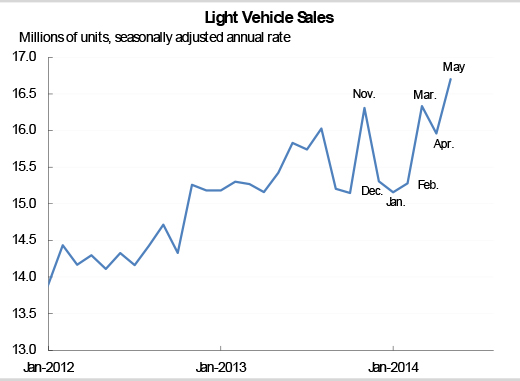
Source: Council of Economic Advisers.
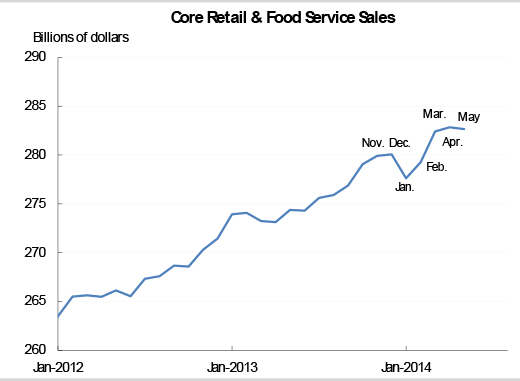
Source: Council of Economic Advisers.
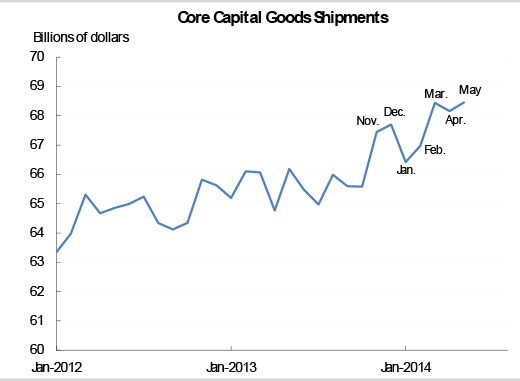
Source: Council of Economic Advisers.
The June BLS employment report ([1], [2]) gave added confirmation that the economy was back to more solid growth for Q2.
So 2014:Q1 does not mark the beginning of a new recession. As for whether it could turn out to be a replay of 1981:Q2 or 1973:Q3, we’ll have to wait and see.
Let me make the same comment I made over at SS’s place:
If the BEA cannot bring their prelim GDP numbers with 0.3 percentage points, then they need to either to
I) Stop issuing prelim GDP data
II) Fix their reporting systems pronto
III) Change management
If a premlim GDP number is off by 3 percentage points of GDP, why should I have any confidence in the revised -2.9% number?
As Menzie has pointed out a number of times, it doesn’t help when some extreme “know nothing” elements of the GOP don’t think government statistics are worth collecting and decide it would be a good idea to reduce data gathering abilities…and then throw in the occasional furlough to boot. For example, try visiting some of the productivity tables maintained by the BEA and BLS and you’ll find a pathetic note telling you that budget cuts killed collection of this or that data set, so it’s been discontinued. And reducing sample size doesn’t help the household survey numbers. And paying government economists enough money that they stick around for awhile might be a good idea as well. Entry level salaries for an economist (GS-0110-09) with either a Master’s degree or a law degree (J.D. or LL.B), and at least one year of experience is $52,390, with a maximum salary at the end of your career 40 years later of $98,764.
slugs, one needs to add in the comparatively generous benefits, e.g., medical, pension, child care, maternity leave, employee discounts, difficulty being fired, etc., to arrive at a total compensation package most employees or self-employed in the private sector could only dream of securing, unless they are senior management, of course.
Steve Kopits: Gee, I wonder why we don’t devote more resources to data collection. Here is a partial answer. And who is at the forefront? Here is more of the answer (as you know).
Menzie –
My devotion to data collection has never been in question. Whether Republicans or Democrats, I strongly believe that we need good statistics. As I have stated before, the primary obligation of government is to provide for sustainable prosperity for the country as a whole. You can’t do that without good data. We can debate what portion of this should be conducted by the private sector, but there is no more macro data than GDP data. As I state above, BEA either needs to stop issuing preliminary data if it cannot assure its reasonable quality; or it needs to improve data collection; and/or it needs to find management that can execute this.
So if you think this is important, well, post on it; or invite the respect folks from BEA to tell us what’s wrong and what needs to be fixed.
Originally, the preliminary GDP estimate was an internal number not to be released to the public.
But during the month from the prelim to the first estimate it was leaked so badely that they decided to go public with it.
Probably a mistake. Probably would have been better to eliminate it.
That was actually the “flash” estimate that was available shortly before the end of the reference quarter. So, for example, the flash estimate of GDP for the first quarter was available sometime the last week of March. That was eliminated several decades ago, IIRC.
The advance estimate is released about 30 days after the end of the reference quarter. Many assumptions are needed due to missing source data. It’s quite surprising to have such a large revision between the second and third estimates, when fewer assumptions are needed.
It’s a dismal expansion from the June 2009 trough. We’ve added $5 trillion of additional federal debt for this “recovery.”
The $700 billion in TARP by the Bush Administration was almost or entirely paid back, with interest, under the Obama Administration. So, those huge Obama budget deficits would’ve been even worse without the TARP repayments.
Moreover, the recovery is actually weaker than reflected in GDP growth, because trade deficits shrunk substantially as a percent of GDP, which adds to GDP growth.
U.S. real GDP growth was 1.9% last year and the forecast for this year is around 2%.
UCLA Anderson Forecast: U.S. economy falls short of true recovery
June 05, 2013
“U.S. real GDP is now 15.4 percent below the normal 3 percent trend. To get back to that 3 percent trend, we would need 4 percent growth for 15 years, 5 percent growth for eight years, or 6 percent growth for five years, not the disappointing twos and threes we have been racking up recently, which are moving us farther from trend, not closer to it. It’s not a recovery. It’s not even normal growth. It’s bad.”
trade is going to hit the 2nd quarter too…currently, the average of the April and May trade deficit is 10.8% higher than the average first quarter trade deficit and is on track to subtract roughly 1.09% from second quarter GDP if the deflator stays the same… also, April and May real PCE are pointing to QoQ growth at less than a 2% rate
rjs, how do net export data net against inventories so far q-q annualized? What will be the net addition/subtraction from net exports plus inventories?
Using the data series used by the NBER through May with employment for June, the q-q annualized estimate for Q2 real final sales looks like 2-2.2% and 1.5% yoy (1.3-1.5% and 0.8% yoy per capita).
However, using employed age 25-54 and core retail sales (higher R^2 than non-farm employment and real final sales, including autos), q-q annualized real final sales are closer to 1% and 1.2% yoy (0.3% and 0.5% per capita).
The 1% q-q annualized rate conforms to the aggregate of the 0.75% annualized rate of employed 25-54 and real wages and salaries less debt service that are barely growing for Q2 through May with the acceleration of CPI for Apr-May at a 3.7% rate and 2.5% YTD from the 2013 yoy rate of 1.5%.
Thus, q-q annualized growth of real income less debt service for Q2 appears particularly weak, if even growing at all.
In either case, the current 4-qtr. average rate of real final sales per capita is at no faster than the historical stall speed since Q3-Q4 2013.
I suspect that most of the self-satisfied top 1-10% of US households, including many economists, are unaware of just how weak real incomes are for the bottom 90% and how the lack of growth of after-tax real incomes (primarily wages, of course) for the bottom 90% is a permanent structural constraint on acceleration of growth of US economic activity. $105-$115 oil and $4 gasoline only exacerbates conditions for the bottom 90%.
All reported net employment gains since 2007-08 have occurred for peak Boomers, age 55+, if one is to believe the data, growing at multiples to real final sales. The q-q annualized rate of growth of employment for 55+ is 5% vs. 0.6% for age 25-54, the latter group having a much higher correlation to growth of real GDP/final sales, not surprisingly.
Total employment less age 55+ is at the level of summer of 1997.
The average annualized growth of real final sales per capita since 2007-08 is near 0% and ~0.3% for real GDP per capita (including inventories). The per capita growth rates for real final sales and GDP since 2009 have averaged ~1% or slightly slower (half the long-term average), which in turn is the average rate since 2000.
Thus, owing to demographic drag effects, including no growth of the labor force and no acceleration of productivity (falling labor share is reducing the rate of demand and thus the rate of growth of labor capitalization/investment), the US (and Japan and EZ’s) economy’s post-2007 average “speed limit”, if you will, is 0% for real final sales per capita and 0.2-0.3% for real GDP per capita.
This further implies that the post-2007 average nominal GDP rate of 2.5% and 1.8% per capita is the nominal speed limit.
Moreover, with per capita disposable personal income less transfers averaging 1.3% since 2008, 0% to slightly negative less the deflator, and no growth less the deflator for the past 2 years, the US economy cannot withstand an acceleration of price inflation beyond ~1.5-2% without suffering further loss of real purchasing power per capita and the ongoing risk of stall speed and q-q annualized contraction of real economic activity. The persistence of the price of oil above $40-$50 ensures that the net exergetic flow constraint on growth will remain.
During a debt-deflationary regime with demographic drag effects, excessive debt to wages and GDP, and now energy cost constraints to real final sales per capita, the Fed’s targeting of 2% price inflation (or faster?) is misguided and only adds to the structural constraints to growth of real purchasing power and thus for growth of real final sales per capita.
As PeakTrader relates, rather than a typical US business cycle expansion, the period since 2009 has effectively been a “recovery” from a Great Depression-like contraction and subsequent loss of growth of real GDP per capita since 2000 and 2008. In fact, since 2000, the US has lost an equivalent of 14-15% of real GDP per capita growth that otherwise would have occurred had the long-term trend rate of growth continued after 2000.
However, since 2008, the rate of growth of real GDP per capita has decelerated to near 0%, resulting in a loss of growth of 10% since 2008.
At the secular trend of deceleration of real GDP per capita growth since 2000 and 2008, the US will have lost 25% of growth of real GDP per capita by 2020, which is similar to the loss of real GDP per capita that occurred in 1929-33, although all at once, and for Japan since 1990, and worthy of the term “slow-motion depression”.
Again, the post-2007 “speed limit” for the US economy is per capita real final sales of 0% and 0.2-0.3% for real GDP (~1% average trough-to-peak cyclical rate). The recent oil-related acceleration of price inflation YTD risks further deceleration of yoy growth of real final sales per capita and q-q annualized contraction.
But we’re constantly told that “we’re not Japan” or “Old Europe”, even as the evidence mounts and can no longer be ignored that the US and EZ are tracking Japan’s “slow-motion depression” trajectory (and that of the 1830s-40s, 1880s-90s, and 1930s-40s) remarkably closely since 2000 and 2008.
On the subject of Q1 GDP, inventories, energy, and an outlier winter. Inventories of natural gas (in particular) and coal dropped precipitously during the first quarter. Has anyone taken a look at quantifying the net impact on GDP stats? I can see the change in inventories, but don’t have a detailed understanding of how this is accounted for in other parts of the economy, for instance utility sales. I can see that household expenditures on utilities increased dramatically, but I don’t have a detailed understanding of how the GDP accounting balances, to pinpoint the net impact over all phases of the supply and consumption chain.
My basic thought is that in addition to economic activity being depressed directly by the weather, and stockpiles of energy being consumed without replacement, you also had household consumption on energy spike, and take money out of pockets which reduced PCE on other items.
End of a gas glut? Prices paid by electric utilities for natural gas in February reached the highest level since the plunge in 3Q 2008. Storage reached the lowest levels in late March (at the seasonal low) since 2003. Seasonal storage lows in 2012 were the highest in decades. Seasonal storage lows in 2013 were higher than any other year since 2006, but fairly normal.
Right but a bit of a cop out at the end. This doesn’t look anything like pre recession stall speed. Surely there’s no sugn that either exports or health care are dropping that much. Financial markets aren’t signaling anything. This looks more like mid cycle than late.
As for the size of the adjustment being a big embarrassment – well, the health care part was. It’s not true that nobody knew. Someone needed to spend less time with models and more time researching. Fire an economist and hire a journalist, or fire an introvert model wonk economist and hire an economist who can use the phone. I think exports were a legitimate surprise.
@ben – Fuel inventory declines were driven by harsh winter demand, not by any drop in consumption. So no real impact on GDP. In production side accounting you see no change, in expenditure side you see higher consumption offset by falling inventories. However restocking will add to subsequent quarters’ GDP.
The acceleration in the price of oil yoy, YTD, and q-q at the current oil consumption to GDP is clearly contributing to the YTD acceleration of CPI (and contraction of real earnings and wages) and will probably take a 1-1.2% bite out of annualized GDP for Q2.
When the economy is growing at 2-2.5% real per capita, a similar oil bite we’re now experiencing is less likely to sink the economy, at least not immediately.
However, when real per capita GDP is less than 1% as we have today, we’re experiencing what historically would constitute an “oil shock”, which I suspect means that we’re closer to stall speed and recession than the vast majority of economists assume.
“The biggest single source of discrepancy from the earlier estimates came in health care services.”
The top 20% of income earners are likely doing well, while the other 80% seem to be struggling.
Deductables with the mandatory insurance premiums may be reducing demand for health care.
Much of the “middle class” either don’t qualify for a subsidy or receive a tax credit that covers a small percentage of the premium.
For example, according to Kaiser, if you’re single, 30 years old, earn $35,000 a year, with no employer coverage available, and don’t smoke, your health care premium for 2014 is $2,877 for the Silver plan, or $2,385 for the Bronze plan (of course, the Gold plan would be more), and receive no tax credit subsidy. The out-of-pocket maximum for a Silver plan (not including the premium) can be no more than $6,350.
Also, “Do not mess around. Pay your premium,” admonishes Karen Pollitz, a consumer specialist at the Kaiser Family Foundation. “Otherwise that will be the end of you and you won’t get to sign up again until the next open season.”
Even underpaying the premium by a few cents could give the insurance company grounds to kick you off, she said. Insurers allow a brief grace period if you get behind — somewhat longer if you’re receiving premium subsidies — but they will terminate coverage for nonpayment.
The health law says that, once you join a qualified plan, you won’t pay more out of pocket per year than $6,350 for an individual and $12,700 for a family. But this applies only to in-network care. Whether you’re in an HMO that pays almost no out-of-network benefits or a PPO that covers some, the pocketbook protections don’t apply if you use a non-network doc or hospital.
Peak, appalling, yes? The gov’t-sponsored and -protected mandate to enrich the insurers is a classic example of a corporate-statist cartel and a huge incremental tax on young people who are already struggling to subsist.
Note that 50% of for-profit “health care” (HC), i.e., “disease care”, is spent on the sickest 5% and 65% of spending is on the sickest 10%, most of whom are middle age or older, obese, have unhealthy diets, are smokers or have smoked, and who are sedentary, with a disproportionately larger share being women.
Moreover, 20% is spent on obscenely costly late-life procedures, treatments, and hospital stays for the terminally ill and dying elderly. That leaves the proportionally small remainder of HC spending for prevention, routine follow-up, and education services for the healthy, healthier, or non-elderly 70% to 80-90%.
Finally, combined total local, state, and federal gov’t spending (including public HC), debt service (“rentier taxes”), and private HC spending is an equivalent of 50% of US GDP. Therefore, the US economy cannot grow unless gov’t, private debt, and HC grow; however, with these sectors at 50% or more of GDP, this spending cannot grow if the economy cannot grow, i.e., catch-22.
A similar situation exists in the Eurozone (EZ), with 52% of GDP being gov’t spending, but the Europeans tax for public HC and generally have less private household debt to incomes and GDP (with notable exceptions, to be sure). Still, as in the case of the US, without growth of gov’t spending, including public HC, the EZ can’t grow, but the EZ can’t grow because gov’t spending is now over 50% of GDP.
Put differently, for the US economy to grow, we need a growing number of the ill, elderly dying, and debtors, but the incomes of the bottom 90-99% after taxes, debt service, and HC costs cannot support more debt, costly illness, and aging and dying.
Yet, most economists, and the likes of the IMF’s Lagarde, argue for spending SPEND MORE ON HC.
BC,
you fail to grasp the issues of health care. you basically advocate to quit spending health care money on the old and sick, and spend it on the healthy! think about that for a minute, you want to spend health care money on the people who do not need it! healthcare is NOT a typical consumable, which is why it also does not operate very well in a free market capitalist system. other than the few free market ideologues, most people understand you can not conduct consumer price discovery while having a heart attack or broken leg. even treatment for something as simple as high cholesterol does not lend itself to free market price discovery. think about it, after getting a blood test which indicates high cholesterol, are you going to call three different doctors, make appointments and visit them, and then choose the most economical treatment method offered by the group of doctors? you need to understand health care is NOT an EFFICIENT MARKET.
I understand it very well. I have family members in the medical profession, as well as friends and acquaintances in the insurance racket.
The system should be segmented between healthy people who pay very little for “insurance” and who make decisions to remain healthy and NOT consume “health care”.
What we call “health care” is actually costly profitable “disease care” for the sickest 5-10%, most of whom have created their conditions from lifestyle choices, including those conditioned by socioeconomics, “education”, advertising, and so on. Healthy people (and their employers) who do not NEED costly medical services should not be paying for it so that doctors, clinics, hospitals, biomedical and pharma companies, and insurers can profit from ignorance about health and from illness and death.
Healthy people should have access to low-premium insurance with a relatively high deductible for costly services, whereas they pay out of pocket for affordable routine care.
The sickest 5-10% should be covered by gov’t but rationed on the basis of requirements for healthy lifestyle changes. The gov’t should be encouraged to say, “If you smoke, drink to excess, don’t exercise, maintain an unhealthy diet, are overweight or obese, and expect your healthy fellow Americans to pay through the nose for your bad habits and predictable outcomes, sorry, we’re not paying for your costly procedures, hospital stays, and follow-up care. And, no, you 74 year-old, you can’t have hip and knew replacement that someone else pays for so that the orthopedic surgeon can make $500,000/year.”
The processed, high-fat, salty, sugary, high-glycemic junk subsidized and sold as “food” by agribusiness and large “food” companies should be acknowledged for the debilitating costs the “food” creates for society and gov’t.
No one but the top 0.1-1% can ACTUALLY afford what we refer to as “health care” because the cost of the cartel is not meant to prevent illness but for the top 0.1-1% TO PROFIT FROM IT.
Not only is this BAD ECONOMICS, it’s just plain “unhealthy”, perverse, and wrong.
The US risks being the first country in history to go bankrupt and its economy collapse because we chose to allow the gov’t to subsidize poor health and to encourage profitability from illness and death for a small minority of the population.
In some regions of the country, where the cost of living is high, income of $100,000 a year isn’t much, when you didn’t buy a home, owe student loans, or are saving some money for retirement.
Moreover, it seems, there were more and better sales before the economy peaked in 2007.
Also, the assumption was if people had to buy health care insurance, they’d use health care more. That doesn’t seem to be the case.
Skin problems top Mayo’s list of reasons people visit doctors
01/17/13
“If you’ve sought care from a doctor recently, the odds are you did so because of a skin problem, a joint disorder or back pain.”
http://www.minnpost.com/second-opinion/2013/01/skin-problems-top-mayos-list-reasons-people-visit-doctors
Professor,
I posted this in one of my comments on another thread but it could have been hard to see.
I would really appreciate your analysis contrasting the new GO vs GDP numbers being reported. Many supply side economists and business experts are praising the GO as a step in the right direction.
I am still in the non-commital stage.
REal trade accounted for 1.5 percentage points of the 2.9% drop in real GDP– over half.
If you look at the real monthly trade data released by Census real non-petroleum imports jumped from $151.6 B (2009 $) in December to to $155.1 B (3009 $) in March,or a 9.6% jump (SAAR).
But the surged continued to $157.9 B (3009 $) in May, an 18% annualized gain.
Net petroleum imports rose from 9.2 B in December to $11.3 B in March before falling to $8.9 B in May.
In May petroleum exports were equal to 47.5% of petroleum imports.
I wonder if the surge in non-petroleum imports is importers being in goods early to avoid the anticipated West Coast Dock strikes?
Maybe people are noticing some unpleasant Obamacare arithmetic;
http://www.weeklystandard.com/articles/unfolding-fiscal-disaster_796086.html?page=1
‘CBO currently estimates that the ACA’s coverage provisions will cost the federal government $92 billion a year by FY2015. This is roughly 0.5 percent of projected U.S. economic output for 2015, well exceeding the relative costs of Social Security and Medicaid at similar points in their histories. (The amount falls just short of the proportion of GDP absorbed by all of early Medicare.) Worse, the federal fiscal position was far weaker when the ACA was passed than when Social Security, Medicare, and Medicaid were created.
‘Troubling though the ACA’s startup costs are, they represent only the tip of the fiscal iceberg that will be the fully phased-in law. CBO projects that its annual costs will hit $200 billion by FY2020, or nearly 0.9 percent of GDP. Yet this assumes that lawmakers will be content to allow the ACA’s health insurance subsidies to grow more slowly than low-income beneficiaries’ health care costs, as the law now stipulates. Thus there is every reason to believe that the ACA’s eventual costs will far exceed initial estimates, as happened with Social Security, Medicare, and Medicaid.’
Did you not read the post? The largest revision is a decline, it seems, in healthcare spending. I said it seems because the numbers are iffy but the key word is “decline”.
Yes, and how is that decline calculated? Is it reduced revenue, yet HC costs have gone up dramatically? What were the earlier numbers based on? Perhaps they were based on projected revenues, but those revenues never manifested; meaning that many have not paid for insurance they signed up for, perhaps others rejected the automatic disability retirement that is a part of the ACA, and so they no longer deduct insurance from their disability income, but instead will receive HC from their spouse.
Why not simply delay GNP numbers until all information is available and calculated ?
Sigh.
I guess there is a large industry of folks whose livelihood depends on hot-off-the-press numbers.
I guess nothing will change as long as most folks, including many professional American economists, believe in the power forecasting and top-down fine-tuning of economic growth.
Face it folks. The USA remains a very deeply religious, spiritual and anti-science society.
https://www.youtube.com/watch?v=NY8ig9n9EFY#t=120
http://www.atmos.umd.edu/~ekalnay/pubs/2014-03-18-handy1-paper-draft-safa-motesharrei-rivas-kalnay.pdf
http://www.skil.org/qxtras_folder-2/catton%20paper%20for%20Jack%20Alpert's%20session.pdf
http://skil.org/Qxtras_folder-2/rapidpopdeclineorbust.html
http://www.skil.org/Qxtras_folder-2/overpopulationmeansImurder.html
https://www.youtube.com/watch?v=5uNDhLRzPCQ
https://www.youtube.com/watch?v=FStB5_yT9o4
” Entry level salaries for an economist (GS-0110-09) with either a Master’s degree or a law degree (J.D. or LL.B), and at least one year of experience is $52,390, with a maximum salary at the end of your career 40 years later of $98,764.”
And strangely you forgot to add in the value of their pensions and post retirement benefits (ironically, those benefits that they will never be paid in full as promised)
it’s also hilarious that 2slugs thinks govt economists are underpaid. I’m sure when they post an open position, they probably only get 2-3 resumes because they are so grossly underpaying people.