From the IMF:
Global growth will receive a boost from lower oil prices, which reflect to an important extent higher supply. But this boost is projected to be more than offset by negative factors, including investment weakness as adjustment to diminished expectations about medium-term growth continues in many advanced and emerging market economies.
Here is an excerpt from the update table.
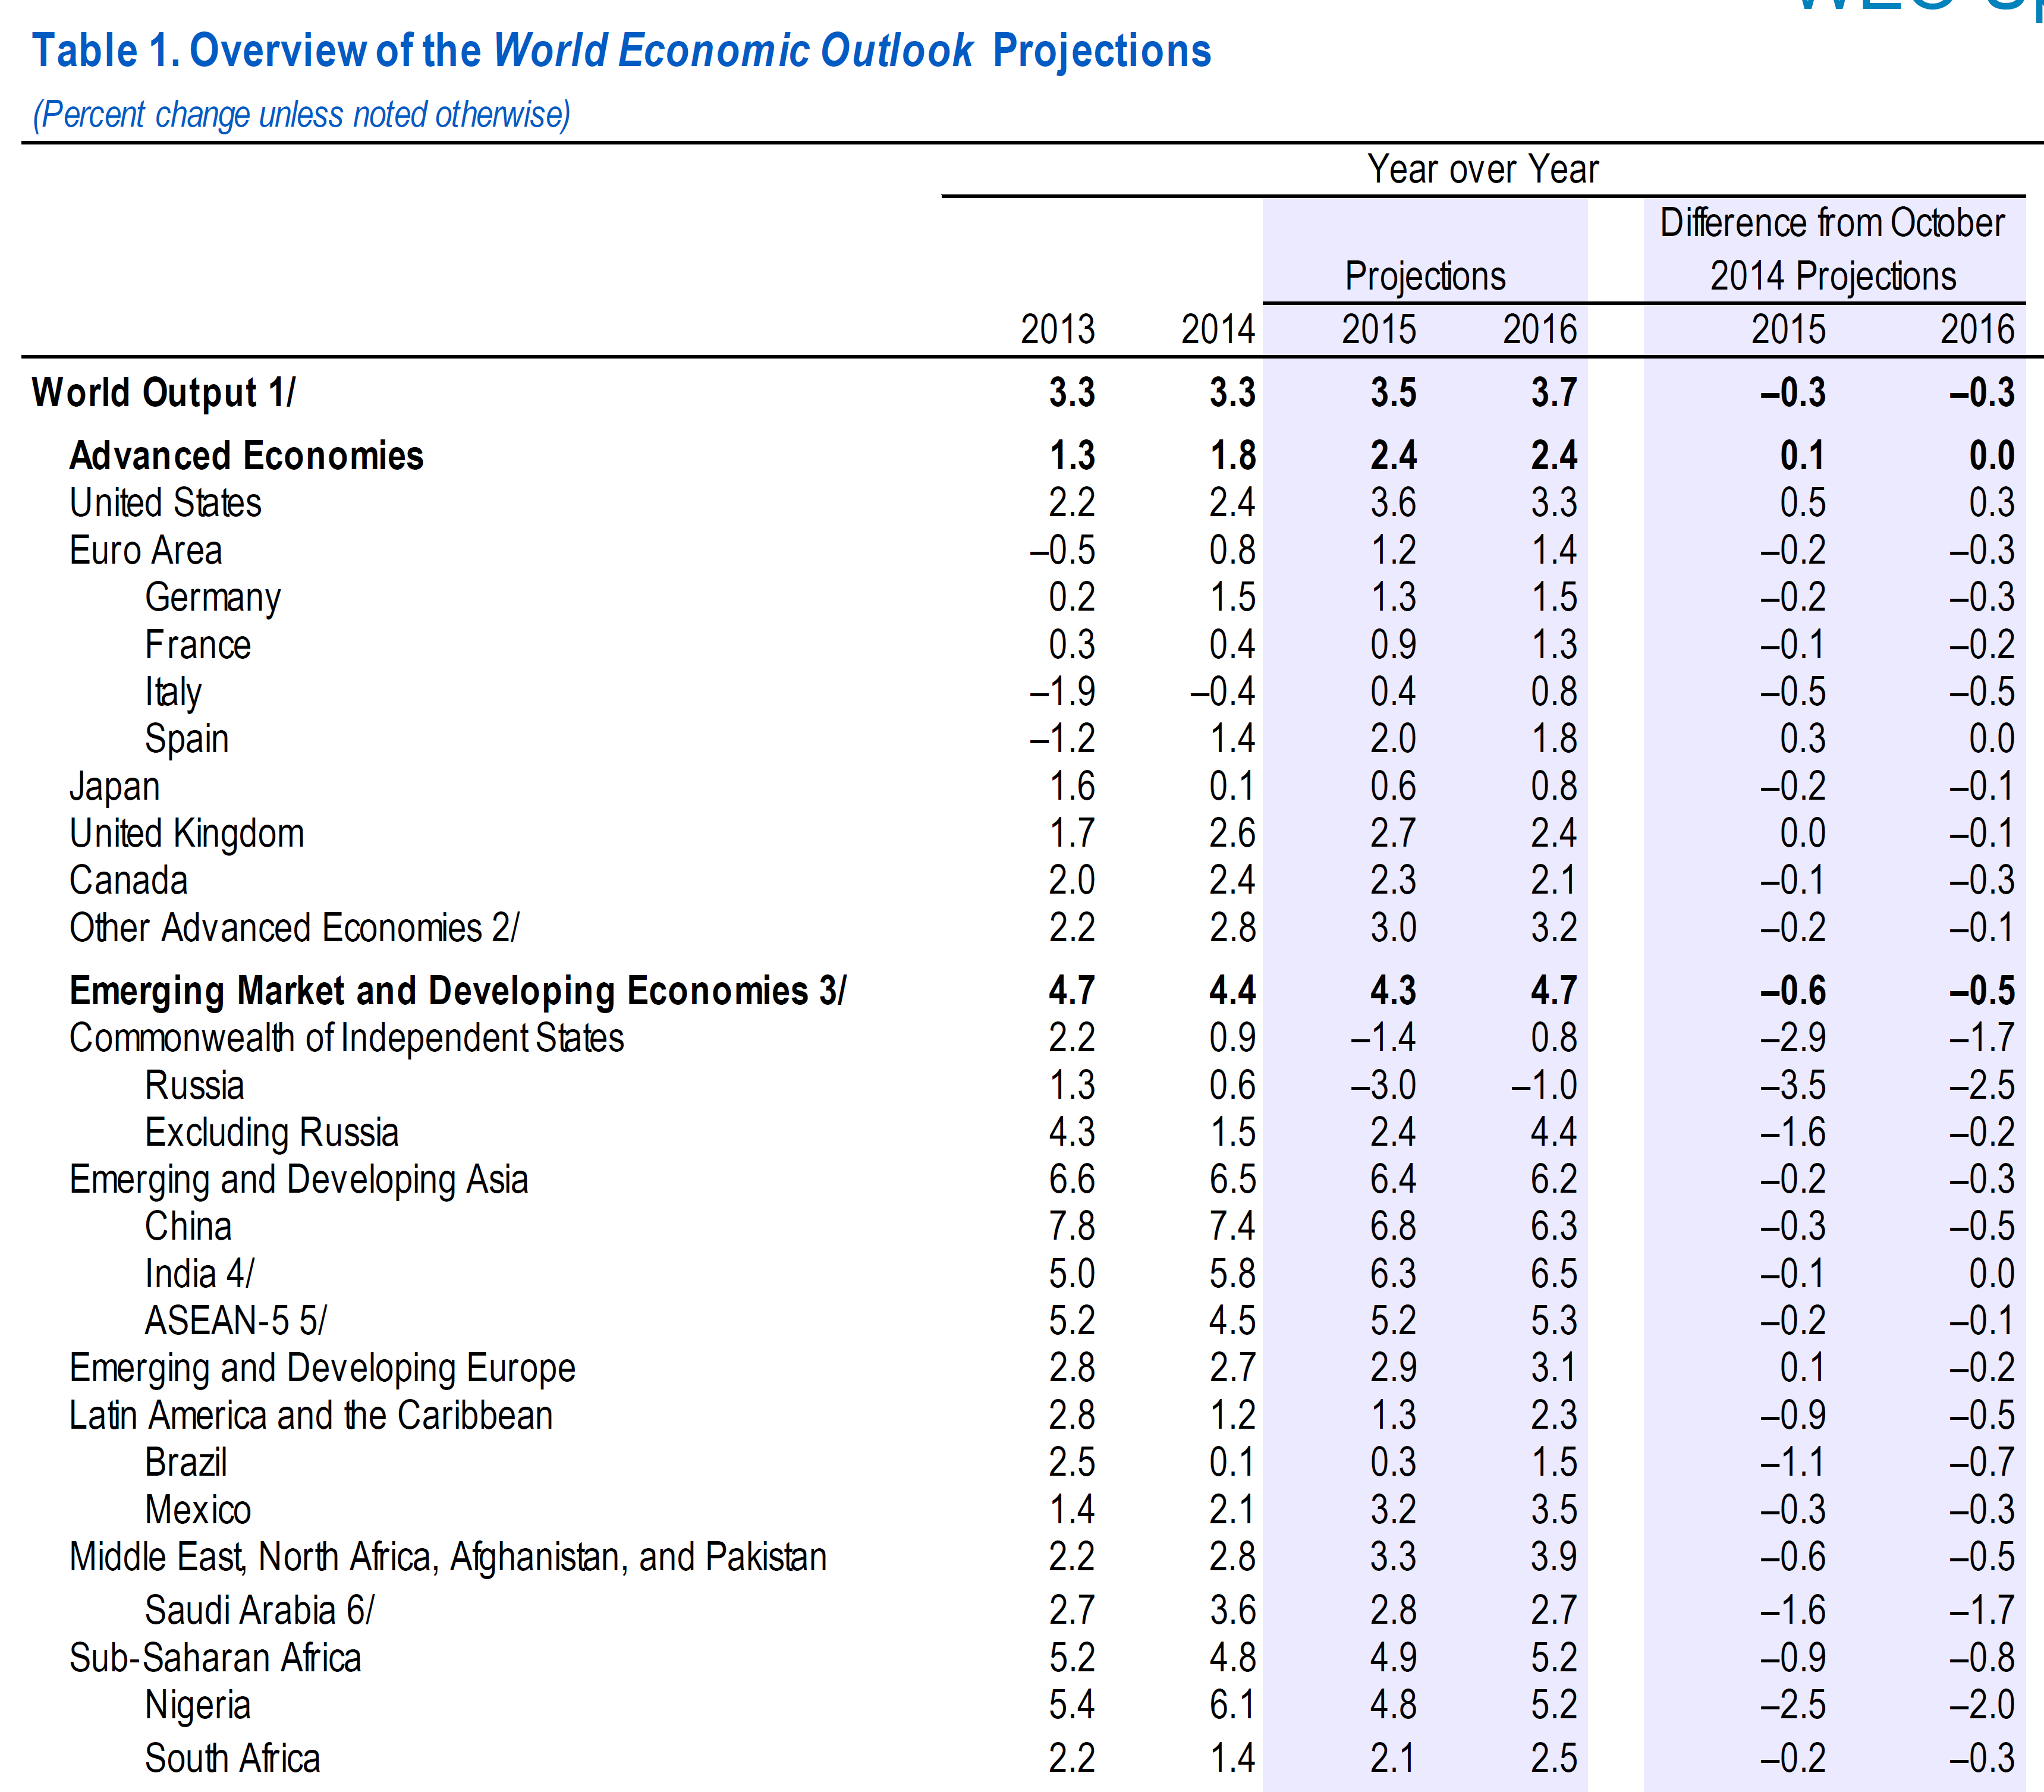
What I find remarkable is the marked deterioration in the prospects for Russia. Year-on-year growth in 2015 and 2016 has been marked down by 3.5 and 2.5 percentage points, respectively, just in the three months since October’s WEO, to -3.0 and -1.0. Growth from 2014Q4 to 2015Q4 is forecasted to be -5.4%. (See this post for discussion of y-o-y vs. 4q/4q growth rates.)
One might speculate that now would be the time to exert maximal leverage via further economic sanctions, should Russia continue to pursue its incursion in eastern Ukraine.
Now some folks (like reader Tom commenting on a similar World Bank forecast) pooh-poohed the magnitude of the implied recession. It’s useful to remind people that the year-on-year drop in the US in 2009 was 2.8%… I think most sensible people think that was a pretty deep recession.
Scott Shellady on CNBC:
We spent over $3 trillion of the balance sheet to buy 2.5 percent growth.
how much of that $3 trillion dollars principal will be returned? any interest as well?
I don’t know, the whole concept is baffling to me!
Overs and Unders
IMF is
– in line with my US GDP forecast
– Too low on France, Italy, Spain, Greece, Portugal, any European country not near Russia. Remember, all of these see GDP up 1% or more just from lower oil prices
– India gets a 2.4% GDP boost from lower oil prices. IMF is too low.
– Asean probably a bit better than shown
– Canada, Brazil, Saudi I think are too high. Low oil prices will bite there.
– Russia is as shown, I think
– Japan. Someone rid me of this meddlesome forecast.
China. Well, China. Xi is running a dead end strategy for that country. Did you see the pictures of the new Chinese fighter aircraft? Just beautiful. Indistinguishable from the American version. Now, whom is China going to threaten with those aircraft? Their customers, or their suppliers?
75% of aggregate world real GDP per capita is at historical stall speed or recession for the YoY and 3-year rates.
The 9-year rate of real GDP per capita is at the lowest rate in the post-WW II era and below the low of the Great Recession.
“Trade” (Anglo-American imperial trade regime) will slow to 0% or negative per capita by the end of the decade.
US exports are not growing YoY.
The bust in the energy and energy-related transport sectors will drag down orders and industrial production hereafter, risking stall speed for the North American economy.
The fiscal deficit to GDP is bottoming and poised to rise in 2015, requiring the Fed to resume QEternity to prevent M3 (less bank cash) from contracting once delinquencies and defaults for bank C&I loans to the energy sector and subprime auto loans begin to rise hereafter.
And the McKinsey boys are already projecting a global slow-down in the long-term http://www.mckinsey.com/insights/growth/can_long-term_global_growth_be_saved
Yes, S@ndy, and here:
http://www.academia.edu/1596854/Real_GDP_per_capita_since_1870
http://tylercowen.com/tag/the-great-stagnation/
http://www.nber.org/papers/w19895
http://www.voxeu.org/article/us-economic-growth-over
http://www.voxeu.org/sites/default/files/Vox_secular_stagnation.pdf
“Limits to Growth” have arrived as a result of Peak Oil (increasing net energy costs of extracting the primary energy source at a price that does not permit growth of 5- and 10-year real final sales per capita); population overshoot (population overrunning the biophysical capacity to sustain the population); too much debt to wages and GDP; resource depletion per capita; falling labor’s share of GDP reducing labor productivity, investment to employee, rate of growth of profits, and capital formation to GDP; peak Boomer demographic drag effects on household formations, housing, and consumer spending; wealth and income inequality; prohibitive fixed costs to incomes and GDP of the mature physical infrastructure; and fiscal constraints set to reduce gov’t spending per capita.
The future for the advanced economies and China is here, and it looks like Japan since the late 1990s and early 2000s.
http://www.econospeak.blogspot.com/2015/01/expect-no-change-in-oil-policy-with.html