I spent the last two weeks in Boston at the NBER Summer Institute where I learned about a lot of interesting new economic research. Here I describe a new paper by Jae Song, David Price, Fatih Guvenen, Nicholas Bloom, and Till von Wachter on the role of firm-specific factors in rising income inequality.
These researchers constructed from administrative records an amazing matched employer-employee data set covering all U.S. firms and individuals for which W-2 income statements were filed over a 30-year period. The data are summarized in terms of wt(s), which denotes the natural log of the real wage earnings in year t (measured in 2012 dollars) of the person who was in the sth income percentile in year t. For example, the median worker in 1982 received w1982(50) = ln($28,000)= 10.24 (in 2012 dollars), while the median worker in 2012 received w2012(50) = ln($33,600) = 10.42. The log difference is 10.42 – 10.24 = 0.18 implying a percent change of approximately 18%. Although the median worker in 1982 was of course not the same individual as the median worker in 2012, one way that rising inequality is often represented is with a plot of w2012(s) – w1982(s) as a function of s as is done in the blue line in the graph below. As just noted, the height of this line is 0.18 at s = 50, but it is much higher than this for people above the 95th percentile. Someone in the 95th percentile today is earning much more than a person who was in the 95th percentile in 1982, whereas someone in the 5th percentile is only earning a little more than their counterpart in 1982. The upward slope in the blue line as s increases, particularly for high values of s, is one indicator people sometimes look at to measure rising inequality.
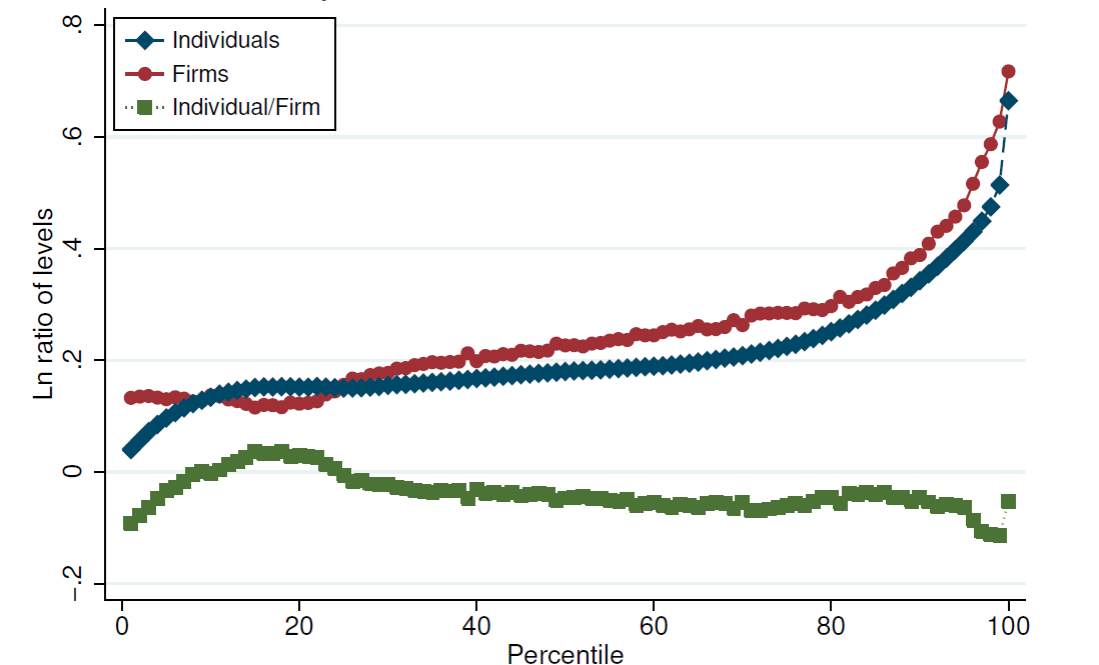
Blue: log change in real wages (vertical axis) of percentile s (horizontal axis) between 1982 and 2012. Green: change attributable to differences between the wage of the individual and the average wage of people working for the same employer as that individual. Red: change attributable to differences between the wages paid by different employers. Source: Song, Price, Guvenen, Bloom and von Wachter (2015).
The authors then looked at how much of this change could be attributed to differences in earnings across people who all work for the same employer. They calculated the difference between wt(s) and the average log earnings of other people who worked for the same employer as did the individual who was in the sth percentile, and examined how those differences changed between 1982 and 2012. This number is represented by the height of the green line in the graph above. It actually slopes down over most of the range. There is a modest contribution to rising inequality of within-firm differences in pay at the very lowest and very highest percentiles, but for the most part differences in pay across individuals working for the same firm have very little to do with rising inequality.
Yet another calculation we could make is look at the average wage of all the people who worked at the same firm in 1982 as did the individual who was in the sth percentile in 1982, and compare that with the average wage of all the people who worked at the same firm as did the individual who was in the sth percentile in 2012. This is plotted as the red line in the graph above. Note that the sum of the heights of the red and green lines equals the height of the blue line for every s by definition. The red line seems to be the whole story. The key question is not whether you’re one of the higher paid people within the establishment for which you’re currently working. The question is instead whether you’re fortunate to be working for one of the establishments that is paying a wage to its average worker that is higher than the average wage at other firms.
The authors conclude:
Contrary to the assertions made by Mishel and Sabadish (2014), Piketty (2013), and others, we find strong evidence that within-firm pay inequality has remained mostly flat over the past three decades…. on average, individuals’ inequality with their coworkers has changed little over the past three decades.
Translation: people are compensated according to their perceived value with a business and businesses, in general, have not changed their compensation philosophies/policies.
In the broader world where businesses compete with other businesses and individuals compete with other individuals, the same dynamic appears to be in play… only with greater extremes due to the greater differences in value individuals bring to the competition than would be likely in a business.
http://www.bls.gov/emp/ep_chart_001.htm
https://docs.google.com/viewer?url=http%3A%2F%2Fwww.census.gov%2Fhhes%2Fsocdemo%2Feducation%2Fdata%2Fcps%2F2014%2FTable%25201-01.xlsx
Now, if Hillary Clinton wants to improve the middle class, it would seem that she needs to convince many more people to bring much more to the table. In addition, a saner immigration policy and enforcement might reduce the undercutting of Americans’ jobs. It wasn’t until some right-wing nutjobs publicized Disney’s plans to replace American IT workers with lower-cost foreign workers brought in on visas that Disney backed down. http://www.latimes.com/business/la-fi-disney-technology-h1b-20150617-story.html This goes against the concept that all people all over the world have a right to come to America regardless of the impact on Americans.
There is an old saying: “Charity begins at home.” It stuck around for a long time because people understood the implications. At least some people did.
That same “right wing” organization has also supported globalism, outsourcing of jobs and rentier finance. They are just playing dialectics. All politics is controlled.
I guess, many people in France, who want to maintain the status quo, don’t understand the benefits of a dynamic and disruptive economy.
Western Europe should’ve been most competitive with the U.S. in the Information and Biotech revolutions.
Instead, the U.S. not only leads the world, in those economic revolutions, it leads the rest of the world combined (in both revenue and profit).
Western Europeans may be unhappy with U.S. market power, particularly given lower income, higher taxes, and more regulations.
In “Growth in the Residential Segregation of Families by Income, 1970-2009,” Western Europe’s class structure today is much like America’s in 1970, i.e. a large proportion of middle class with smaller proportions of upper and lower classes.
In the U.S., the proportion of families living in affluent neighborhoods doubled from 7 percent in 1970 to 14 percent in 2007. Likewise, the proportion of families in poor neighborhoods doubled from 8 percent to 17 percent over the same period.
Today, America’s two highest classes: “Affluent” and “High Income” are roughly equal in size to the “Poor” and “Low Income” classes, and also roughly equal in size to the “High Middle” and “Low Middle” classes.
All six income classes in America have become more equal in size, while in Western Europe, the classes (although with much lower average income) are less equal, because of a large middle class.
In the U.S., much of the middle class moved up, while many immigrants from dirt poor countries moved into the lower classes.
Around the turn of the 19th century, most immigrants to the U.S. were from Europe and had roughly the same skills as the domestic population (although, the domestic population had mostly low skills too).
However, in recent decades, most U.S. immigrants had lower skills than the domestic population, while relatively few had higher skills.
Errr, that is because Europe let the US invest in those fields publicly. Your not getting the connection and are wrong on incomes.
Europe could’ve been more competitive in emerging industries.
A firm like Microsoft didn’t exist in the early 1970s.
By 2000, it created 10,000 millionaire employees, and several billionaires.
Even median income is much lower in Western Europe than the U.S.:
https://en.wikipedia.org/wiki/Median_household_income
Also, it should be noted, Western Europeans compared to Americans live in much smaller houses, have fewer and smaller cars per capita, and fewer shopping malls, or less sales, per capita.
In the U.S., there’s much less inequality based on consumption than income, in part, because high-income earners save more and consume less, while many low-income earners die broke or in debt.
“A firm like Microsoft didn’t exist in the early 1970s”
This is key. What this graph is showing is the ultra-high end workers are adding tremendous value to the country and economy, and the average Joe worker adds about the same value he did in the past.
A big question has to be how firms have changed over this period, with some growing, some merging, some failing, and drift in age and size. It isn’t too surprising inequality would grow most at firms that grow the most so it is more a signature of growth and how inequality grows. A fast growing firm can offer both lower initial wages and more opportunity. All firms start small, they must grow fast at some point to become large, but few large firms can grow fast.
America had vast and worse inequality before WWII and inequality growing after the Cold War. The world is to big now. Capitalism requires endless supply of labor for survival or it can’t make it.
You mean like this? https://www.google.com/search? https://www.robots.com/images/Robot%20Integration.jpg
Or this? http://images.fineartamerica.com/images-medium-large-5/blacksmith-the-smith-mike-savad.jpg
Not sure to which era you are referring.
A potentially important paper, it seems to me.
Given that most inequality occurs above 1% and really above 0.1%, I doubt that this study has much to say about it. It doesn’t have the resolution at the high end.
Also, the study only measures W-2 income and most income for those in the 0.1% does not show up on a W-2.
An interesting perspective on the 1% in Barrons: http://blogs.barrons.com/penta/2012/05/07/who-are-the-one-percent/
Throw on a label, add a bad connotation, and when it sticks you have a bogeyman.
Interesting read Bruce. I’m quite sure the President of Mountain College definitely deserves his $1.8MM a year and that isn’t just subsidy capture from govt provided student loans.
how do you respond to Marshall Sternbaum’s criticisms that there is severe statistical bias in their methodology?
http://d3b0lhre2rgreb.cloudfront.net/ms-content/uploads/sites/10/2015/06/12153843/Firming_Up_Bias_6-12-15_FINAL.pdf
Spencer: Sternbaum’s critique appears to apply solely to calculations of shares. I make no statements concerning shares anywhere above. Instead, I make statements about the calculations of the blue, green, and red curves as functions of s. For every s displayed, the procedure of Song et al. should be perfectly appropriate and entirely immune from Sternbaum’s criticism.
The appropriate headline should be “Study finds that if you ignore inequality, things are pretty equal.”
There is a simple explanation for the flattening of the wage structure in firms over the last 30 years. You aren’t measuring the same jobs as you were 30 years ago. Currently 30% of U.S. jobs are contractors, part-time workers and temps that are no longer on the company payroll. Lower income jobs don’t show up on a corporate W-2 anymore.
That woman who empties the wastebasket in your office, she’s likely an “independent contractor” who makes minimum wage with no health insurance, no sick pay, no vacation, no unemployment insurance, no worker’s compensation insurance for injury and no retirement plan. And she doesn’t show up in this study because she’s not on the company payroll anymore.
These are some of the workers who used to be on the payroll but now exist outside the company as “independent contractors” — data entry, clerical work, shipping and receiving, delivery and installation, manufacturing and assembly, product repair, janitorial and custodial services, customer services, computer services. For example, utility companies like telephone, electric and cable no longer have their own linemen and installers on the payroll. They are all 1099 “independent contractors”. Companies like GE, Boeing and Apple outsource their manufacturing overseas.
The trend over the last three decades is more out-sourcing and more “independent contractors” for lower income jobs, which now don’t show up on a corporate W-2. In this study, lower income workers are removed from the employee payroll which flattens the salary scale for those workers remaining on the payroll.
This study doesn’t measure the real economy as it exists today. The biggest effects of inequality do not appear on a W-2 form, either on the low end for independent contractors and temps nor on the high end for CEO income, making this study pretty useless if you are interested in inequality. You are ignoring the two extremes so of course you don’t see much inequality.
You’re assuming mostly low-skilled workers turned into independent contractors.
Here’s what the BLS says:
http://www.bls.gov/opub/ted/2005/jul/wk4/art05.htm
Lots of truck drivers are now independent contractors. Most have seen income drop. What we really want to know, and your link does not show, is how many of those earning low incomes are now independent contractors compared with the past.
Steve
Lots of truck drivers don’t want to work full-time, including overtime. So, when they work less, their income drops.
The link doesn’t show much. However, it shows the share of independent contractors hasn’t changed much between 1995-05.
And, it states: “Fewer than 1 in 10 independent contractors said they would prefer a traditional work arrangement.”
If an aging workforce, for example, wants to work fewer hours, or hours of their choosing, why stop them?
Corporate HR departments generally perform compensation surveys within the firm, and also with major competitors, and typically establish “pay bands” for job titles with similar skill sets. So, this is not super surprising. If you work for a medium to large company and are even remotely aware of HR policies: Companies have policies designed to reduce within-firm pay inequality for (roughly) the same set of skills.
To really get a significant bump you have to jump job titles (which usually requires new skills) or move to a new company. There are indeed a lot of people who would get a significant boost if they leaped from Wal-Mart to Google or Apple, where the average salary is 6 figures+. But I doubt that they could make that leap without a crash course in coding.
Hmmm. Lots of questions and not much time to do more than skim thru this. It is not clear how they defined wages. Does that include stock and options? Benefits? If relative wages stay the same, but employees need to make contributions to their pensions and health care, this will affect a higher percentage of their wages.) Shouldn’t we be looking at total compensation? As I read Piketty he is not saying that income is increasing due to increasing wages, but due to the returns on capital. How would wages tell us whether he is right or wrong? Finally, differences between the relative wages of individuals doesn’t tell us the ratio of total compensation for management vs labor.
Steve
I think Joseph has a good point that many large corporation s do not have the low wage maintenance workers on their payroll anymore.
But I suspect they did not become independent contract employes. Rather they went to work for firms that specialize in providing such services to larger firms.
Virtually every large firm and government agencies sub-contract janitorial, security, and such jobs to other firms. This still changes the composition of employment in may of the ways that Joseph suggest.
Second, in the new technology sector there are now many software firms that have and need only a handful of employes to become large capitalization firms –Facebook may be the prime example but there are plenty of others.
Spencer, in the past, firms did almost everything “in-house.”
Then, they began outsourcing both high and low skilled jobs.
Today, entire new industries, with many employees, and with many earning above average wages, serve other companies.
It isn’t just “low wage maintenance, janitorial, and security jobs.”
It’s also consulting, accounting, computer security, software engineering, high-tech equipment servicing, marketing, cafeterias, etc..
There was a reason that I put “independent contractor” in quotes, because these new workers are not really independent contractors as it is traditionally recognized. It is simply a reclassification of wage earners as workers not on the company payroll. The BLS data is from the Current Population Survey which says that “Independent contractors were more likely than those with traditional arrangements to be in management, business, and financial operations occupations; sales and related occupations; and construction and extraction occupations … Independent contractors” are workers identified as independent contractors, independent consultants, or freelance workers” These are in large part professionals or small business owners working through a LLC or S-corp.
This has nothing to do with the flood of new “independent contractors” since the last survey over a decade ago. The custodian who used to get a W-2 but now gets a 1099 (and no benefits) does not self-identify as an “independent contractor” in the CPS. They are a custodian, same as they were before. A delivery truck driver for UPS who now gets a 1099 instead of a W-2 is not counted as an independent contractor in the CPS. They are still just a delivery truck driver for UPS, same as before. The respondents themselves make that distinction and as such, the CPS is reporting an entirely different population of independent contractors — professional consultants, professional freelancers and construction contractors that are traditionally recognized and self-identify as independent contractors.
The CPS doesn’t even distinguish between W-2 and 1099 in its definition of independent contractors. They are not counting laborers who now get a 1099 instead of a W-2 as independent contractors. They are still laborers. The “independent contractor” status is just an IRS fiction invented by their employer as a way to reduce wage and benefit costs. It has nothing to do with the CPS which doesn’t make that distinction. The CPS does not use the technical IRS definition of independent contractor.
The most important variable is government subsidies, almost never included in income numbers especially when the source is the W-2. Low cost housing and rent control in large cities is a huge redistribution of wealth that is recognized as income for the taxpayer but is not recognized as income for the recipient. We have more people on food stamps – SNAP – than at anytime in our countries history, but the income for food stamps is recognized in the income of the taxpayer but not in the income of the recipient. These are only two examples of government distortion of income over-reported while actual disposable/spendable income is under-reported.
This technique allows local, state, and federal advocates of greater redistribution of wealth to never recognize the impact of their programs on the statistics and deceptively report fictitious greater income inequality.
Professor,
Thank you for this. The firm-specific factors support the fact of the artificial redistribution of earned income versus spendable income is significant in the reported unequal income distribution statistics.