The Philadelphia Fed yesterday posted the results of a revision of both coincident and leading indices, as explained here. The resulting plot for California, Kansas, Minnesota, Wisconsin and the US is shown below.
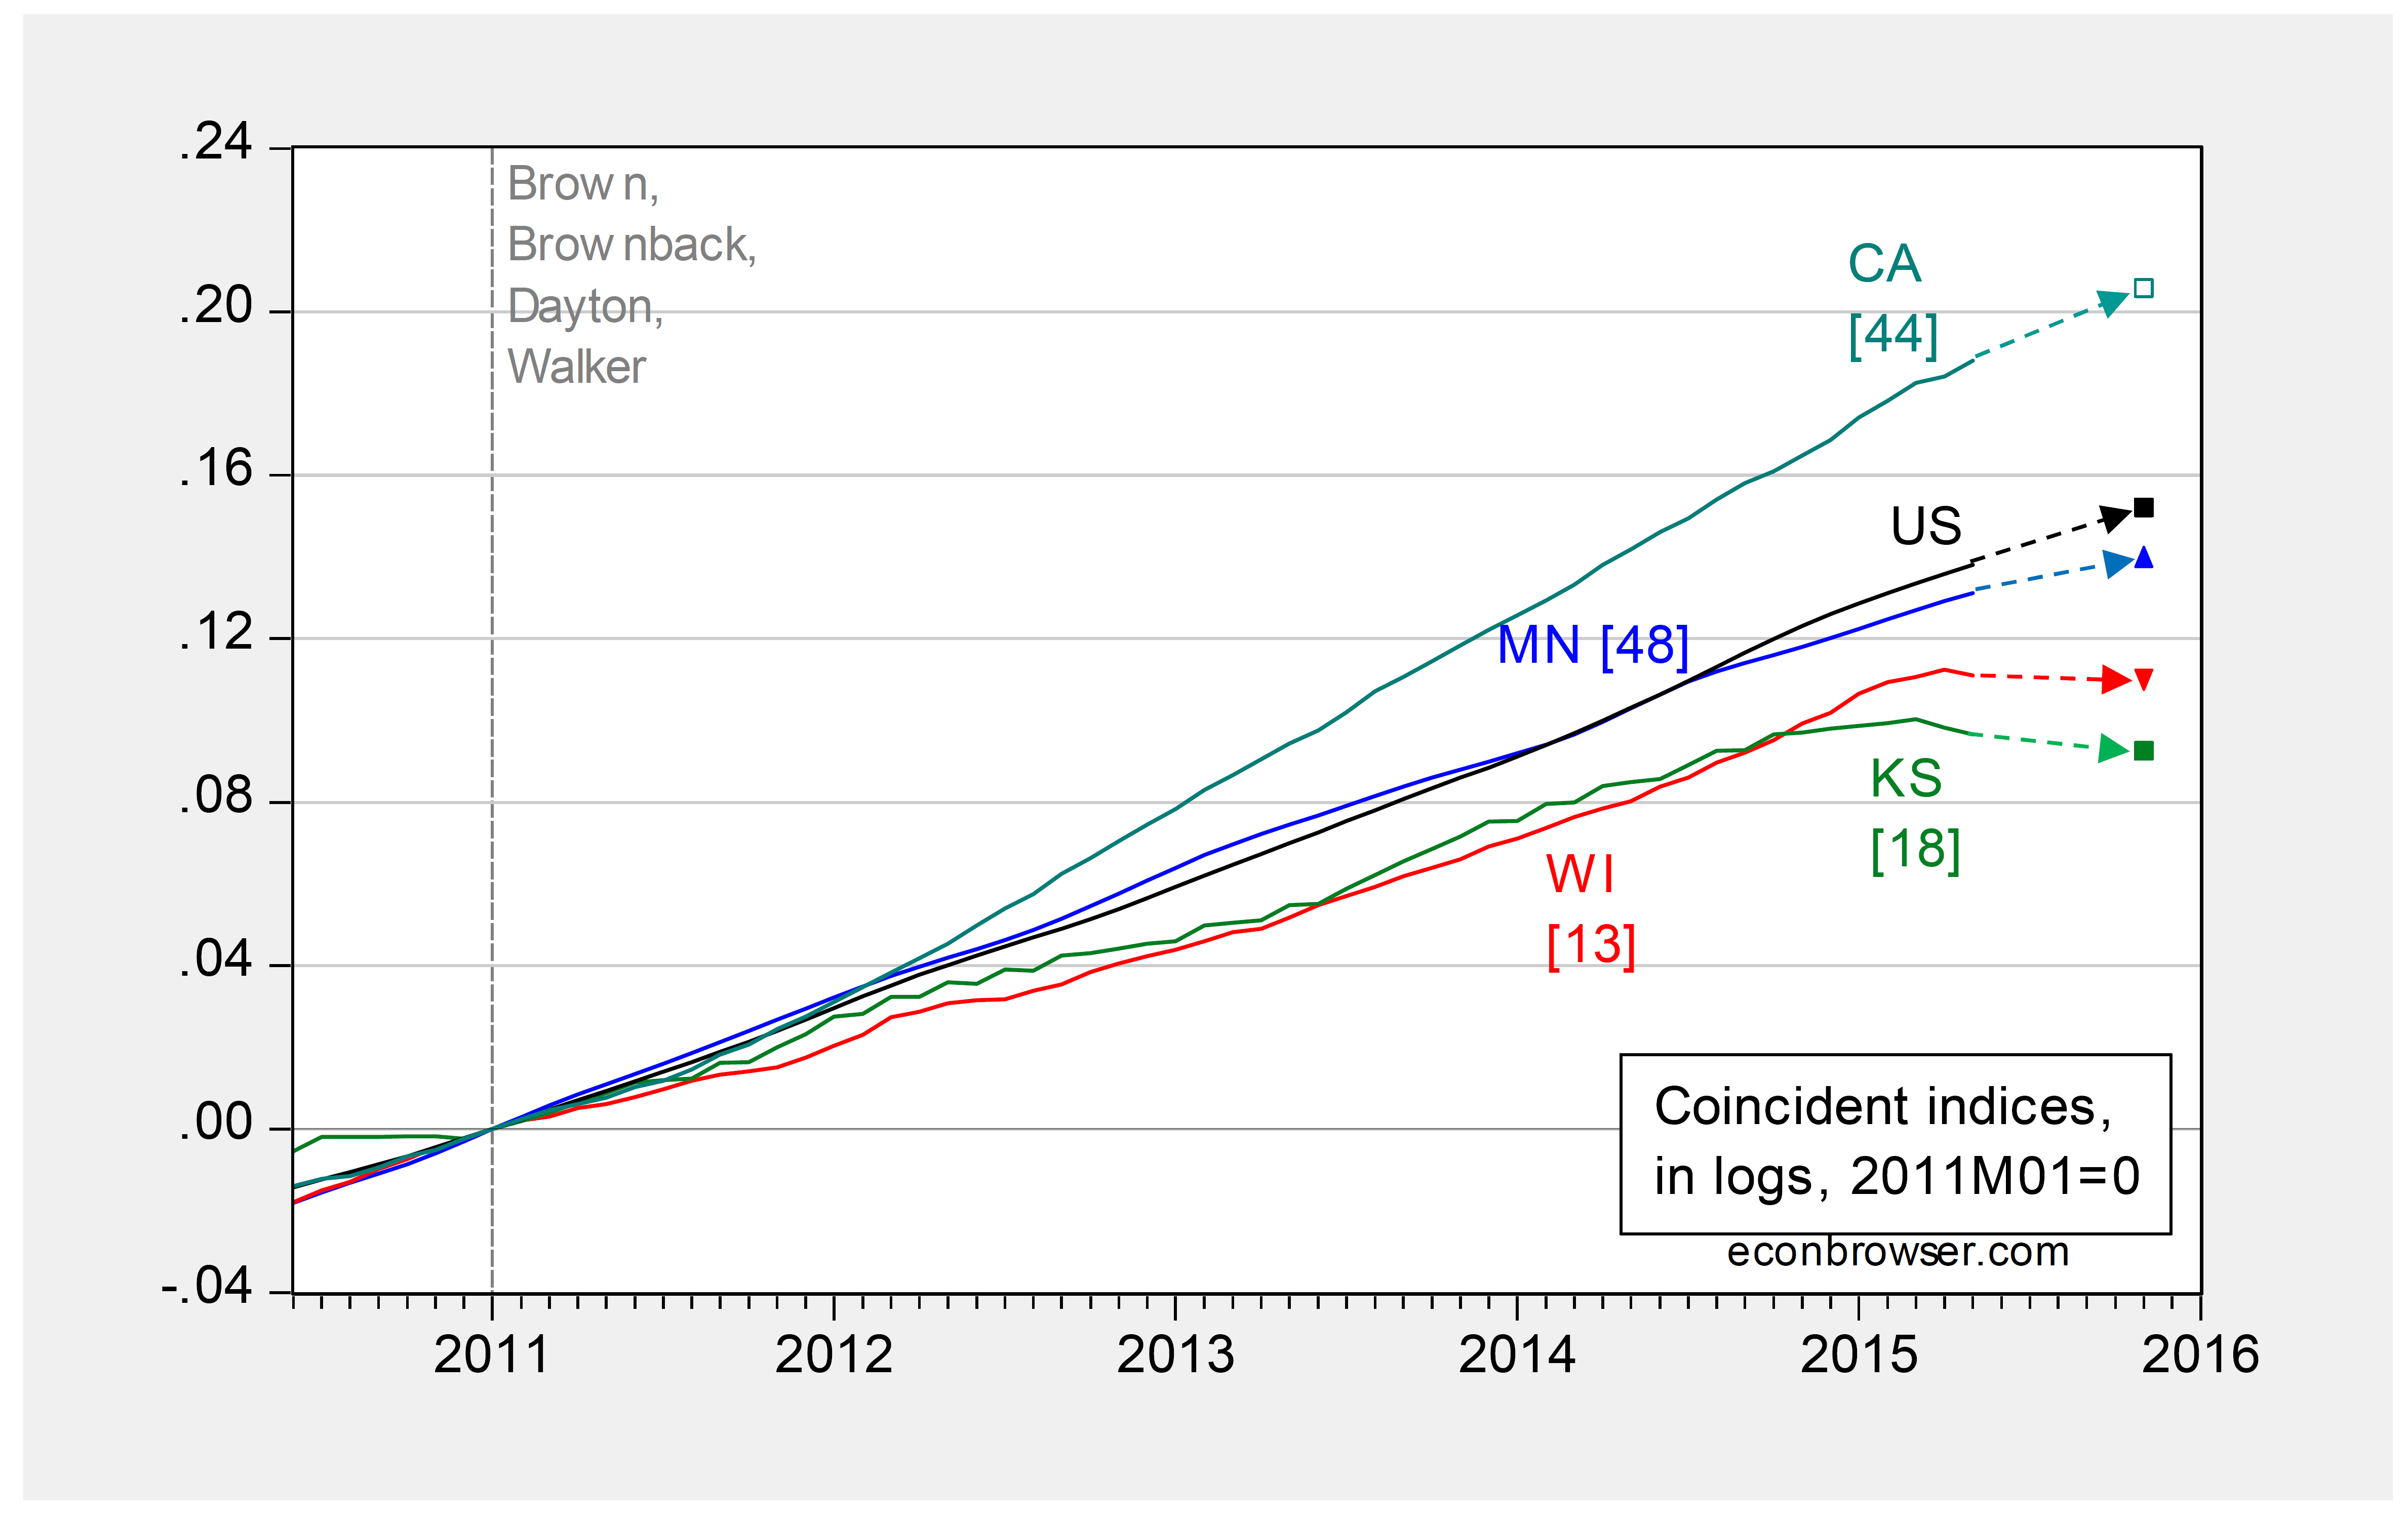
Figure 1: Coincident indices for Minnesota (blue), Wisconsin (red), Kansas (green), California (teal), and the US (black), all in logs, normalized to 2011M01=0. Observations for 2015M11 are log-levels implied by leading indices. Numbers in [brackets] are ALEC-Laffer-Moore-Williams rankings for 2015. Source: Philadelphia Fed, ALEC, Rich States Poor States, 2015, and author’s calculations.
The 2% cumulative growth gap since 2011M01 between Wisconsin and Minnesota is forecasted to grow to 3% by November 2015.
Notice the negative correlation between ALEC rankings and outlook (and recent performance), which is a manifestation of this pattern. Noah Smith discusses this lack of correlation between ALEC rankings and actual outcomes.
“Arnobio Morelix, a research analyst who studies startups at the Kauffman Foundation: “Places with high startup activities tend to be attractive for reasons beyond just the economy,” Morelix said. “They are places where people want to live and people want to move.””
If Wisconsin raised the minimum wage, GSP may grow faster, and if California reduced regulations, its GSP may also grow faster.
High and low skilled jobs are both growing faster than middle skilled jobs. Article:
http://www.newyorkfed.org/research/current_issues/ci18-7.pdf
Professor Chinn,
Since Ohio Governor John Kasich is about to announce his candidacy for the Republican presidential nomination , would it be useful to add Ohio to your figure 1 above?
AS: I suppose, although I haven’t included Louisiana, New Jersey and Texas either — would get a bit crowded when I do so. Maybe I’ll add a graph with all the states of Governors running eventually.
Charting Ohio, Louisiana and New Jersey seem to show interesting results. Ohio’s curve is above California’s curve. Louisiana and New Jersey overlay Kansas very closely. It would be great to read your analysis.
How could I forget Texas! The curve for Texas is also above California. The six-month implied coincident indicator for CA, OH and TX are about the same.
It seems, Ohio has become more diversified than Wisconsin:
https://en.wikipedia.org/wiki/Economy_of_Ohio
Of course, Wisconsin leads the nation in the production of paper and cheese, and second in beer (with no oil, natural gas, and coal production).
Note that cheese prices are down sharply from last year, and Wisconsin’s fizzy yellow beer is in long-term share decline to craft brews.
All Scott Walker’s fault, of course.
California’s economy is now driven by asset prices: real estate, biotech stocks, Silicon Valley social media stocks.
The rich are doing great out here! This is what trickle-down economics looks like! Of course the middle class is still moving out of state due to the cost of living…
According to the US Census from 2010 to 2014 California’s population grew 4.16% as compared to US population growth of 3.28% while Wisconsin’s population expanded 1.34%.
https://en.wikipedia.org/wiki/List_of_U.S._states_by_population_growth_rate
Yes, California has foreign immigration, much of it illegal.
But IRS data through 2011 shows how taxpayers are migrating:
http://www.howmoneywalks.com/irs-tax-migration/