There’s been a remarkable surge in world oil production over the last year. And the United States is only part of the story.
World oil production basically stagnated over most of the last decade. From January 2005 to April of last year, daily production of crude oil and condensate increased by less than half a million barrels annually. But over the last 12 months, the figure is up 3.1 mb/d.
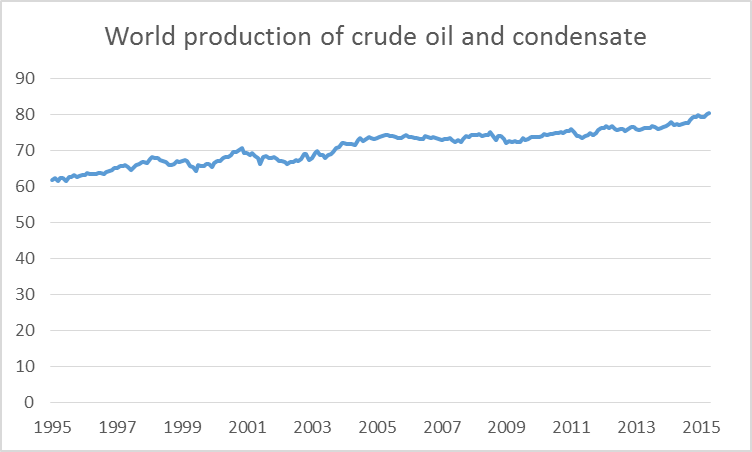
World production of crude oil and lease condensate in millions of barrels per day, monthly Jan 1995 to Apr 2015. Data source: EIA Monthly Energy Review, Table 11.1b.
The surge in U.S. shale production, dramatic as it has been, accounts for only a little over a third of that increase. I hope to say more about the prospects for U.S. production in a subsequent post. Canada also made a noticeable contribution to the world total; I discussed reasons why Canadian oil production would increase despite the falling price of West Texas Intermediate last March. But the really astonishing change over the last year has been OPEC production. OPEC production was virtually the same in April of last year as it had been at the beginning of 2005. But it is up 1.3 mb/d over the last 12 months.
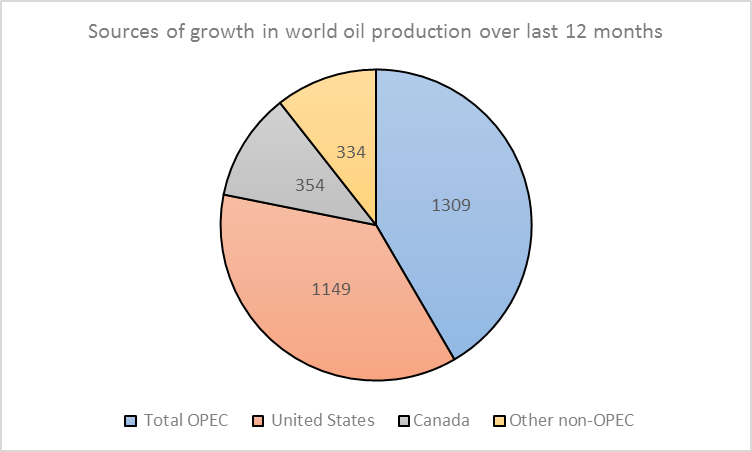
Change in world crude oil field production, April 2014 to April 2015 in thousands of barrels per day, by source. Data: EIA Monthly Energy Review, Tables 11.1a and 11.1b.
And the story of increased OPEC production is not, as many people seem to assume, that the Saudis have opened the floodgates in an effort to discipline North American competitors. Saudi production is not up much from where it stood a year ago. A much bigger story is Iraq, where the ambitious new projects that the country has been pursuing for some time are finally showing some impressive results. Iranian production is also up, and significant increases could lie ahead as sanctions are lifted. Libya is still a very unstable place, but slightly less so than in the spring of last year, and that is another reason why OPEC production today is higher than it was a year ago.
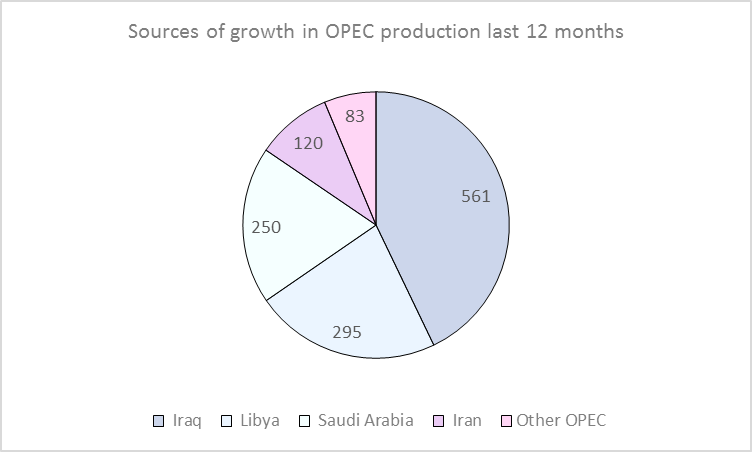
Change in OPEC crude oil production in thousands of barrels per day, April 2014 to April 2015. Data: EIA Monthly Energy Review, Table 11.1a.
Here’s a longer-term perspective on what’s been happening in OPEC. The sanctions on Iran and turmoil in places like Libya and Iraq were important factors in the overall stagnation of OPEC production over the last decade. If Iraq, Iran and Libya can return to some kind of normalcy, we could soon see an additional million barrels/day increase from those three countries. And if the precarious status quo in other troubled areas such as Nigeria can be maintained, that would mean that the surge in OPEC production has only begun.
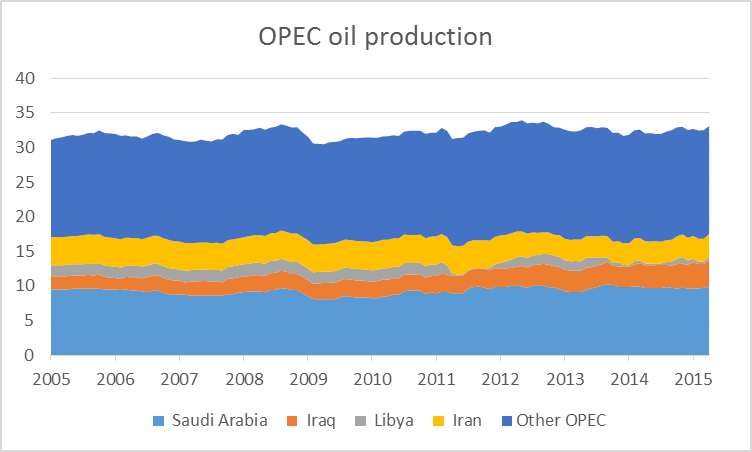
OPEC production of crude oil in millions of barrels per day, monthly Jan 2005 to Apr 2015. Data source: EIA Monthly Energy Review, Table 11.1a.
It’s hard for me to believe reading the news that peace and stability are about to break out in the Middle East and North Africa. But for now, more oil seems to be flowing from those troubled regions, and further big increases could lie ahead.
Some comments:
Saudi production for June was reported by the Kingdom as 10.56 mbpd. According to the JODI database, this is 780 kbpd over the level of June 2014.
http://www.jodidb.org/TableViewer/tableView.aspx
http://www.arabianbusiness.com/saudi-arabia-raises-june-oil-output-record-high-599485.html
Iraq has over-performed, but the feeling in the analyst community is that they are near a short term (ie, through H1 2016) peak.
Iran’s upside through H1 2016 is hotly debated, with UK consultancy Energy Aspects listing the upside at 0.25-0.4 mbpd; PIRA, at 0.5 mbpd; and IEA and the Iranians put the upside as high as 0.6-1.0 mbpd. Iran has about 800 kbpd of shut-in production. Energy Aspects believe decline rates have overtaken events, and therefore recovery will be slower. I am probably in the PIRA camp.
I am personally against the Iranian deal. Let’s see how Congress votes.
By the way, I am calling for a big production cut by the Saudis come September. They have already stated that they’ll be cutting back, but I think the numbers will be bigger than advertised. Right now, they are giving away oil for free, and they’re fools to do it. But they want to have plausible deniability with respect to putting pressure on the Iranians to sign the nuclear deal, so I think the cut comes when the Saudis can claim that ‘the market is well supplied’, rather than that they want to ‘maintain market share’ (which is near 20 year highs, by the way). To me, that’s next month.
There doesn’t seem to be much expectation in the analyst community that Libya will return anytime soon. Historically, such outages have lasted six years with a return to, but not above, traditional levels. This would put the Libyans back into play in 2017.
Readers will note that I am not using EIA data. There is a substantial and persistent discrepancy to JODI data, with the latter reflecting actual Saudi statements and the former reflecting I don’t know what. I’d add that neither the IEA’s nor EIA’s systems are adequate to capture material changes in supply and demand at less than a three month (and as much as a six month) time frame looking backward. As a result, we’ve been reduced to looking at inventory changes to attempt to back out the actual supply surplus.
To wit: In the last two weeks, US crude and production inventories have effectively been drawing; Europe is drawing; and in China they are afraid that the available cargoes for the region will sell out by the middle of the month. There is no overhang anywhere in the world right now which can be readily identified. This contrasts with the EIA, which puts the overhang at 1.8 mbpd in July; and Goldman Sachs, which puts it at 2 mbpd. In any event, it’s all just tea leaves right now.
This is probably a better link to the JODI data:
http://www.jodidb.org/TableViewer/tableView.aspx?ReportId=57431
Yes the Saudis clearly have the ability to push the price up, but right now an even bigger concern is to squeeze Iran to take the deal. The suggestion that Sudies wanted to “kill” shale oil by lowering the prices never made much sense. Obviously as soon as the prices go above a specific price, the technology is still there and shale would start right back up. On the other hand allowing prices to drop (due to the increases mentioned) in order to squeeze someone to sign a deal – that makes sense. Allowing some loses in order to further an important obtainable goal is understandable.
This is my take as well. If you follow that line of reasoning, it would make sense for the Saudis to raise prices going forward.
Steven, I know nothing about this, so please excuse any dumb comments, but I thought the argument was about derailing INNOVATION in shale production. As a new technology, every year shale producers were learning how to get the price down, and eventually shale producers would be able to directly compete with the Saudis. By flooding the market, the Saudis successfully killed off a lot of investment, and thereby a lot of learning and innovation. Is that wrong?
The relationship of prices to innovation is an interesting one and beyond my expertise. Again, this would make a very interesting economics paper (perhaps it already has).
High prices will tend to stimulate supply. It draws money, people and technology to the field. It also provides excess funds to allow experimentation. A company can compete by being either more effective or more efficient, and can be pretty sloppy doing so, because high prices will tend to hide mistakes. So I suppose in theory, high prices should stimulate innovation, and low prices should deter it. We’ll have to wait and see what happens in the shale oil business.
I would add, however, that innovation is discontinuous and potentially random. It is not really amenable to the sort of linear extrapolation which is the bread and butter of the analyst’s approach. That’s why we’re so poor at forecasting technology changes.
I don’t think the Saudis can kill off shale production. They might be able to seriously hurt the IOCs, which are sitting above shales on the cost curve. So if anyone’s going to get squeezed out, it will be the Shells and BPs of the world. And there the damage could be lasting, because the production cycle is so long in the deepwater, Arctic and LNG areas where the IOCs specialize.
But look at total oil supply PER CAPITA, which is no higher than in 2004-05. Moreover, the incremental supply has come from lower-quality, costlier crude oil substitutes from US and Canadian shale and tar oil, including the US share of world supply increasing 50%+ since 2008-09.
Also, the 5- and 9-year rates of growth of US production are at all-time highs last seen in 1927 and 1930.
The average 5-year price of WTI is ~$95-$100, meaning that the boom/bubble in borrowing and extracting was in response to a price of oil twice or more today’s prices. All the while, costs of extraction are soaring.
Despite the surge in costly shale and tar extraction, US oil production PER CAPITA is at the level of the late 1940s, having fallen 45% since 1970 and 25% since 1985.
At the log-linear rate of decline of the US oil depletion curve/regime, the decline in US production PER CAPITA will reach 50% by no later than the early 2020s, implying that no amount of increasing junk debt unwritten by Wall St. or C&I loans from banks to fund loan rollovers or current dividends and interest will prevent the energy cost of energy extraction precluding another production peak and decline in unprofitable shale and tar oil production.
In the meantime, world oil supply PER CAPITA is not growing, any increase in demand is coming primarily from the energy and energy-related transport sectors, and net available oil exports continue to decline in absolute terms and more PER CAPITA.
Therefore, we are in a Red Queen Race off the Seneca Cliff with global demand flagging outside the energy and energy-related transport sectors due to decelerating real GDP and trade growth from demographic drag effects, peak industrialization, excessive debt to wages and GDP, asset bubbles everywhere, and peak debt and regional trade, capital, and credit flows normalizing at parity between the three major trading blocs.
WTI in the $30s in the not-too-distant future coincident with the commodities cycle turning down and another deflationary global recession is increasingly likely.
BC –
The picture is not so dire. US oil demand growth is up nearly 900 kbpd, almost 5%, compared to a year ago. We may see $30, but not for reasons to do with fundamentals–not unless China comes crashing down.
Steven, I suspect China is not growing or is in actual recession, which is effectively “crashing down” comparatively speaking.
http://economictimes.indiatimes.com/news/international/business/china-may-tip-world-into-recession-morgan-stanley/articleshow/48075841.cms
https://pbs.twimg.com/media/CLztgePWwAAHJL4.png:large
Note the chart at the link above.
http://www.reuters.com/article/2015/08/08/us-china-economy-trade-idUSKCN0QD03320150808
http://www.bloomberg.com/quote/CNMS1YOY:IND
http://www.bloomberg.com/quote/CNMS0YOY:IND
http://uk.reuters.com/article/2015/07/15/china-power-consumption-idUKL4N0ZV1TX20150715
http://www.markiteconomics.com/Survey/PressRelease.mvc/7a6827e393934efc876644aa710d1361
China’s residential and industrial electricity consumption YoY and annualized YTD, YoY exports, private mfg. PMI surveys (no growth or contraction), and M0 and M1 rates imply that the non-gov’t sectors growing no faster than 2.5-3% nominal (exports are reducing growth by 2%), 2-2.5% nominal per capita. Pick your favorite deflator and real growth per capita has decelerated to 1-2%.
http://www.china.org.cn/china/2015-01/22/content_34625754.htm
http://blogs.wsj.com/economics/2014/09/01/chinas-productivity-problem-drags-on-growth/
Not to forget that China’s demographics are now where Japan was in the late 1990s and the US beginning in 2000-08, resulting in China’s labor force contracting for three years running with a real productivity of no faster than 1% (China is where the US was in 1930 WRT real GDP per capita), implying that China’s potential real GDP per capita is effectively ~0%, i.e., the post-2007 trend rate for the US, EZ, and Japan.
Therefore, 65-70% of world GDP has a potential real rate per capita of ~0% indefinitely hereafter, with the likes of Brazil, Russia, and Canada in recession, and Oz following closely behind.
BTW, the 4-qtr. US real final sales per capita through Q3 appears to have decelerated to “stall speed”, which is reflected by IP mfg. decelerating below 2% YoY and payroll tax receipts vs. reported wages and salaries implying that US employment is overstated by as much as 1% or perhaps more.
The crash in commodities prices is signaling global recession, as implied by Ned Davis Research’s Global Recession Probability Model.
And recall that during debt-deflationary regimes (as in the 1830s-40s, 1880s-90s, 1930s-40s, and Japan since 1998), yield curves (including the best data available prior to the 1930s for the US, UK, Germany, and France) do not invert prior to recessions and bear markets. Therefore, the US economy will stall and decelerate to 0% and contraction without the Fed raising rates and the yield curve inverting.
Thus, the Fed will not raise rates this year or indefinitely hereafter. Or, if the Fed does raise rates, they will quickly reverse course.
The global economy is much weaker than the consensus and financial media influentials imply or want us to believe.
China is very difficult for me to understand.
Here’s what a Hong Kong-based oil services analyst sent me this morning with regard to the Chinese economy:
“From what we see here it doesn’t feel as bad. Yes growth is slowing down to a level that is the lowest post 2008/09 GFC, but nobody is painting a soft-landing or hard-landing scenario. In my (non-economist) view I think China is now in the process of adjusting to a new normal growth pattern. During the process there will be volatility in the growth print, and the market needs time to digest the fact that we have now gone past the 10%+ p.a. growth phase.”
It doesn’t seem like a meltdown, and given that oil prices have fallen as a result of a surge in supply, not a collapse in demand, we would expect China, a net oil importer, to prosper.
But it’s not a given, I’ll grant you that.
http://www.bloomberg.com/news/articles/2015-07-26/hong-kong-is-feeling-china-s-pain
http://www.bloomberg.com/news/articles/2015-08-11/singapore-trims-gdp-forecast-after-economy-shrank-last-quarter
http://www.bloomberg.com/news/articles/2015-07-31/taiwan-economic-growth-slows-more-than-estimated-as-exports-hurt
Yes, Steven, Hong Kong, like Singapore and Taiwan (Asian city-states dependent upon US-China “trade”), are highly financialized and thus dependent upon the western, debt- and export-induced growth of consumption of the wealthiest top 0.001-1% to 5-10% of the populations in the West and Asia, i.e., classic imperial trade regime as in the case of Britain from the 1870s to WW I.
Singapore is an entrepot economy, artificially sustained, and an artifact of western imperialism. Were I living in Singapore, where I have visited and spent extended periods since the 1980s-90s, I would be out of there post haste, as I would China, which I have often referred to as a “four-letter word”: “SELL”.
My background is computer science and engineering, macroeconomics, economic history and cycles, and “trade” and development, and I spent much of the time from the late 1980s to late 1990s to early 2000s working in high tech, financial services, and NGO/IGO consulting, i.e., an “economic hit man”, and what is generally understood about “trade” is incorrect or largely misrepresented. That is to say, because of the consequences of NAFTA, “offshoring”, and “globalization” (what I refer to as the Anglo-American imperial “trade” regime), about half of US “exports” are actually US supranational firms shipments of capital equipment and technology transfers to their foreign subsidiaries and contract producers. The intra-Asian, cross-border flows of components and intermediate goods from US and Japanese subsidiaries and contract producers’ in Asia are similarly accounted for as “exports” that eventually end up as finished goods in the lowest-cost producer in Asia that then are accounted for as “exports” to the US and other developed markets.
The point is that, were US and Japanese “exports” to China-Asia to be accurately accounted for, the US “trade” deficit is effectively not existent EX oil imports. But even then, if one accounts for “oil imports” from the large oil companies’ foreign production or subsidiaries’ production, the US has effectively little or no “trade” deficit. This is reflected unequivocally by the current trade-weighted US$ indices, including for majors and the broad index; and it is the primary contributor to the reporting of the deceleration of growth of revenues to 2% since 2007 and negative YoY for the S&P 500.
Read Krugman’s works on “trade”, which are the basis for his Nobel accolades, credibility, legitimacy, status, and legacy, and prepare to be embarrassed in the context of the facts.
The financial media and much of academe describe the recent behavior of the US$ as a “strong US$”, but what is actually occurring is the world’s reserve currency “normalizing” to reflect the global trend toward little or no growth of real GDP and “trade” per capita and GDP PPP between the three major global geopolitical “trading” blocs, as well as all of the major fiat, digital, debt-money currencies trending toward, and around, par with one another hereafter.
The notion that China will surpass the West, or that the Middle Kingdom’s currency will become the global reserve currency, is laughable and evidence of a lack of understanding of the historical nature of “trade”, the secular debt cycle, and private debt’s constraint on real growth per capita (and its effect on wealth and income inequality and its pernicious effects).
Were China to float the Yuan/renminbi, there would be a GIANT SUCKING SOUND of capital outflows (more so than is already underway as US and Japanese firms repatriate funds from China’s banks and financial system). China’s money supply is currently ~200% of GDP and thus indicative of persistent deflationary conditions, as is the case in the US, Japan, Canada, and Australia.
China is much more likely to devalue the Yuan/renminbi by delinking the currency (as Japan did in the 1930s prior to invading China and before the oil embargo by the US) from the fiat, digital, debt-money US$.
Saudi production is at near record levels.* I don’t think that they are trying to “discipline competitors”. A more rational explanation is that they have considered price fixing (and would willingly do so, by constraining capacity as they have intervened in the past and arguably have not supplied every barrel they could for a while), but that they don’t think they can pull it off. So they compete freely (e.g. more volume).
(1) because of US LTO ability to grow [give those crazies “hundred dollar here to stay” and they will go back to 1+ MM /year growth (some credible analysts foresaw 1.5-2 MM bpd/year growth in a 2015-2016 $100+ dollar regime).
(2) In addition, SA probably thinks they can’t get the rest of the cartel on board with them (Iran, Iraq wanting to grow as well as the poor nations like Venezuala, etc. wanting everyone else to cut).
So really all it is the market going from less competitive to more competitive. And, since oil is forward looking (Hotelling, storage arbitrage, blabla), the potential for successful cartel intervention (or the converse) has a role in price. After all, we did have the huge drop after the OPEC meeting with no production cut. And that was even with reports that there was only ~40% chance of a cut. [so a lot of the drop had been priced in, but confirmation still moved the price.]
It is at least a reasonable explanation to explore fully (and IMO the actual correct one) that US LTO barrels helped move the market. Not only with their own volume but by cracking the cartel. The same thing could have been done by drilling ANWR and the VACAPES. This shows again (as in the 80s) the value of US oil industry to influence world prices. Drill, baby, drill was a reasonable POV and one rooted in classical micro economic intuitions.
*As a side note, going back and looking at the years ago speculations on SA production difficulties. What ever happened with that? Seems like we should have some post mortem. They are doing fine a decade later.
I’m not so sure that looking at the last 12 months captures all the market information. People trading oil have seen a history of increasing US production over the last 5 years. That has created a gradual realization that shale was “for real”. (I remember a lot of dismissive comments about it in the past. Also it has typically outperformed even “optimistic” estimates over the course of the last 5 years.) In addition, the big crash came 6 months ago. And then US growth was not the same (although still some) over the last 6 months as it would have been. So I just think the market is reacting to more than just the recent 12 month snapshot of US LTO performance. I would really argue that the price crash was just a realization/confirmation of factors that were already well more than nascent at the time of the hundred here to stay publication.
In other words, it should at least be within the solution space to consider a frame opposite that of ‘hundred was correct and then something changed’, but that oil was overpriced (a bubble) for at least the more recent years within the 4 year period that it was high. IOW hundred was wrong and we got a correction.
So, Nony, I agree with most of what you say.
I would note, however, that a supply-constrained model resolves in one of three ways:
1. No solution which rapidly increases the oil supply is found. Oil prices stay high as supply growth is less than inherent demand growth. Put another way, we run out of buffalos before demand for buffalo meat is sated.
2. A solution is found, in which case production from this solution will increase at an increasing rate. This is exactly what happened with shale oil. You can see, for example, the exponential growth in EOG’s production. To use the buffalo analogy: We run out of demand before we run out of buffalos. The number of hunters and the buffalo taken increase in exponential fashion until demand is sated.
3. No solution is found, but demand adjusts such that prices and volumes return to long run budget parameters. So, by this theory, supply remains constrained, but demand adjusts such that the spend on, in this case, oil returns to long-established averages. For example, this would imply that spend on oil will decline from, say, the recent level of 4.5% of GDP to long-run level of 2.5% of GDP even in the absence of supply accommodation. The proposed mechanism for this would be the equalization of marginal rates of substitution. Thus, if one item in your consumption basket becomes unusually expensive, you will reduce consumption of that good until it has the same value, in terms of marginal utility, that it had at the unconstrained steady state. And with this, the price–of oil in this case–falls back nearer long term levels, even in the absence of supply accommodation.
I am not convinced of this by any means, but you can see hints of it in the data. It would make an interesting paper topic for an economist better versed in these matters than I am.
3.
I like you Steven, but instead of inventing buzzword term like supply constrained, just use classical microeconomics. The supply and demand curves. Shifts. Movements along. P-Q. Clear thinking is better than buzzwords. Your numbers below in classical micro econ.
1. Depletion driving loss of supply: a shift of the supply curve to the left–less supply for a given price. If the demand is constant (the curve…NOT a movement along it), result is less volume consumed because of a movement along in response to a shift.
2. New technology or discovery drives new supply: a shift of the supply curve to the right. And then the opposite of the above.
3. Assuming no change in supply (the curve not shifting, not saying no movement of the intersection along it), demand increase (the actual demand curve going up or down) will cause
————–
This stuff really is Econ 101. Yeah, there can be some complexities with forward looking (storage arbitrage) or with short versus long term elasticity (of demand or supply). But it’s still basic econ. And hearing people confuse volume consumed with the demand curve. Or shifts versus movements. Or obsessing on little jitters of inventory variation. Is like nails on chalkboard to me.
“The cost and price of any mineral are constantly pushed in two opposing directions. Depletion pushes the supply curve toward the left, while growing knowledge pushes it rightward.”
http://web.mit.edu/ceepr/www/publications/workingpapers/98008.pdf
Look…you can be a scarcity guy…a peak oil guy and believe the above quote OR a cornucopian. It actually fits both. [It is your first two numbered points.] But what you have to do to decide if you favor the first clause of the second sentence or the second clause is to have actual estimates of depletion versus reserves (“how much is left”) versus advances (how much can we learn). And those are not easy problems. But they are still capable of discussion and analysis. and that’s the way to frame the problem. Definitely not showing time based curves of production for states as if the concept of depletion is some new idea. But actually trying to understand what is out there and how easy/hard it is to get to market. and that includes not just technical issues but political ones (e.g. ANWR restrictions, Nigerian criminals, blabla).
I am neither a scarcity nor plenty guy, Nony. I am a ‘regime’ guy.
In a demand-driven system, demand determines the amount of oil produced. Thus, GDP drives oil production. In a supply-driven (constrained) system, oil drives GDP. That’s a huge, huge difference. We are now back in a demand-driven system, hence the disappearance of all that talk about secular stagnation. GDP is now driving oil production again.
Excepting minor temporary variations in inventory and tiny amounts of waste, amount produced equals amount consumed. It’s just the “Q” on the P-Q graph.
And there’s no “regime” needed. There’s just an intersection of demand curve and supply curve. A shift in one will cause the intersection to move along the other. I don’t see any good reason to discuss this in terms of regimes or demand focused or supply focused when the classical languages and pictures (X-cross and all that) serves best. My econ book on my book shelf doesn’t need to talk about regimes or supply constrained versus demand constrained, as below. They are both constraints.
https://www.youtube.com/watch?v=dLCsMRr7hAg
@Steven: “We are now back in a demand-driven system, hence the disappearance of all that talk about secular stagnation. ”
The lack of talking about “secular stagnation” does not mean that it ceased occurring.
Real final sales per capita is barely higher than in 2007, whereas a growing share of economies are at, or near, “stall speed” or in recession, and the EZ is experiencing a one-off, unsustainable effect from the euro “adjustment”. Japan’s foreign exchange effect is waning or is done, and China is now following the crowd as anticipated.
Adjust for currency and price effects for the EZ, Japan, and elsewhere, and domestic real private final sales/GDP and “trade” growth per capita is weak or flat line: “secular stagnation”.
But for that to be acknowledged risks internalizing a 1930s- and Japan-like deflationary mindset, requiring examining the conditions, causes, and implications of “secular stagnation” in an altogether different context than the factors and conditions prevailing during the reflationary, debt-induced 1980s-2000s. We are now in a Long Wave secular debt-deflationary regime or structural balance sheet deleveraging but with the added constraint of demographic drag effects, Peak Oil, population overshoot, climate change, and resource depletion per capita, all of which combine as self-reinforcing factors resulting in “Limits to Growth”. The old rules, values, and prescriptions are no longer sufficient to achieve implied objectives.
Growth in real terms per capita is now too costly, but we lack viable alternatives that are politically, economically, and socially palatable, so BAU it is with the predictable outcomes.
Fear not, the Luddites in Michigan are attempting to turn back the clock. More expensive energy is the goal. Why, energy prices might necessarily have to skyrocket….
http://www.letsbanfracking.org/
Professor,
Your post and Steven Kopits comments give the best picture of the oil situation. Thanks to both of you for sharing your research and wisdom.
Hmmmm….JDH decided against posting the data in logs. I guess he didn’t want to take all the abuse that Menzie got! Actually, showing the data in logs with Jan 1995 as the zero base probably makes JDH’s point even stronger. The strong growth in oil production really stands out.
Here’s a puzzle that I hope JDH or Steven Kopits can address. When I take a not-too-detailed look at the data I see a fair amount of garchiness in the detrended squared residuals. And the the q & p GARCH parameters are significant. I don’t know squat about the oil business, but this isn’t something I would have expected to find…especially at a monthly frequency. Oil production is a physical commodity, so I would have expected to see a lot more sluggish volatility responses. Any ideas?
Based on annual data through 2014, I suspect that the peak of actual global crude oil production (45 and lower API gravity) is probably in the rear view mirror.
From 2005 to 2014:
Global dry gas production increased by 24% (BP)
Global Natural Gas Liquids (NGL) production increased by 26% (EIA)
Global Crude + Condensate (C+C) production increased by only 5% (EIA)
Since condensate, like NGL, is a byproduct of gas production, I suspect that actual global crude oil production (45 and lower API gravity crude oil) probably peaked in 2005, while global natural gas production and associated liquids, condensate & NGL, have (so far) continued to increase.
People buy cargos of Eagle Ford at 47 all the freaking time. It is a INDUSTRY KNOWN NOW. (well…US and Canada, at least.) It is considered crude oil, not condensate, by the buyers and is clearly a substitute for WTI as it runs through distillation towers and refineries, makes gasoline, etc. [And even 55+ API lease condensate is a substitute for crude oil.]
The fetish of 45 and below is silliness. Read back 8-10 years and the peak oilers said we wouldn’t find enough light oil!
And peakers never discuss the low sulfur aspect of shale oil, which is a clear win. Would you rather have 47 EF with 0.2% S or “Basra light” at 28API with 3% S. Try selling one or the other to a mid-Atlantic refinery, post transport costs. See which they prefer.
The “cat piss” analogy peak oil whiner about shale oil never get into the pricing either. Eagle Ford sells for pretty close to WTI. I think an econ blog might look at pricing and usage and correlation of price movements and make a pretty no brainer judgment that US LTO is crude, from an economic standpoint. [I would even say from an industry standpoint. I know a lot more people in the industry who see the condensate versus crude distinction at 50 API, not 45, or just based on the actual phase flow from the hole…in which case, Bakken for sure is oil and a lot of EF is also. And in any case, refiners are very used to buying cargos of condensate and mixing into their crude slate. Been doing it for decades. It actually used to be more expensive than some crudes 10 years ago. Because it is so clean and you can make so much gasoline from it…with less downstream operations (less cracking).]
Here is a price sheet. Sigh. https://www.platts.com/IM.Platts.Content/ProductsServices/Products/crudeoilmktwire.pdf
In regard the foregoing (a probable peak in actual crude oil production), note that it took trillions of dollars in global upstream capex to keep us on an “Undulating Plateau” in actual crude oil production, so what happens given ongoing substantial declines in global upstream capex? It seems to me that we are likely to see a substantial decline in actual crude oil production (45 and lower API crude)–the stuff that actually corresponds to the oil price indexes.
As noted above, Saudi Arabia is showing a year over year increase in production, and we will see what the annual data show for 2015, but based on EIA production data and based on BP consumption data through 2014 (EIA consumption data not yet available for several countries for 2014), Saudi net oil exports fell to 8.4 mbpd (total petroleum liquids + other liquids) in 2014, versus 9.5 mbpd in 2005.
At the 2005 to 2014 rate of decline in the Saudi ECI Ratio (ratio of production to consumption), Saudi Arabia would approach zero net exports some time around the year 2033, 18 years hence.
Jeffrey, as you know, the data are unequivocal that world “oil” supply PER CAPITA is no higher than that of 2004-05, and net oil exports are down significantly during the same period, implying that real economic activity per capita dependent upon cheap liquid fossil fuels PER CAPITA prior to 2004-05, including food production and UTILIZATION PER CAPITA, can no longer grow.
Efficiency can maintain for some indeterminate period production/supply/consumption PER CAPITA, but it does not permit growth of same, which is to say that growth is over for top line corporate revenues, profits, capital accumulation, employment, real wages, gov’t receipts, asset prices, and debt to wages and GDP.
But we have not collectively internalized the fact . . . What happens when as few as ~4-20% of the population do internalize it, if not already . . . ?
http://uk.reuters.com/article/2015/08/11/opec-oil-idUKL5N10M3HF20150811
OPEC comments about US LTO. They don’t see themselves as trashing the market because of the last several months of boosted OPEC production. They see US LTO as not belonging at the table. US is supposed to make 5 MM bpd. Not 9.5. No. No. No. LTO should have dropped over the last few months (super decline rate and need for high prices and all that). Instead it actually went up slightly.
http://www.eia.gov/dnav/pet/hist/LeafHandler.ashx?n=PET&s=MCRFPUS2&f=M
Need more price bonking on the head to make those crazies like PXD in the Permian put DOWN the drill rigs and walk AWAY from the production table.
http://seekingalpha.com/article/3404975-pioneer-natural-resources-pxd-scott-douglas-sheffield-on-q2-2015-results-earnings-call-transcript
[Fascinating and almost unrepentant comments in the analyst Q&A. At first I though what are these guys smoking. They did not get the memo like CLR and EOG did! But then look at their supporting materials presentation, pages 8-10. http://investors.pxd.com/phoenix.zhtml?c=90959&p=irol-presentations It’s at least worth considering that the Permian really can deliver how they think it can.]
Thanks very much Jim and Stephen et al for the note and discussion. Nice to read in this very uncertain period for oil pricing.
Personally, I think market sentiment has dropped prices far too much, perhaps $12-$15 per barrel, relative to what is going on in the world. With all of the stimulus in the system from the ECB qe program, to China’s ongoing stimulus and now devaluation, to Japan and low rates around the globe all that is really missing to get prices up is a shift in sentiment.
When oil prices were $100 plus, the daily imbalance was more ‘balanced’ but not to the extent of a $50 per barrel differential.
Accordingly, and as always, the nonlinearities of oil pricing are mostly due to sentiment. When prices start to move back up they will do so when the world thinks they never will, perhaps this year, and at higher prices everyone will, as Steve noted, start to linearize and extrapolate data trends.
One factor that is missing from the growth picture is some good fiscal policy out of the G7 as the world has tended to lean left for the time being perhaps due to Piketty’s book yet it seems to me that when economic growth is high, oil prices are high, people are happier, and the world is in a much better place….
1. A lot of that run-up in OPEC volume happened after the DEC14 price crash, not before it. Maybe it explains the little recent 60 rally dropping back to 45, but not the earlier change.
2. For SA, their recent record shipments imply that they were not freely competing earlier.
3. Another factor is not just the growth in US production (over last few months) but that it has not fallen as hard or as quickly as expected. Markets are reacting to the shoe that did not drop. And I do think shale is a valve, not a ratchet, do think it responds to prices. Because everything responds to prices. Just it takes more pain than some expected. Recall that even during the boom there were some serious people saying that shale didn’t money at $100, how it would run out of sweet spot fast, etc.
I think minutes 22-30 of this video does a great job of stating the thesis of how US LTO turns/ed on at high prices. And how it was underestimated.
http://www.c-span.org/video/?325957-1/discussion-future-us-fracking
Here are some good articles on OPEC reaction to US LTO and taking it more seriously.
http://www.reuters.com/article/2015/08/11/opec-oil-idUSL5N10M3HF20150811
http://www.telegraph.co.uk/finance/oilprices/11768136/Saudi-Arabia-may-go-broke-before-the-US-oil-industry-buckles.html
http://www.telegraph.co.uk/finance/newsbysector/energy/oilandgas/11650577/US-big-oil-tells-Opec-anything-you-can-do-we-can-better.html
DEC16 WTI contract just broke below $50 and DEC19 just went below $60. Month ahead is under $41.
WTI just dipped into the 30s (intraday) for the first time. (And that is with the more than 30 day month ahead future. Since we already shifted from SEP to OCT futures.) More tellingly DEC16 is now under $48 and DEC19 is now under $57. IOW, the contango structure is actually flattening more than the next month view dropping.
Implies a view of longer shale production at a minimum. “More pain” needed to really turn off the production, hard. At a minimum, this makes the comments about shale “not making money” at $100+. [always a confusion to mix in CAPEX with this year returns, if you understand the concept of NPV].