Could the price of oil be a value such that the current quantity produced exceeds the current quantity consumed? The answer is yes, and indeed that has been the case for much of the past year.
Suppose for illustration that even at a price of $40, there would be enough producers with sunk costs on projects already begun who would be willing to bring sufficient oil to the market to fully meet current consumption. But suppose further that at a price of $40, few new investments are undertaken, so that next year supply is much lower than it is this year, such that next year’s production would equal next year’s demand at a price of $60.
What’s wrong with this picture? Under the above scenario, if you were to buy oil today at $40, store it for a year, and sell it next year for $60, you’d make a huge profit. And if right-minded capitalists tried to do exactly that in huge volumes, the price of oil today would be bid up above $40, as the inventory demand is added to current consumption demand. As that oil is sold next year, it would bring the price next year below $60. In equilibrium, the difference between this year’s price and next year’s expected price should be close to the storage cost.
That arbitrage is clearly an important aspect of what has been going on over the last year. In response to lower prices, capital expenditures in the oil patch are being slashed. The number of drilling rigs active in the U.S. areas associated with tight oil production is only 43% of its level a year ago.
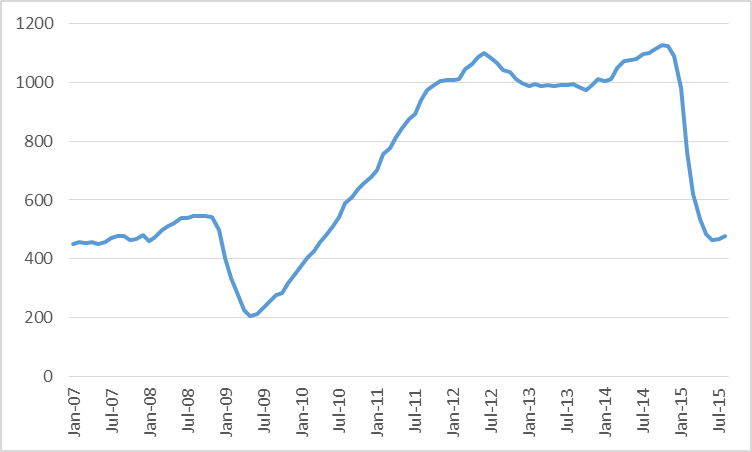
Number of active oil rigs in counties associated with the Permian, Eagle Ford, Bakken, and Niobrara plays, monthly Jan 2007 to Aug 2015. Data source: EIA Drilling Productivity Report.
U.S. oil production is falling, though so far the decline in production has been relatively modest. U.S. tight oil production is only down about 7% from a year ago.
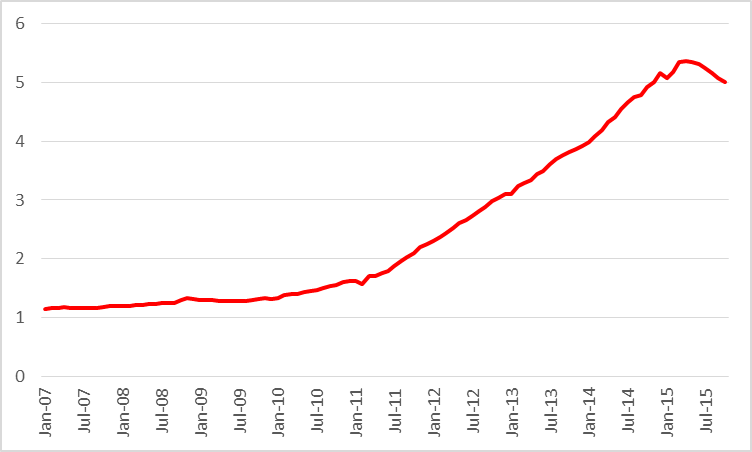
Actual or expected average daily production (in million barrels per day) from counties associated with the Permian, Eagle Ford, Bakken, and Niobrara plays, monthly Jan 2007 to Oct 2015. Data source: EIA Drilling Productivity Report.
If current lower investment results in lower future production, the arbitrage forces described above would mean the current excess supply would go into inventories, which would then be gradually drawn down as field production declines. And that seems to be what we have observed.
Source: EIA This Week in Petroleum.
The key factor determining whether those inventories will indeed be sold at a higher price than they were purchased is the strength of next year’s demand. So far China’s oil imports have been quite strong.
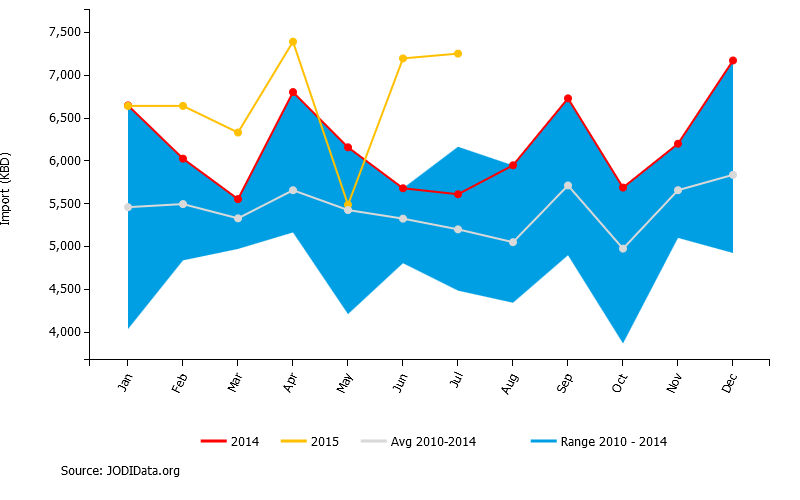
China crude oil imports, thousand barrels per day, in 2015 (yellow), 2014 (red), and range over 2010-2014 (shaded). Source: JODI.
But there is considerable doubt about whether that will continue into next year. For example, manufacturing purchasing managers’ indexes for China are signaling contraction.
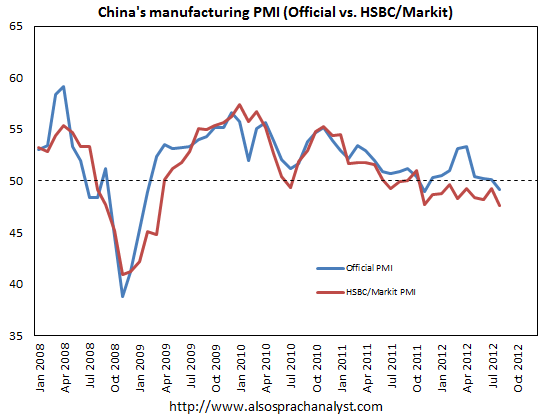
Source: FT Alphaville
What evidence is there that worries about a global economic slowdown are figuring prominently in recent oil prices? Exhibit one is the remarkable comovement between commodity and asset prices. Concerns about global economic weakness show up in commodity prices and asset markets across the board. Art Berman notes the striking visual similarity of graphs for prices of different commodities.
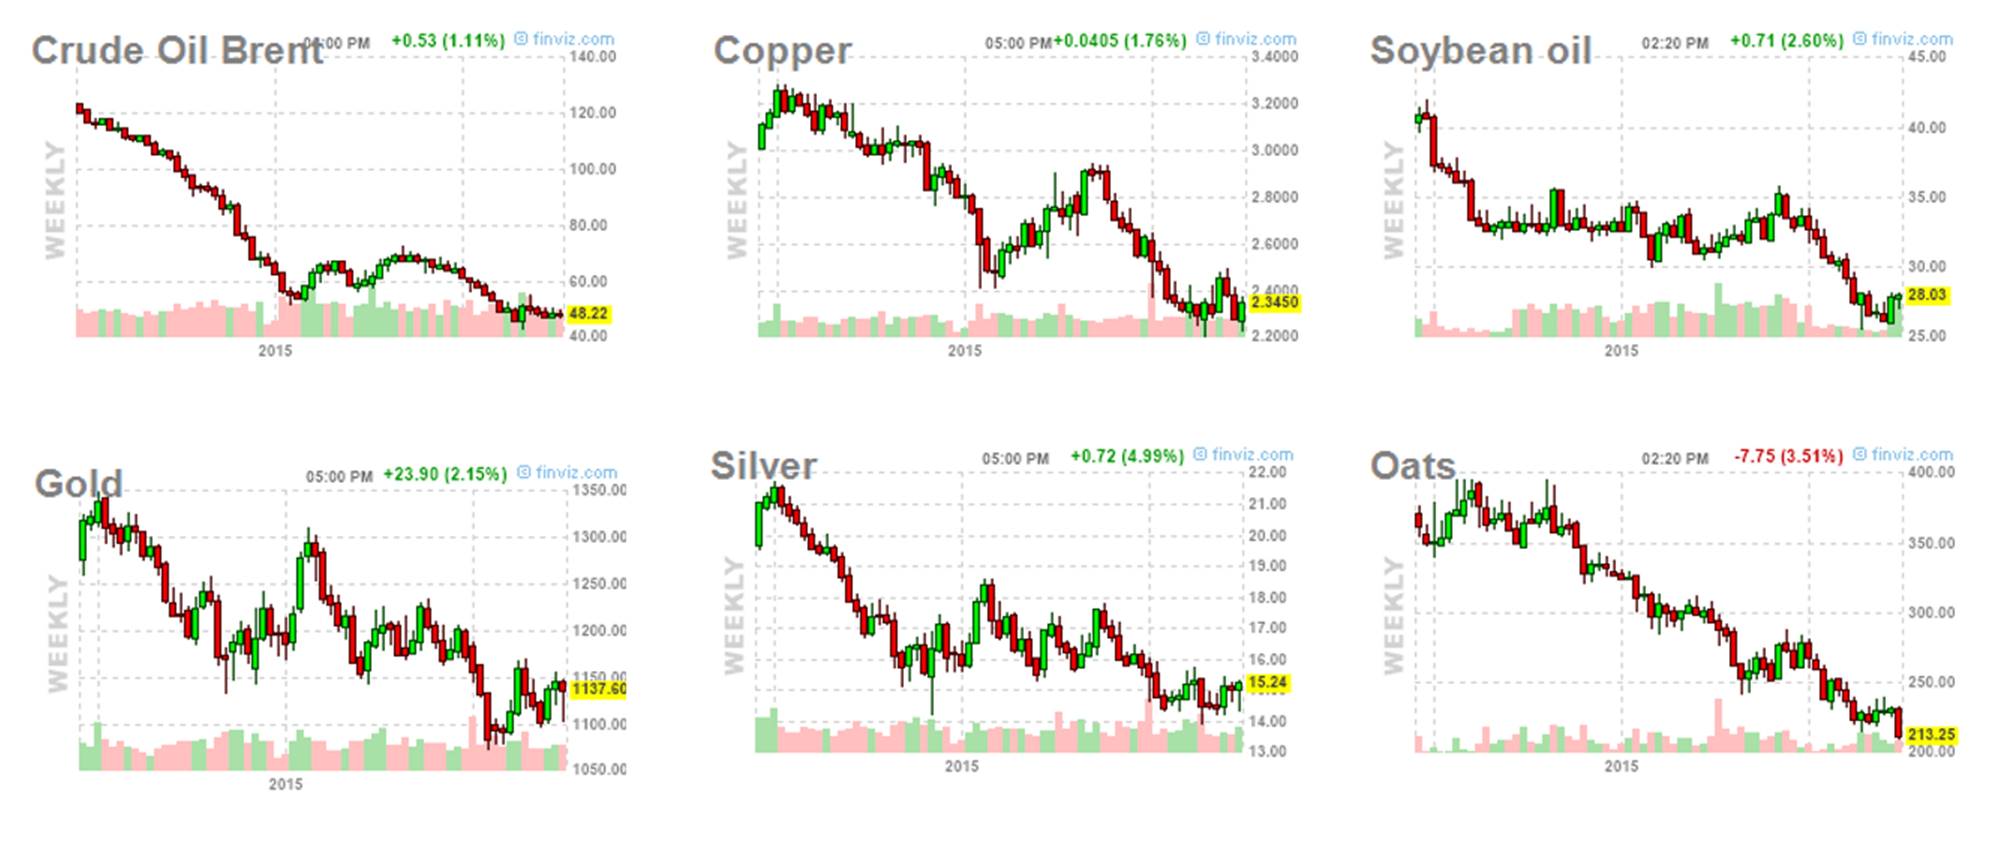
Source: finviz.
Of course, there are other wildcards as well. Most prominent among these is whether there will be enough stability in places like Iran, Iraq, and Libya to permit an increase in production from these and other OPEC producers. But one key given is that U.S. producers will be the primary balancing factor in the current equation, to offset whatever ends up happening with China and OPEC. And the other given is that U.S. production cannot be sustained at current prices.
Wouldn’t another factor be that tight oil producers can start up quickly? If oil prices rise, they want to make their money. I see tight oil production is down 7%, which seems to be related to greater efficiency, cash flow, etc. How quickly could that reverse?
In my opinion, due to the loss of personnel, and the loss and degradation of equipment plus a much more difficult financing environment, it’s going to take quite a while to get anywhere close to prior drilling and completion levels, even with an increase in oil prices.
A couple of interesting articles follow. The first one links to a Fortune article, also linked below:
http://www.dailyimpact.net/2015/09/30/fortune-frackers-face-mass-extinction/
http://fortune.com/2015/09/26/frackers-could-soon-face-mass-extinction/
Thank you, Jeffrey.
There’s cannibalization of rigs going on (saw a story on this) and also some people will have moved geographically, like there new jobs, etc. So…it’s not like opening a pressurized fire hose. Still common sense would say that it is easier to grow from 600 rigs to 1200 (e.g.) with 1000 rigs sitting idle, than to grow from 1600 to 2200 with having to build new rigs. Same concept holds with people. Yeah, they won’t sit on the shelf for you, but there is some resource of trained people that did not exist before and it has some value.
Also, the point is relative. Not if it is not immediate, but how it compares to deep water, e.g.
U.S. shale oil needs $80 to grow
http://www.reuters.com/article/2015/10/06/oil-outlook-shale-idUSL8N1262DU20151006
Of course, at an overall decline rate of 10%/year from existing production, operators need to put on line close to 1.0 million bpd of new Crude + Condensate (C+) production per year, just to offset declines from existing wells.
At a probably more realistic decline rate of about 15%/year from existing production, they would need to put on line about 1.5 million bpd of new C+C production per year, just to offset declines from existing wells.
Kind of a confusing headline and header paragraph. Papa says that at $75 bucks, we grow at 0.5 MM bpd/yr. That’s not consistent with needing $80 to grow at all. [I think they mean to grow at 1.0 MM bpd/yr, you need $80.]
Also, confusing when Papa says that we will start declining in production this month. The EIA data says we’ve been going down a few months already.
Oilfield cannibals: to save cash, U.S. drillers strip idle rigs
http://www.reuters.com/article/2015/10/07/us-oil-services-parts-idUSKCN0S109S20151007
James,
I was wondering these last months if Hotelling’s rule still apply. It never did as a matter of fact ! How much should oil producers store for the future, given COP21+ growing constraints on the global world carbon budget ? What is the new arbitrage, but to produce at apparent loss, if your asset are bound to be “stranded” in the coming years ?
Très cordialement,
Michel
If you believe the insight from Hotelling than as a producer, you don’t need to take any action to “save oil”. It will be priced now so as to compensate for the future value. Just let the market deal with it…be a price taker and an operator. It is what you are. Not a trader.
I think the Hotelling rule (law? I get mixed up) makes sense. It’s just arbitrage and time value of money. I was thinking about this before even knowing the label for it. however, to really make sense, it’s not a simple value of extending price up by time value of money. You actually have to know the structure of future demand (more than now, would raise current price, for example).
Also, oil is not a simple topic of different cost oil being gradually exhausted from cheapest to most expensive. Because the cost of obtaining the oil itself changes over time. IOW as knowledge improves the chunk of oil obtainable at X price increases. (Knowledge grows the chunk; depletion shrinks it. They fight each other. But it’s NOT only a depletion story.)
JDH writes:
Suppose for illustration that even at a price of $40, there would be enough producers with sunk costs on projects already begun who would be willing to bring sufficient oil to the market to fully meet current consumption. But suppose further that at a price of $40, few new investments are undertaken, so that next year supply is much lower than it is this year, such that next year’s production would equal next year’s demand at a price of $60.
What’s wrong with this picture? Under the above scenario, if you were to buy oil today at $40, store it for a year, and sell it next year for $60, you’d make a huge profit. And if right-minded capitalists tried to do exactly that in huge volumes, the price of oil today would be bid up above $40, as the inventory demand is added to current consumption demand. As that oil is sold next year, it would bring the price next year below $60. In equilibrium, the difference between this year’s price and next year’s expected price should be close to the storage cost.
That arbitrage is clearly an important aspect of what has been going on over the last year.
Professor,
Thank you so much for this. It is amazing that you even have to write this in an economics forum but the state of economics is so bad that many students and their teachers simply do not understand it. How often do you hear that the market creates excessively high or low prices? Market participants are looking for these opportunities to arbitrage because it is where they make money. It is command economies that prevent arbitrage where excessively high or low prices lead to glut and/or shortage. Economics students please teach this to your teachers.
Now concerning your graphs. The comovement of commodity and asset prices do not reflect an economic slowdown but a currency deflation. Now this deflation may be manifest in an economic slowdown, but I do not at all agree that such coordinate price swings always mean an economic slowdown. This is especially true when the price of gold tracks commodities in general. Gold essentially has no use value and supply is the most stable of any commodity. That means that it is significantly reflective of the state of the currency. The fact that gold has essentially the same curve as other commodities means we have a currency problem.
The awful jobs report with its downward revisions of previous months is much more illustrative of an economic slowdown than graphs of commodities.
Then come the upward revisions. Lets note, the only reason they(especially Septembers) were “down” was because of birth/death adjustments of part time to full time employment. This almost dropped 100,000k from September itself. You don’t look under the hood. You just mumble.
Michel – The oil storage is measured over months (much crude oil is tainted if stored over 12 months), whereas the COP21 impact is measured over decades
You should compare the change in commodity prices with the growth of world industrial production. The correlation is amazingly strong.
the Professor writes that it is a “given is that U.S. production cannot be sustained at current prices.” In a previous post he said that the marginal cost of production is greater than the current price. What is the evidence/argument for this? I haven’t seen details, esp regarding the marginal cost. Is there a previous post people can point me to? In the context of today’s post about storage of oil, I can see the mechanism: production persists today with the hope that marginal price in the future is higher. But how we do know that the marginal cost today (in the US) is higher than the marginal price?
MAB: For one thing, they were already losing money well before oil fell below $50. If you want more details see Art Berman.
I agree of course that tight oil producers are losing money, but I find that Berman presentation tendentious, especially re “OPEC strategy.”
To support a theory of a special strategy behind OPEC’s non-response, one has to assume (1) that OPEC is a functioning cartel and (2) that the default OPEC response to rising non-OPEC production is to cut OPEC production. Neither of which are true.
The reality is that the Saudis can at best rely on the Emirates and Kuwait to cut with them, and their previous mistakes cutting in the face of rising non-OPEC production have taught them not to.
The American oil industry needs to quit making lame excuses. There was never any intelligent reason to expect the Saudis, Emirates and Kuwait to cut. And it makes no sense to speak of OPEC strategy when most OPEC countries as a rule continue to produce at full capacity even when cuts are announced.
I’m leery of Art’s financial analysis. See him make conceptual mistakes in terms of thinking about capex as an investment (NPV). Also, in terms of free cash flow modeling (interest should not be deducted as it is a financing cost and already buried within the WACC; if you deduct it AND charge full WACC, you are double discounting).
Also, this is the guy who said shale gas would require $10, in 2009. And who wrote a presentation in 2010 called “Shale Gas—Abundance or Mirage? Why The Marcellus Shale Will Disappoint Expectations” (http://www.theoildrum.com/node/7075). Shale gas since 2010 has pretty stunningly been abundant, not mirage (it was UNDERhyped in 2010, based on the futures contracts) and the Marcellus sure didn’t disappoint in the last 5 years.
Some of his more recent oil stuff has been much closer to good lately and I give him kudos for that…but still the guy is neither a solid financial analyst nor even a solid, well-regarded industry analyst.
***
And all that said, I agree the companies don’t make money at $50 oil. Definitely not if holding production steady! 🙂
A more prosaic method is to see whether an industry is hiring or laying off. The oil business is laying off, suggesting that revenues are not covering expenses.
You can scan the headlines at the link to see the mood in the industry.
http://www.upstreamonline.com/
SK:
Completely agree. Similarly, I tell my corny friends that the rigs did not get laid down because of completion becoming so super productive (a meme), but because they don’t justify being employed (even at lower day rates).
However, converse also applies. There were a lot of people from the peak oil side of things who didn’t give the US LTO industry credit when it WAS hiring, growing, high rig counts, etc. at $100. Who said it didn’t make money and that the capital was being misallocated.
MAB: The key argument is that expected average total costs, including capital costs, are higher than the current price.
Otherwise, theory predicts that producers will keep producing as long as price exceeds average variable costs even if the return on capital is significantly negative. That appears to be what we observe. In that scenario, sector-wide marginal costs are typically higher than price.
If oil stayed around $100 a barrel, U.S. tight oil production would be about 6 million instead of 5 million barrels a day.
So, U.S. tight oil production fell closer to 15% over the past year from where it would otherwise be.
Many countries had declining oil production, while oil was around $100 a barrel (e.g. because of depletion):
http://peakoilbarrel.com/opec-crude-oil-production-charts/
http://peakoilbarrel.com/non-opec-charts/
World GDP has been roughly flat over the past five years:
http://www.statista.com/statistics/268750/global-gross-domestic-product-gdp/
Peak: “World GDP has been roughly flat over the past five years.”
Right, and down slightly per capita, and near 0% since 2007-08.
JDH: Thanks for the link to Art Berman et al’s presentation.
I find it interesting the authors blame in part the ZIRP (zero interest rate policy) for the over-capitalization of the tight oil sector.
Presumably the benefits of ZIRP outweigh the costs of capital misallocation. Or do they? Somebody should write an essay entitled: “In defence of fuzzy prices.” Why less information is better than more.
Berman et al also use consumption and production as synonyms for demand and supply. As rigorously defined demand and supply are latent, unobservable variables, it hints at the difficulty of forecasting future prices be they oil prices or prices for some other goods or services. And hints at the difficulty investors have in assessing tight oil prospects going forward.
I also dislike the tendency to call producer volume “supply” and refinery consumption “demand”. And then completely ignore actual demand and supply curve, P-Q phenomena etc. I think the mislabeling actually promotes the lack of microeconomic analysis.
Some background on the Saudi royal family, given reports that King Salman is in critical condition in a hospital:
In regard to Saudi Arabia, I usually reference “On Saudi Arabia,” which was published in 2013. Following is a link to, and excerpt from, Chapter One:
http://www.amazon.com/gp/product/0307473287?ie=UTF8&isInIframe=0&n=283155&ref_=dp_proddesc_0&s=books&showDetailProductDesc=1#product-description_feature_div
An article from April, 2015:
King Salman of Saudi Arabia Changes Line of Succession
http://www.nytimes.com/2015/04/29/world/middleeast/king-salman-of-saudi-arabia-changes-line-of-succession.html?hp&action=click&pgtype=Homepage&module=second-column-region®ion=top-news&WT.nav=top-news&_r=0
An article from June, 2015:
Surprising Saudi Rises as a Prince Among Princes
http://www.nytimes.com/2015/06/07/world/middleeast/surprising-saudi-rises-as-a-prince-among-princes.html?_r=0
A September, 2015 story about a memo circulating among the Saudi Royal family that was highly critical of King Salman and his designated successors.
Saudi royal calls for regime change in Riyadh (September 28, 2015)
http://www.theguardian.com/world/2015/sep/28/saudi-royal-calls-regime-change-letters-leadership-king-salman
Saudi King Hospitalized for Dementia (October 6, 2015)
http://en.abna24.com/service/middle-east-west-asia/archive/2015/10/06/713917/story.html
Saudi Arabia’s (KSA’s) oil production per capita is at the same level as in the late 1990s and down 15-16% since Peak Oil in 2005, which is similar to where the US was per capita in the early to mid-1980s and after the onset of deindustrialization and financialization.
In the meantime, the KSA is running a fiscal deficit of ~20% of GDP to fight oil wars, pay for social programs, and to prevent GDP per capita from contracting.
The KSA is well on its way to becoming another failed state in the desert.
https://app.box.com/s/8f0rm31psk7thwtd5j3gwgrtx8acmo8t
https://app.box.com/s/ys8ijadj4b57nb95ka0b3ilph38ga7fm
The price of oil is cheaper, but it’s not “cheap” WRT to the economy’s capacity to grow at the current price and supply, and oil consumption as a share of final sales.
The differential change rates of real final sales and the oil consumption as a share of real final sales remain at, or below, recessionary rates of the past.
The high price of oil, and by extension the high energy cost of energy extraction, continues to exert a post-Peak Oil recessionary drag on US economic activity.
No “escape velocity” or Fed rate hike indefinitely hereafter.
https://app.box.com/s/xt8fhcxp62igds328g7q6mzorpytq9pw
Moreover, growth of world trade has effectively ceased, i.e., global recession-like conditions.
https://app.box.com/s/dt2c8mz6vgrq11q8p8i5tbkn3oqlckcb
https://app.box.com/s/0hroqkg7zym2us8em4k55a36affs4xmc
Now the cyclical change rates of the rig count and price of oil are turning negative as in the mid-1980s and early 1960s, with US oil production set eventually to follow, setting up confirmation of a deflationary regime of the Long Wave (vs. the preceding inflationary and disinflationary regimes).
1. Here are the EIA global consumption numbers. While the last year or so, there has been a storage build, note that consumption* still definitely went up. Not down. Nothing like the 2008-9 recession. Just production going up faster was the issue.
World Liquid Fuels Production and Consumption Balance
http://www.eia.gov/forecasts/steo/report/global_oil.cfm
12:17:30 GMT-0400 (Eastern Daylight Time)
Source: Short-Term Energy Outlook
QTR Glcons YOYdelta
Q1 2011 88.68244289 2.7
Q2 2011 87.75515153 0.3
Q3 2011 89.80539452 0.3
Q4 2011 90.10164171 0.5
Q1 2012 89.00878633 0.3
Q2 2012 89.67986131 1.9
Q3 2012 91.0555436 1.3
Q4 2012 91.54767605 1.4
Q1 2013 90.31192725 1.3
Q2 2013 90.59026713 0.9
Q3 2013 91.86871892 0.8
Q4 2013 92.30835216 0.8
Q1 2014 91.38499418 1.1
Q2 2014 91.80043754 1.2
Q3 2014 93.3192298 1.5
Q4 2014 93.25125708 0.9
Q1 2015 92.74014072 1.4
Q2 2015 93.08748221 1.3
If you graph YOY delta versus quarter, you’ll see that recent consumption growth (2014 forward, say) has been pretty unremarkable. [The average YOY qtly delta for the data set is 1.1.] And in any case, there are no negative numbers here. No drop. No recent drop. Sure, doesn’t seem consistent with any interpretation that scarcity premium (peak oil concerns or whatever label is preferred.) are as relevant as was earlier argued and we just had some big recession make people not buy oil like in 2008-9.
*I’m assuming this means refinery purchases. Not sure how some subtleties like diluent for bitumen are handled. But doesn’t matter. Just want to show that even using this convention, what the result is.
2. The contango storage trade should not be an aha to any of your readers as it has been extensively covered in the press (and is sort of obvious if you think about it).
3. I actually think it has gotten too much press and that it certainly does not justify thinking about P-Q itself, especially if what is of interest is medium term status (“hundred here to stay”). In the long term, all production is consumed.
4. If you look at the strip from DEC 16 or so forward, most of the contango trade will be gone (a contango still exists but not sufficient to justify storage cost, plus time value of money.
5. It’s a lit bit philosophical if you think of storage as consumption (from the viewpoint of producer…after all they bought it and got it off your hands). There are other industries (hay, natural gas) that have big storage swings and it is just pretty much accepted. Even in fabricated parts or consumer products, you can think about product that is in the supply chain (at a wholesaler or retail store, even). Do you consider it consumed when sold or only when bought by retail consumer?
6. Storage trade is not the only interesting feature of the P-Q. There is also the issue of time dependant elasiticities of production or demand. Even for fabricated parts or chemical compounds or the like, these are common features that should be discussed when looking at the simple P-Q. (E.g. producers in the down part of the cyle selling until marginal producer forced out because of negative variable cost…the plants are mostly sunk costs. But over the long haul, they have to earn their cost of capital, so this is just a temporary phenomenon…same with the good parts of the cycle.)
7. I agree that there has been a lag in US LTO coming down. Part of it was the sunk costs of pre-existing drilling contracts (and on a longer term scale gathering systems and the like).
7.1 Part of the delay is also because breakeven is better than skeptics thought. (Many peak oilers thought they weren’t good investments at $100+, which basically says all those investors and companies and even oil majors were insane. But they confuse the idea of CAPEX and NPV versus year to year profits. A business growing 30% can easily justify being cash flow negative if you are including capital investments for future production.) All that said, the contango structure and the decline itself that is happening, pretty clearly implies that $40-50 is not enough to keep production at 9.5MM bpd either!
7.2 I think the companies also got a little bit of hope in the summer when prices got up to 60 (next month, even higher on the outs). That got dashed hard when the markets dropped. It even seemed that world price was reacting versus signs of US rig count going up.
7.3. Also, during the early part of the year, even when prices were in low 40s, the contango was very extreme (i.e. implying hope for better prices later on). But that contango moderated as the year went on. Look at DEC2017 contract for instance. It’s about $55. this evening. Next month (NOV15) is at 49.62. So about a $6 difference. But last JAN-FEB when the next month was dancing in the low 40s, the DEC17 contract was consistently above $60. [It’s a similar story if you look at DEC16.] IOW, US LTO had more hope last JAN-FEB than they have now, in terms of medium term price. Even with the little pop we had last few days into 49s!
http://www.marketwatch.com/investing/future/CLZ7/charts?ma=1&maval=50&uf=7168&lf=1&lf2=4&lf3=0&type=2&size=2&state=8&sid=0&style=1013&time=20&freq=1&startdate=1%2F4%2F1999&enddate=9%2F29%2F2015&height=444&widht=579&random=1184460811&arrowdates=0
Or looking at it from the market perspective, the markets are more negative about medium-long term price even than they were last winter. They are thinking not that they overreacted last winter, but underreacted. IOW, they are even more skeptical about hundred here to stay. [If you bought the CLZ7 at any time last JAN-FEB (even on the worst day of spot/next month price), you’re currently under water.]
[p.s. Same story if you look at Brent.]
Nony: If production this year is the same as last year, that CAPEX you’re spending is all going to replace equity you’ve lost through depreciation and depletion. The correct approach to accounting is to expense depreciation as a cost of generating current income.
If you’re growing production at 30% per annum, then capex=depreciation doesn’t work.
And the 30% growth case was the relevant one for US LTO at $100/bbl. 🙂
The other thing to watch out for wrt depreciation. It is kind of OK on a very quick, dirty basis to consider depreciation as a cost, to net capex/depreciation, etc. (for a static, non changing business). But real modeling does not do so for a few reasons in addition to the problem of not handling the non static cases.
Depreciation It is not a cash cost. [And an NPV is created by discounting true cash flows (DCF) at the weighted cost of capital (WACC). This is nothing super fancy, nothing arguable. It is standard finance, almost even engineering economics. See Copeland’s Valuation, Brealey and Myers Principles of Corporate Finance, or call any salt or freshwater B school finance prof.]
What really hits you on an investment project (imagine drilling and completing a single well) is the upfront capital cost. This is typically charged against the project at “year zero” (it’s an approximation, if you get super technical, you can do months rather than years for the model and given the steep first couple years decline, even worth it on the revenue side, but the principle remains for a standard yearly model).
Since depreciation is not a cash cost, you might imagine that it is not germane, at all, but actually in the modeling it HELPS you. This is because you have no cash cost associated with it, but GET the tax benefit of it as an expense. In any case, you definitely NEVER charge the project with up front capital cash investment and depreciation (as a cost) because that would be double counting. Of course, the amount of money spent to drill the well still hurts you because you only get the tax benefit (which is probably about 34% corporate income plus state income combined). Also, even that 34% flows back to you in the further out years and is discounted, whereas the drilling and completion was at/around year zero.
Note that the time value of money here impacts you even with a static business continually investing X amount of CAPEX and depreciating it over the years. E.g. consider a coffee shop (I have a friend who runs three). It is a fact of retail that about every 7 years, you need to gut the place and renovate. Customers want things shiny and new-looking. So every 7 years, you plonk down for a tenant improvement construction project (cash to the contractor). Same business in perpetuity. BUT…you only get to expense it over the years (which according to the source below is either 15 years or 39.5 years (except in year 7, if not already all expensed, you can do a one time write off of all of it, given you are re-renovating). But you really wish you could expense it all in the same year you spent the money and you will expense it as fast as the tax man allows you. And when you model it, you need to model the cash flows only being deductible later in time.
http://www.restaurant.org/advocacy/Restaurant-Depreciation
If you look at the trend of the USD lately, it seems to have made a serious bottom back in March/April of this year.
http://tinyurl.com/obtsfdh
That helps explain why crude oil (measured in WTI) is back over $50 per barrel today.
I think there’s a minor mistake in the Professor’s observation that “U.S. tight oil production is only down about 7% from a year ago” – I think that US tight oil production is only down about 7% from the peak, which is more recent than a year ago . . . . . though pretty soon US tight oil production will be down 7% year-over-year.
Last, if you consider what’s happening in the Middle East, there’s a serious proxy war going on between the Shias, led by Iran, and the Sunnis, led or at least funded primarily by the Saudis. Globally, two of the key players most injured by the Saudis maintaining high production forward from July 2014 to present were the Iranians and the Russians, who have now linked up in a large-scale military action in Syria – ostensibly to combat ISIS, but thus far it seems that the majority of the air and land sorties have been directed against the Free Syrian Rebels trying to unseat Assad. In terms of military strategy (or war) as “a true political instrument, a continuation of political intercourse carried on with other means”, I’d think that the Russian & Iranian alliance and invasion of Syria is a stroke of genius, as long as they make it work before the Russians run out of money (since the Ukrainian War was expensive enough by itself . . . . . . . )
WoodMac: Near-term financial risks exaggerated for US independents
“The high-growth business models of US independent operators are being tested by low oil prices and tougher access to capital. But two recent Wood Mackenzie Ltd. reports concluded that concerns surrounding October reserves-based lending (RBL) redeterminations have been exaggerated.”
“WoodMac’s Corporate Service Insight, “US Independents: How strong, for how long?”, examines the financial health of 26 independents, concluding that the larger producers have the required flexibility to tide them through the near term at the very least. Fraser McKay, WoodMac corporate analysis research director, said, “Most companies in the peer group have rising absolute debt levels, and October’s RBL redeterminations have been latched onto as a potential catalyst for sector implosion. But at least two thirds of Lower 48 production is attributable to companies with no RBL exposure at all, or have no redeterminations until 2016.””
“McKay said, “We anticipate discomfort in the coming months and expect some more companies will inevitably fail, which is clearly a catastrophic event for lenders and equity holders. However, most of these companies will be small, with preexisting structural portfolio issues. Even in the worst case scenario, the assets of these companies will be salvaged through restructuring or assets sales.””
http://www.ogj.com/articles/2015/10/woodmac-near-term-financial-risks-exaggerated-for-us-independents.html
6 month futures spread since JAN2014:
http://fingfx.thomsonreuters.com/2015/10/09/1107555ffd.png (from most recent John Kemp article)
We’re at about $3 right now. Not that extreme, not as extreme as beginning of the year. In any case, adding $3 to $50 still doesn’t get you anywhere near $100/bbl.
Even looking at longer periods, the freely traded financial markets show no expectation of anything approaching $100/bbl. Attached link is dynamic (updated), but at the time of this posting, the DEC2020 was furthest out contract with a recent trade and was at $59.15/bbl.
http://www.cmegroup.com/trading/energy/crude-oil/light-sweet-crude.html
Interesting story about US producers buying hedges at 50+ during the little pop that we just had recently in WTI price.
http://www.reuters.com/article/2015/10/12/us-oil-shale-hedging-idUSKCN0S609I20151012
It is interesting that these guys would hedge that low. That they are no longer in the relying on things getting back to the 70s camp? Do they think US LTO is the marginal barrel and they know it is stronger than suspected, long term? Do they think they can operate at 50? Is it because of covenants or bank loans? Just some corporate thing where they put in a plan to buy hedges when current price topped $50? (DEC16 hasn’t moved as much as current price, so makes no sense, but perhaps it was just a mechanical plan?)
Obviously every trade has a seller and a buyer who believe in what they are doing. And the counterparties who sold those contracts took the opposite view of the shale guys. But interesting article. Note also that the contango tightening discussion.
P.s. since the article was written, oil has dropped to 47.5, with DEC16 at 52.5 (as of 12OCT evening). So a 2.50 drop in current month, but only a 0.5 drop in DEC16.
http://level2energy.com/storage-inventory-and-crude-contango/
Nice basic article discussing the importance of the strip versus next month or spot pricing when thinking about producer economics. (Remember that a company is an investment. Has an (uncertain) NPV based on the returns of cash flows to perpetuity. A valuation model will incorporate several years of explicit forecasts plus a terminal value. This was often confused by commenters talking about shale CAPEX and considering it relevant to this year profits only…it is/was an investment. Maybe not as long term as Jack/St. Malo. But still more than this year.
The interesting thing to me was not just the flutter of current prices (44 in MAR, 60 in JUN, back to 40 last month, and 47 now), but the changes in the strip. When Danielle wrote her article last May, next month crude was at $47 and change, just like today. But the May18 contract she describes was at $65 and is now down to $55. That’s a big drop especially considering that out year contracts are more stable. It implies a systemic view of “lower for longer”. IOW, it implies that the situation at the beginning of 2015 was not a little glut to get worked off but more of a regime change. To explain that, one would think factors like US LTO breakeven or OPEC cohesion are relevant. Not the macro cycle affecting demand (as it is well…a cycle, rather than a long term change like learning to frac better).
May18 WTI contract: (select 2 year view)
http://www.marketwatch.com/investing/future/CLK8/charts?symb=CLK8&countrycode=US&time=9&startdate=1%2F4%2F1999&enddate=10%2F12%2F2015&freq=1&compidx=none&compind=none&comptemptext=Enter+Symbol%28s%29&comp=none&uf=7168&ma=1&maval=50&lf=1&lf2=4&lf3=0&type=2&size=2&style=1013