Increases in oil production in the United States and the Middle East were certainly key factors in the huge drop in oil prices over the last year. Nevertheless, one can’t help but be struck by the fact that the weekly changes in oil prices correlate with dramatic moves in other commodity and financial markets.
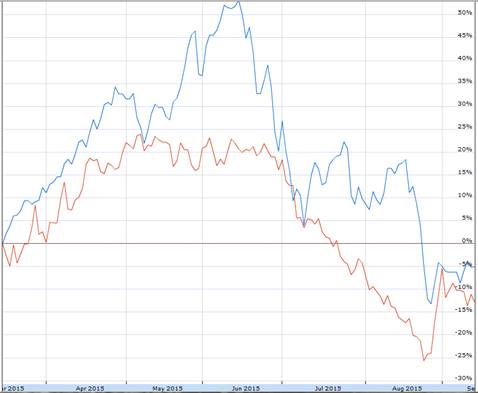
Cumulative percent change in Shanghai Stock Exchange Composite Index SHA (in blue) and United States Oil Fund ETF USO (in red) since March 16.
For some time I’ve been summarizing global macro factors behind oil price movements by looking at the price of copper, the dollar exchange rate, and the interest rate. Here’s a regression of the weekly percent change in oil prices (as measured by 100 times the change in the natural logarithm of the price of a barrel of WTI) on the weekly percent change in copper prices, the weekly percent change in the trade-weighted value of the dollar, and the weekly change in the yield on a 10-year Treasury. The regression is estimated using data from April 2007 to June 2014 (right before oil prices began their spectacular decline). If in a given week copper prices rose, the dollar depreciated, and interest rates rose, then it’s likely oil prices rose that week as well. The regression can account for about a third of the variation in oil prices through June 2014.

Comparing September 4 values with those at the start of July 2014, copper is down 34.3% (logarithmically), the dollar is up 19.3%, and the 10-year yield is down 52 basis points. Based on the above regression, you’d expect we would have seen a 41.8% (logarithmic) decline in the price of crude oil, or that the price of oil would have fallen from $105 to $69. In fact on September 4 oil was at $46. So certainly more was going on than just changes in the broader global economy. But just as certainly, the latter played an important role in the slide of the price of oil.
The solid black line in the graph below plots the dollar price of WTI since the start of 2014, while the dotted blue line gives the price that is predicted by the above regression for each week since July 2014 based solely on what happened to copper prices, the exchange rate, and interest rates during that week.
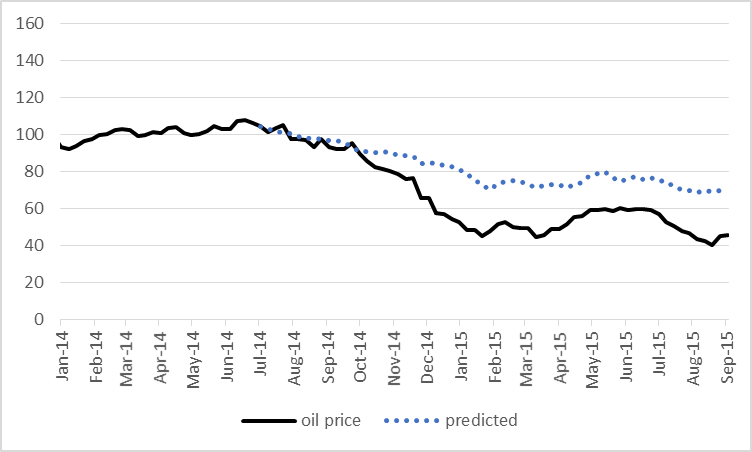
This doesn’t mean that you could have predicted in July 2014 that oil prices were about to plummet, unless you also somehow could have predicted that copper prices, long-term interest rates, and other countries’ currencies were about to do the same. But given what happened in global markets, much of what’s happened to oil prices is not that surprising.
You might try to make a case that developments in oil markets are the cause of the moves in the other variables. The growth in U.S. oil production will ease the trade deficit, which would be one factor in a stronger dollar. And the decline in oil prices will help keep inflation low, which contributes to a lower nominal interest rate. But I believe any such effects could only be a very minor part of the movements we’ve seen in interest rates and the exchange rate. Instead, the real story has been weakness of the world economy. I therefore interpret the above calculations as telling us that gains in oil production from the United States and OPEC are only part of the reason that the dollar price of oil has fallen so much over the last year and a half.
If you’re curious to use calculations like these to take a look at other starting and ending dates, this little tool developed by Ironman makes it easy to do. Just input the four prices at your chosen starting date and ending date and press calculate. It’s set up with default values (if you just press “calculate” yourself without entering any numbers) to reproduce the calculations I just described based on the change in prices between July 4 and September 4. And below the tool you’ll find some self-updating widgets to follow the current prices. Enjoy!
Commodities are powered by Investing.com
So, does excess demand make prices go up and excess supply make prices go down or vice versa?
It’s not surprising that “excess” is relative to the economic conditions.
Bruce Hall,
Perhaps you better define “excess” demand and “excess” supply. Strikes me that you are channelling a Soviet-style industrial board.
Futures leverage and the cyclical self-similarity of technical indicators have an R^2 of more than twice the level presented. Consequently, the technical stop of WTI $39 was recently achieved, with the next stop at $32. Should there be a monthly close occur below WTI $32, $24 is the next technical support.
Resistance is at $58-$62, but this level will prove to be a hard constraint for real GDP per capita with the 4-qtr. average rate having decelerated to near the historical “stall speed”, as has global real GDP per capita.
The global economy had been weakening since 2012. This is nothing new. Just another mispriced asset market like since the beginning of all markets. If the fall from 2011 had been orderly, it wouldn’t be a real market!!!!
Menzie wrote:
“Increases in oil production in the United States and the Middle East were certainly key factors in the huge drop in oil prices over the last year.”
Don’t you have this backward? Actually, huge drops in oil prices have reduced production. Reductions in production would tend to lower supply and tend to creare higher prices than if the supply did not change.
Understanding this gives us the answer to your second sentence.
“Nevertheless, one can’t help but be struck by the fact that the weekly changes in oil prices correlate with dramatic moves in other commodity and financial markets.”
We would expect overall commodity prices to drop – especially oil – with an appreciating currency.
Menzie wrote:
“This doesn’t mean that you could have predicted in July 2014 that oil prices were about to plummet, unless you also somehow could have predicted that copper prices, long-term interest rates, and other countries’ currencies were about to do the same. But given what happened in global markets, much of what’s happened to oil prices is not that surprising.”
Oh, but there were many forecasting a drop in oil prices due to the appreciating dollar (me for one). But understanding the depreciating US dollar and the moves by other CBs to maintain at least some parity to reduce the US currency gains your last sentence is totally correct.
Ricardo FYI….Menzie did not write this post. Try to keep up.
Oh my! I can’t believe it. Professor Hamilton wrote a post that sounded just like Menzie. My mistake…and my surprise.
I watch the CRB:Index of Industrial Raw Material prices –it excludes energy — the way you watch copper. The CRB and copper have a correlation of some 0.98-0.99.
You should compare the change in the CRB, oil and copper to the monthly world industrial production calculated by the NETHERLANDS BUREAU for ECONOMIC POLICY ANALYSIS ( http://www.cpb.nl/en/world-trade-monitor)
The annual change in these variables with oil are all very highly correlated
In other words, copper and the CRB serve as a real time proxy for world industrial production and the world demand for oil.
Scott Sumner might point out that we are reasoning from price changes.
As I recall, shale oil production has moved the trade deficit by 2% of GDP since 2012. I believe this is not a small adjustment.
The OECD seems to be doing fine. OECD oil demand is up 800 kbpd over last year, and I am still trying to find another 300-400 kbpd of refined products in the OECD which have disappeared, statistically speaking. So OECD demand growth could be up as much as 1.1-1.2 mbpd, depending on where those missing barrels end up. No visible weakness in the demand in the OECD.
The global economy, ex-China and China-derived demand (eg, Brazil, Australia, Indonesia, Canada, Norway, and some other commodity exporters) is doing fine. So if we’re talking weakness in the global economy, we’re talking about weakness in China. And if we’re talking weakness in China, we’re talking first and foremost an over-valued yuan. See the second graph (“Rush to Exit”) in the article below, and tell me the yuan doesn’t need a write-down. And note flight of capital from China corresponds to the collapse of the oil price, the devaluation of other currencies against the dollar (excluding China), and that in turn corresponds to the acceleration of shale oil production in Q3 2014.
One could argue that China collapsed just as shale oil production was accelerating, but that seems a bit too coincidental.
http://www.bloomberg.com/news/articles/2015-09-11/these-four-charts-show-how-obama-s-leverage-over-xi-is-increasing
I have written an analysis of the impact of shale oil production on the US trade deficit, and by implication, the dollar exchange rate.
Find it here: http://www.prienga.com/blog/2015/9/15/impact-of-shales-on-the-us-trade-deficit
“A Fiscal Policy Rule for Oil Exporters”.
My uncle, noted emerging market macroeconomist and bête noir of the Orban government in Hungary, asked me if I could suggest a rule for planning government expenditures for oil exporting countries.
Here it is. http://www.prienga.com/blog/2015/9/15/a-fiscal-policy-rule-for-oil-exporters
Here are the mathematical facts of life regarding net exports:
Given an ongoing, and inevitable, decline in production in the net oil exporting countries, unless the exporting countries cut their liquids consumption at the same rate as, or at a faster rate than, the rate of decline in production, the resulting rate of decline in net exports will exceed the rate of decline in production and the net export decline rate will accelerate with time.
In addition, while we are currently seeing signs of weak demand in China, given an ongoing, and inevitable, decline in GNE*, unless China & India cut their net oil imports at the same rate as, or at a rate faster than, the rate of decline in GNE, the rate of decline in the volume of GNE available to importers other than China & India will exceed the rate of decline in GNE, and the rate of decline in the volume of GNE available to importers other than China & India will accelerate with time.
For example, from 2005 to 2013 the rate of decline in the volume of GNE available to importers other than China & India (2.3%/year) was almost three times the observed rate of decline in GNE from 2005 to 2013 (0.8%/year).
And a massively under-appreciated aspect of what I call “Net Export Math” is that the rate of depletion in the remaining cumulative volume of net oil exports, after a net export peak, tends to be enormous. Saudi Arabia is showing a year over year increase in production and net exports, but based on available annual data through 2014, Saudi Arabia’s net exports fell from 9.5 MMBPD in 2005 to 8.4 MMBPD in 2014 (total petroleum liquids + other liquids), and I estimate that Saudi Arabia may have already shipped close to half of their total post-2005 supply of cumulative net exports of oil.
*Global Net Exports of oil, Combined net exports from (2005) top 33 net oil exporters
Steven,
I always love your analysis because it is sound, but I differ on the driving force. You see oil prices as driving exchange rates (somewhat) and I see exchange rates driving oil prices. If we look at oil prices prior to the world currencies break with gold oil prices were amazingly stable. As a commodity oil tracked gold. After the 1960s when the link between the dollar and gold began to be destroyed by our government oil prices started to fluctuate. Then after Nixon made a total break with gold oil prices went crazy. The only time oil prices showed relative stability was during the Great Moderation when Alan Greenspan was using gold to determine the value of the dollar. Once he went away from gold (deflation in the late 1990s to 2000) the price of oil once again began its roller coaster ride.
The oil technologies being used today are actually not all that new. The difference is the price of oil supporting the technology. Once the supply and price imbalance works itself out the technology is no longer supported. As you noted many companies are going out of business.
Nothing demonstrates the destructive nature of floating currencies better than the boom-bust of the oil price, and nothing supports a stable currency value more.
I see US shale oil production as the principal differentiator between the US and other major OECD economies after 2011, both in terms of GDP growth, and in particular from 2014, in terms of exchange rate. Absolutely.
Oil prices surged after 1970 because US oil production peaked in 1970 and market power thereafter shifted to OPEC, which they employed in particular after 1979, when OPEC cut production by 13 mbpd over four years. This cut then became spare capacity, equal to 25% of consumption at the time. To consume such spare capacity required a generation, a period known as the Great Moderation, during which there were no major oil shocks–precisely because of all that spare capacity.
This spare capacity was materially eroded by the late 1990s, and definitively by 2003, when China started to draw heavily on global commodities. The oil supply stalled after 2004 because non-OPEC suppliers were unable to expand production, and OPEC suppliers were unmotivated to do so. As we really did not discover much new oil after 2005, increasing non-OPEC production would depend chiefly on technological innovation, that is, the more clever exploitation of formations already known to exist. Two of these were the Bakken and Eagle Ford, both well known for over a century, but both considered failed oil systems, in that no one was able to figure out how to exploit them economically.
With persistent high oil prices, the industry was given an incentive to develop new technological approaches to develop these and other similar resources. Thankfully, the efforts paid off, and both Eagle Ford and Bakken, and more recently the Permian, became critical sources of increased oil, both in domestic and global terms. It is true that neither horizontal drilling nor fracking were new per se, however, the economical application of these technologies to scale oil extraction was–and frankly, is–still new. For example, new wells per rig has doubled in the Bakken since the beginning of just this year! We’re still learning how to better exploit these resources. Thus, while the constituents of shale drilling were not new, the package as a whole was. This, along with the smart phone, constituted the major technological innovations of the last decade, and both were essentially adaptations of existing technologies into new forms. They were revolutionary nonetheless.
I do not know how long shale oil could last. Most of the breakevens I have seen are in the $62-75 / barrel range, which is still a quite favorable number. For now, I assume shale will be viable at some reasonable price. We will probably not know until 2017 what US shale oil can really do. If it lives up to its promise, the US economy will be riding high for the next few years.
US shale oil, directly and indirectly, caused the collapse of oil prices and greatly reduced the US trade deficit. With terms of trade dramatically improved, it should come as no surprise that the US dollar appreciated.
The problem is that Chinese policy-makers have not properly understood this event and unnecessarily view a yuan devaluation as representing a kind of policy failure. Thus, they have thus not devalued the yuan in line with other non-US currencies, with the result that their export and industrial sectors are struggling. They are also suffering a massive outflow of capital, which began pari passu with the collapse of oil prices, ie, with the improving terms of US trade. This sense is reinforced by the Chinese consumer sector which (depending on whether I believe Cowen or Sumner) is doing pretty well, and that’s exactly what we would expect with an over-valued currency. Importing consumers will be subsidized at the expense of exporting producers.
So, I believe that shale oil has improved US terms of trade, explaining dollar appreciation, on the one hand, and the policy predicament of China, on the other.
Steven wrote:
“Oil prices surged after 1970 because US oil production peaked in 1970 and market power thereafter shifted to OPEC, which they employed in particular after 1979, when OPEC cut production by 13 mbpd over four years.”
After Nixon floated the dollar the OPEC countries saw their dollars crash but they were committed to holding down oil prices to maintain their market share by keeping out competition. Finally, their losses on their dollars overwhelmed them and they raised oil prices back to parity with the dollar. The OPEC increase in oil prices was not supply driven but monetary.
Good article by John Kemp on global decline rates:
Kemp: Decline Rates Will Ensure Oil Output Falls in 2016
http://www.rigzone.com/news/oil_gas/a/140623/Kemp_Decline_Rates_Will_Ensure_Oil_Output_Falls_in_2016/?all=HG2
My comment:
And as I have frequently noted, it’s very likely that actual global crude oil production* has been flat to down since 2005, despite trillions of dollars in upstream capex. Therefore, given cuts in upstream capex, it’s reasonable to expect a decline in global liquids production to be most pronounced in regard to actual crude oil production–the quantity of the stuff that corresponds to the global oil price indexes.
Link to a comment with some graphs in regard to crude oil versus gas, crude + condensate and natural gas liquids (NGL):
http://peakoilbarrel.com/jean-laherreres-bakken-update/comment-page-1/#comment-534101
*Most commonly defined as 45 API gravity and lower crude oil
CNBC reports (9/16/15) that US special forces are on the ground in Syria, advising Kurdish forces
At the same time, Russia is reportedly moving ground forces into Syria:
http://www.reuters.com/article/2015/09/09/us-mideast-crisis-syria-exclusive-idUSKCN0R91H720150909
The talking heads on CNBC were speculating about what if ISIS starts systematically targeting oil production facilities in the Middle East.
I think the oil price decline drove the copper price decline more than the other way around. Oil producers tend to use high oil prices to fund construction which requires copper, and as the oil price fell they’ve cut back. China’s slowing construction on the other hand is not much of a downward pressure on oil.