World field production of crude oil increased 2.9 million barrels a day in the 12 months ended last July. That compares with a 3.6 mb/d increase over the entire nine years from Jan 2005 to Dec 2013.

World field production of crude oil in thousands of barrels per day, Jan 1973 to July 2015. Data source: Monthly Energy Review, Table 11.1b.
The biggest single factor is Iraq, where production is up almost 1.1 mb/d over the last year. Although ISIS has managed to bring cruelty to much of the rest of the world, so far they have not disrupted Iraqi oil production.

Iraq field production of crude oil in thousands of barrels per day, Jan 1973 to July 2015. Data source: Monthly Energy Review, Table 11.1a.
The second biggest factor in the 2.9 mb/d gain was the United States, where production increased 0.6 mb/d July 2014 to July 2015, thanks to the tremendous success of shale oil, or production based on horizontal fracturing of tight geologic formations.

U.S. field production of crude oil in thousands of barrels per day, Jan 1973 to July 2015. Data source: Monthly Energy Review, Table 11.1b.
But that is going to change. The EIA Drilling Productivity Report tabulates detailed summaries of drilling and production in the main U.S. counties that have been responsible for the shale oil revolution. One of the interesting statistics is their calculation of the change in “legacy” production. To get this, the EIA tabulates production in these counties coming from wells that had been in operation for two months or more as of August, and then looks at how much was being produced by these same wells in September. This calculation comes out to be a drop in production of those legacy wells of some 330,000 barrels per day between August and September. The EIA series for the change in legacy production each month is plotted below. If we were relying only on historical wells without drilling new ones, U.S. shale production would fall about a million barrels/day every three months.
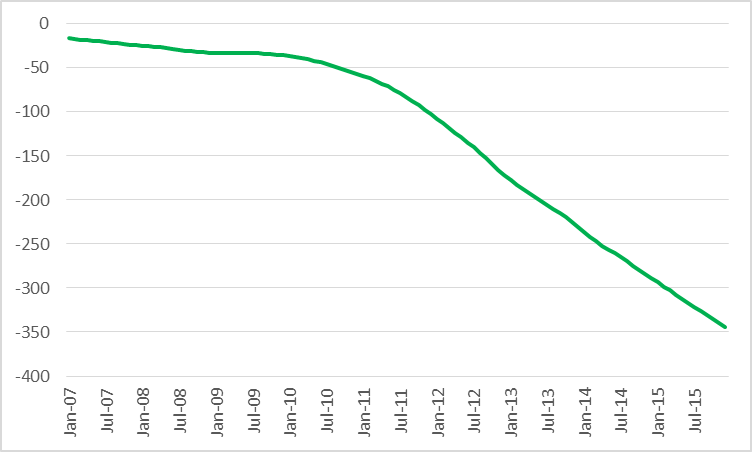
Monthly change in production of oil from “legacy” wells (2 months or more in operation) in counties associated with the Permian, Eagle Ford, Bakken, and Niobrara plays, monthly Jan 2007 to Dec 2015. Data source: EIA Drilling Productivity Report.
Drilling hasn’t stopped but it has been cut back significantly.
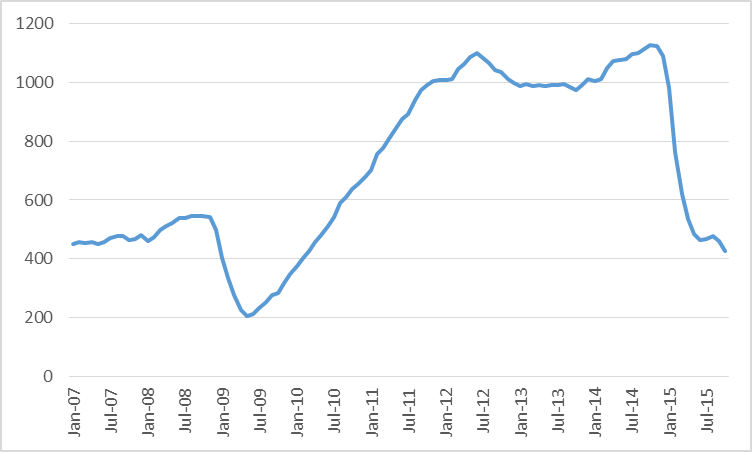
Number of active oil rigs in counties associated with the Permian, Eagle Ford, Bakken, and Niobrara plays, monthly Jan 2007 to Oct 2015. Data source: EIA Drilling Productivity Report.
Production has not fallen as dramatically as many of us has anticipated thanks to remarkable ongoing gains in productivity. Even so, the EIA estimates that U.S. shale oil production will be half a million barrels a day lower in December than it had been in June.
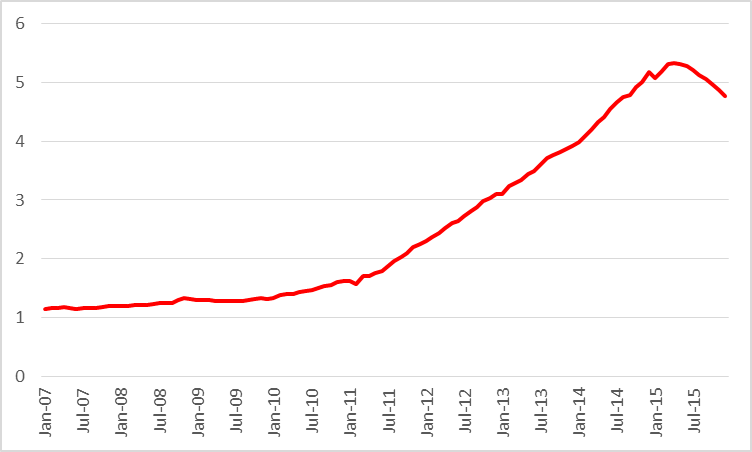
Actual or expected average daily production (in million barrels per day) from counties associated with the Permian, Eagle Ford, Bakken, and Niobrara plays, monthly Jan 2007 to Dec 2015. Data source: EIA Drilling Productivity Report.
And it will fall further. The five biggest pure players among U.S. shale oil producers could be EOG, Pioneer, Devon, Whiting, and Continental Resources. Between them, these companies may account for about a fifth of total U.S. shale oil production, and between them they have lost $25 billion so far in the first three quarters of 2015.
Eventually this adjustment will bring crude oil inventories back to more normal historical levels. But we’re not there yet.
U.S. commercial crude oil inventories. Source: EIA.
Shale and tar oil extraction was always a function of Peak Oil (that is widely believed to be refuted) and was never ecologically or economically sustainable. As a consequence, the bubbles in energy sector junk debt and bank loans to the energy and energy-related transport sectors, including commercial real estate, will collapse and have to be bailed out by trillions more in Fed printing, along with subprime auto and student loans, munis, local and state pensions, and bank and insurers’ debt and equity.
By the time the debt-deflationary dust settles in the years ahead during ongoing secular stagnation, liquidity trap, risk aversion, and liquidity preference, the Fed’s balance sheet will reach parity with bank loans (after charge-offs and run-offs), effectively eliminating fractional reserve lending at a discount rate of ~0% and asset and price deflation along the way.
The oil/commodities cycle and Long Wave implies WTI in the $20s-$30s in the years ahead along with ~0% trend growth for real GDP per capita and US oil production falling to 5-6Mbd and oil consumption falling at least 2-3Mbd.
The energy states are in recession, but unlike during the previous energy sector bust during a disinflationary/reflationary regime, the incipient bust is occurring during a debt-deflationary regime that will result in an unprecedented consolidation in the energy and industrial sectors, as well as decelerating real GDP per capita forcing mass cross-industry consolidation in health care, tech, hotels/resorts/casinos, restaurants, and further consolidation in financial services, insurance, airlines, trucking, media, energy, etc.
The industry sectors experiencing the largest disruption and scale of consolidation will be the fastest-growing sectors of the past 20-30+ years: health care, education, financial services, legal, retail and food services, and gov’t, of which 65-85% of employment is held by females.
Finally, private and public pension and benefits are currently based on actuarial assumptions of 6.5-8% return on assets when the likely return will be 0-2% with cyclical drawdown for higher-beta assets of 35-50%+, implying that pension and benefit payouts will be cut 25-30% in the next 5-10 years and as much as 50% by the 2020s-30s, requiring workers in the meantime to increase contributions, local and state taxes to soar, or a combination in order to avoid similar cuts.
All of these factors are a function of Peak Oil, overshoot, excessive debt to wages and GDP, a record low for labor share, regressive payroll taxes, extreme inequality, climate change, globalization, and LTG/EOG, and the results will become increasingly apparent as peak Boomers begin to draw down on private assets and public transfers beginning effectively today and persisting through the early to mid-2020s.
1. Crude oil stocks in the US are a little bit of a local peculiarity (export ban, Jones Act, LTO versus complexes coker style refineries, and just geography [Cushing versus Gulf, plus the oceans themselves]). On the world stage what matters is world inventory. The situation there is maybe less tight than in the US.
BTW, I think storage is over-reported because it’s more accurate/objective of a metric than most production and consumption estimates (anything other than just price). But most inventory has to do with operational reasons and there are some definite constraints on how low/high it can get. Plus it gets much more complex and large if you really look at the whole supply chain (from DUC wells, to onsite, to pipelines, to ships, to terminals (sometimes more than once), to refinery onsite, to refined products at the refinery, terminals, shipping, and retail. (See the excellent recent article by John Kemp with diagrams).
http://www.reuters.com/article/2015/11/20/oil-storage-kemp-idUSL8N13F2MV20151120#JG2O81y3Q1SsLkfY.97 (diagrams are linked about halfway down).
If you start getting floating storage than you know that something is really going on with a glut. Nobody is building a terminal or even a crude tank because of a monentary contango structure. Yeah people may top off a little and they love talking about it since it makes them sound like a bunch of arbitrage trader types…but most storage is based on operations…that’s what supply chains and inventory are for! In general, price just moves and incentivizes near term usage enough to clear the market.
2. JH’s first chart is interesting. The “undulating plateau” versus the whole curve in retrospect looks trivial in the same way as the global warming pause (versus the 70 year record of warmup). While we shouldn’t be chartists, if we are (and probably we all are to some extent), then it’s important to not let one’s bias affect interpretation of a trend. [I am amazed how often some peak oilers will blow up a chart to take the zero access off, see some little dip, and then make conclusive statements like ‘Russia peaked in 2013’.]
3. Given the current decent prices of $40 or so and a strip that extends to $60 in 10 years (~$50 in constant dollars), it is pretty hard to believe in some vision of peak oil scarcity. At least as recently espoused by hard core peak oil analysts (Campbell, Simmons, Staniford, etc.) [And I’m not even talking about the apocalyptic fringe.] Even the more lukewarm peak oil types (e.g. Hamilton with hundred to stay and Kopits with the defense of it) have been proved wrong by events. [At least for now, but if the strip works out…then in general.]
3.1. N.B. None of this is to take an extreme cornucopian view either. After all we did have the pause, did have 100 for 4 years. Adelman phrased it best when saying that depletion moves the supply curve to the left and knowledge moves it to the right. Obviously both factors occur and this is why exhaustion concerns have existed since the beginning of the industry. But it’s important not to be over drawn in by the apparent scienceyness of the Hubbert style analysis and ignore the other factors, which have resulted in increasing production for the last 150 years also. [Adelman also makes some excellent points about how the imperfectly functioning cartel affects volatility because of the market needing to guess on the efficacy of the cartel, not even just the actions of the cartel.]
3.2. Recent events show the importance now, as in 1980s of encouraging non-OPEC production to keep prices down. “Drill baby drill” worked for the rational reasons one would expect it to as a businessman (if your suppliers are too expensive or show oligopolistic tendencies, you encourage new entrants to your supplier base.) There are even many cards we could still play: ANWR, federal encouragement of infrastructure buildout (rather than the reverse), Keystone pipeline, VACAPES drilling, Alaska offshore encouragement (the Feds refused to let Shell drill two test wells at a time, even with that huge flotilla), relaxing Iran/Russia sanctions, and allowing the sale of grey market oil (Kurds, Libyan separatists, ISIS).
3.2 addendum. And the non OPEC bbls are not just important as extra bbls at the margin of an inelastic demand price structure. They’re even important in terms of destabilizing OPEC and encouraging Gulf states, SA in particular, to pump all out.
Nony, we have had the shale oil and tar booms/bubbles (and incipient busts) BECAUSE OF Peak Oil and peak world oil supply per capita occurring a decade ago to date, C+C per capita not much higher than in 2001, and US oil production per capita down 45% since 1970.
Since 2005-08, the Fed has printed over $3 trillion in bank reserves and the US gov’t has borrowed and spent a cumulative $8 trillion (45% equivalent of GDP and nearly two-thirds equivalent of private GDP) just to get US real private final sales per capita back to even in 2006-08.
How much have the shale oil drillers borrowed and spent since 2008-09? How much have they produced? Profits? Recoverable reserves at $42 WTI?
Most claim that Peak Oil has been refuted because they don’t actually understand Peak Oil and how it manifests. Most will not see that financial crises, fiscal constraints, currency crises, debt defaults, labor underutilization, decelerating productivity, recession, failed states, mass population migration, and war are direct and indirect effects of Peak Oil, population overshoot, resource depletion per capita, and “Limits to Growth”.
Peak Oil per capita is history, i.e., it’s a decade and counting behind us in the rear view mirror.
i’ve been waiting for production to fall too, but the weekly reports show it sitting in the same range near or over 9.1 million barrels per day for the last 10 weeks….any drop in production will be met with rising prices, which will bring the DUCs into play…latest report says there are 1000 oil wells in the Bakken that have been drilled but not fracked, as producers wait for higher prices; earlier this year, it was reported there were 1,400 such “drilled but uncompleted wells” in the Eagle Ford, so the drop in the rig count in those plays will barely make a dent..
You can think about different tranches of supply at different price points. Currently, US LTO turning back on (into a disco party) basically limits the market and prevents prices from sustaining much over $80 or so. Similarly, oil sands do as well. US LTO is more responsive, but oil sands are extremely large and if allowed to be developed freely in Canada and Vz will provide many years of world supply. At a more extreme level, at some point kerogen conversion becomes economical ($200?) and then another huge tranche would come on and prevent sustained prices higher.
Even this view (of a cost curve of resource) is an advance over the simple Hubbert view which just looks at total resource and doesn’t say “what resource at what price”. But a further sophistication is the point of Adelman that it is not only a simple idea of eating away tranches of cheap oil and moving to expensive oil. That knowledge (production technology such as EOR or fracking or even just geology learning) can actually grow the accessible amount of oil at a particular price point.
Much actually depends on the ability to hedge oil production by the producers; given that the speculators are running out of collateral, the producers will not be able to hedge their output the way they have been able to do in the past. Once that settles, there is only one way to go, cut oil output in a big way. That would eventually settle the prices upwards. But this is likely to be faster given the direction of the interest rates, which also cannot support inventories the way it has done in the past.
They can hedge but it only protects them from dropping below the current price and strip. Which is already a pain point.
Plus there is a cost of hedging in margin requirement. Besides CAPM argues that investors can diversify risk themselves more efficiently and that producers should b e exposed to the market. Not see peculating via hedges.
“Low Crude Prices Catch Up With the U.S. Oil Patch”
http://www.nasdaq.com/article/low-crude-prices-catch-up-with-the-us-oil-patch-20151120-00792 (from the John Kemp daily email of energy stories)
US rig count is down to 561. Genscape predicts us getting to 400 by the end of 1Q2016. Pain, pain for producers.
But, I sure enjoy that sub $2 gasoline!!!
just filled up at $1.67/gal at costco. i guess i am willing to let the pain for the producers linger a while longer.
What the EIA calls “Crude oil” is actually Crude + Condensate (C+C). The most common dividing line between crude and condensate is 45 API gravity. The two principal global crude oil price indexes, Brent & WTI, refer to crude oils with an average API gravity of less than 40 API.
So, when we ask for the price of oil, we get the price of actual crude oil, but when we ask for the volume of oil, we get some combination of crude oil + condensate + natural gas liquids (NGL) + biofuels + refinery gains.
A chart showing API gravity versus sulphur content for 16 global crude oils:
http://i1095.photobucket.com/albums/i475/westexas/APGravityVsSulfurContentforCrudeOils_zpsc28e149c.gif
As I have periodically noted, in my opinion the only reasonable interpretation of the available data is that actual global crude oil production (45 API and lower gravity crude oil) has been approximately flat to down since 2005, while global natural gas production and associated liquids, Condensate & Natural Gas Liquids (NGL), have (so far) continued to increase.
Following are some available annual rate of change data for global production metrics and for OPEC (EIA data). We have crude oil only data for only OPEC and Texas, although the EIA estimates that US condensate production increased by about one million bpd from 2011 to 2014. Incidentally, EIA monthly data (April to September, 2015) indicate that US C+C production declined at an annualized rate of 13%/year.
Regarding US and global C+C inventories, I suspect that we are seeing is a global condensate glut, and I suspect that US refiners, in late 2014, pretty much hit the limit of how much additional condensate that they could take, if they wanted to maintain their distillate output. For example, Reuters had an article earlier in the year documenting case histories of refiners increasingly rejecting “toxic” blends of heavy crude + condensate that were deficient in distillate content.
Global Gas, NGL & C+C 2005 to 2013/2014 Rates of Change
(EIA, 2013 for gas, 2014 for other data)
Gas: +2.6%/year
NGL: +2.6%/year
C+C: +0.6%/year
OPEC Gas, NGL & C+C and OPEC Crude Only 2005 to 2013/2014 Rates of Change
(EIA + OPEC, 2013 for gas, 2014 for other data)
Gas: +5.1%/year
NGL: +1.3%/year
C+C: +0.2%/year
OPEC Crude Only Data: -0.2%/year
Implied* Condensate: +8%/year
*EIA C+C less OPEC Crude Only
Link to more detailed essay & graphs and discussion:
http://peakoilbarrel.com/worldwide-rig-count-dropping-again/comment-page-1/#comment-546170
Excerpt:
Condensate is associated oil from a gas well. It is a clear economic substitute from crude in terms of price correlation and is physically treated as a light oil.
Eagle ford 47 api oil comes out of oil wells as determined by the phase diagram and Texas law.
James should call out the economic fallacies of equating lease condensate with propane. And your cut and paste comments ruin any discussion.
Nony,
You get less diesel when you distil EF condensate than you would distilling a true WTI. Diesel does the heavy lifting in our economies. The rich middle has been taken out of the “Oreo” of the crude slate. The Bakken and Eagle Ford LTOs were too light for the gulf coast oil refineries to chew on as they were engineered to digest much heavier crude.
Condensate is not crude oil.
You get lots of gasoline instead which is the premier product. Cond runs THROUGH a distillation tower. It is blended with other crudes. It’s price is regularly listed in lists with WTI, etc. in specialist price cards. It is stored in crude tanks. It goes up and down in price when WTI does. It is NOT propane!
Oh…and it has almost no sulfur. Somehow the peak oilers have gone from complaining about all the heavy sour stuff as they did in 2005 to thinking
it is better the heavier (and sourer) it gets! You do know it costs money to remove sulfur right?
And lease condensate is generally ~60 API. So all the fussing about 47 API EF is silly.
Eagle Ford What Are You?
http://allenergyconsulting.com/blog/2015/02/19/eagle-ford-who-are-you/
“Condensate is a crude oil – just a really light crude oil.”
“TOKYO — Prices for condensates, superlight oil recovered mainly from natural gas reservoirs, are stuck in high gear in Asia amid growing speculation that its demand as a petrochemical industry feedstock will increase. Condensate prices typically move in tandem with the Dubai oil benchmark. Until two years ago, they stayed around $2 a barrel below Dubai crude. But over the last six months, the pattern has inversed, with condensates hovering $2-3 above the benchmark.”
http://asia.nikkei.com/Markets/Commodities/Condensates-locked-at-high-prices-in-Asia
That’s not a substitute?
Liquids over an API gravity of 42 can’t be used to satisfy WTI contracts at Cushing (see “Dumbbell” crudes article below, which discusses the problems with synthetic WTI blends of heavy oil and condensate).
But in any case, my argument is not over the relative qualities of actual crude oil versus condensate.
My argument is that the available data suggest that actual global crude oil production (45 and lower API gravity crude oil) has been approximately flat to down since 2005, while global gas production and associated liquids, condensate and natural gas liquids, have (so far) continued to increase, as annual Brent prices increased from $55 in 2005 to an average of $110 for 2011 to 2013 inclusive (remaining at $99 in 2014).
And medium and low API crude can’t be used for WTI either. condensate is entrained crude in a gas stream. Associated gas is dissolved gas in an oil stream.
Wells can even change phase over the course of life of a well. While condensate is typically lighter than crude, it is technically possible to have a condensate at a higher api than crude. It us also possible to have genuine oil wells that are over 45 api. Eagle ford in Texas. Tapia in Indonesia.
Condensate is just a super light crude. It comes from the same biological sources. Is a mix of different hydrocarbons requiring distillation etc. If you look at Texas law you will even find times they call condensate crude oil. See the definition of dry gas for instance. Similarly us export controls treat lease condensate identically to crude oil.
This is just peak oil game playing. Liquid hydrocarbons come in a spectrum of densities. God did not come down and say 45 api was the boundary. And 10 years ago lease condensate sold at a premium to wti. Yeah we have more now than expected and have a mismatch with Coker refineries. Exacerbated by the export ban. But the funny thing is peakers complained we would not have enough light oil 10 years ago. Ha ha ha!
Oh…and notice the continued ignoring of the benefit of low sulfur.
Anyhow playing these games with slicing by density is just evasion. Heck.. I can define 40 to 45 as the holy grail. And we have more of that in the us than 5 years ago!
Tapis not Tapia. Stupid autocorrect. It’s sweet but not quite dessert flavored.
Second para second sentence should be lower, not higher. Coker is not capitalized either. Latter I blame on “smart” phone. Former was operator error. 😉
There have been some downward revisions to preliminary weekly EIA C+C production numbers for the US this year, as the monthly data are released, which I suspect is a pattern that we will see if the US C+C production decline continues. In any case, at the 4/15 to 9/15 annualized rate of decline in US C+C production, it would be down to about 8 million bpd in September, 2016, versus 9.6 million bpd in April, 2015.
Note that when drilling activity slowed considerably in the Haynesville Shale Gas Play, the observed net rate of decline in Louisiana’s marketed natural gas production (from both conventional + shale gas sources) was a two year exponential rate of decline of 20%/year from 2012 to 2014. This was the net rate of decline. The gross rate of decline from existing wells in 2012 and 2013 would have been even higher than 20%/year.
In regard to US refineries:
U.S. refiners turn to tanker trucks to avoid ‘dumbbell’ crudes (March, 2015)
http://www.reuters.com/article/2015/03/23/us-usa-refiners-trucks-analysis-idUSKBN0MJ09520150323
Subject: COLUMN-U.S. crude inventories might be tighter than they look: Kemp (September, 2015)
http://uk.reuters.com/article/2015/09/08/usa-crude-storage-kemp-idUKL5N11E2YE20150908
Latest from me on vehicle miles traveled, at CNBC
http://www.cnbc.com/2015/11/23/traffic-is-getting-worse-heres-how-to-trade-it-commentary.html
And the one before it, in which I essentially review the BoE version of Jim’s ICE oil price model.
http://www.cnbc.com/2015/11/13/why-oil-could-rally-big-in-2016-commentary.html
Nice articles Steven.
1. For traffic the problem is exacerbated by neoliberal behaviors. Building subway instead of buses. Gov lanes and expensive entrance bridges instead of just widening roads. And in previous decades actually arguing against building roads out of a belief that congestion keeps evil cars at bay. Then later crying about congestion. Like new Englanders with their winter heating bills and pipeline obstruction.
2. How big is a big price rally and compare it to the strip please. BTW I would look at sold production numbers for insights on pricing. After all the price for producers is impacted by that regardless if storage or refining. But in any case “demand” defined as consumption by refineries is sharply uo regardless.
Regarding a price rally: Keep in mind that we have several models we can use today, and these don’t necessarily lead to the same conclusion.
However, a commodity-driven model like the BoE’s or Jim’s ICE (interest, copper, exchange rate) model suggests that 60% of the decline in oil prices is attributable to demand weakness. If we allow that oil prices have fallen by $60, then $36 (60% of $60) is attributable to demand weakness. If China ‘turned around’ (whatever that means, exactly), then presumably oil prices would rise by $36 / barrel. Do you believe that? Not sure I do, but it’s hard to argue against across the board weakness in commodities.
Speaking of the BoE, here’s an analysis of Mark Carney’s climate claims (long). The BoE climate report was as weak a piece of analysis as I have seen in a long time. http://www.prienga.com/blog/2015/10/9/fact-checking-mark-carneys-climate-claims
Jim’s ICE model is here: (https://econbrowser.com/archives/2015/01/whats-driving-the-price-of-oil-down-2)
Kewl.
Yeah. I think more micro insights are needed rather than just macro correlation arguments. After all q is up for oil and presumably down for metal.
Also for China was the 10 pct growth an aberration or is the 5 pct growth an aberration. Economic history would seem to say 10 pct is not sustainable for decades. But in any case demand growth is still growth. So supply is exceeding demand. Only if you can argue the indifference price curve shifted can you argue that demand dropped. I doubt that for a country growing still. And especially growing in consumer sectors lately over industry. Plus China is just a fraction of the oil market in consumption.
First, China has to be implicated. The US is strong, Europe is recovering. Meanwhile, China is the single most important driver of incremental commodity demand growth. It’s fairly inconceivable that demand would be weak if China’s demand was strong and the OECD was not in recession.
You note: “Only if you can argue the indifference price curve shifted can you argue that demand dropped.” That’s the weakness of the ICE or BoE model exactly. If quantity has not fallen, as it would normally during a recession, then we’re forced to argue that Chinese tastes changed overnight. That is highly improbable.
So then either the ICE model is wrong or we’re arguing a special case. And we have one more piece of data to help us. We know that the supply and demand effects are essentially concurrent. This gives us the very strong suspicion that the supply effect must be driving the demand effect. There is only one cause, but two manifestations.
So what happened on the Chinese demand side related to the collapse of the oil price? Well, we know that, too. China failed to devalue the yuan with improving US terms of trade. So China tanked its export markets, creating recession-like symptoms, but with these essentially limited to its manufacturing and export sectors. And that’s what we see. So the demand effects are real, but they are the result of a policy mistake in China. That’s the logic of the issue I think.
And I’d add it was this article that Menzie declined to review.
nony,
“Gov lanes and expensive entrance bridges instead of just widening roads. ”
you cannot simply widen roads to increase capacity. its not as simple as widening the pavement. you need to increase your right of ways. on/off ramps need to be rebuilt. most bridges do not have expansion capacity, so you need to rebuild the bridges along the entire stretch you intend to widen. at some point, you will need to entertain the idea of double decker highways to add the desired lanes. it is rather sensible to find some solutions which decrease the demands on the existing highways rather than continue to expand. hov and subways are excellent tools in this regard. i think the self driving cars of google, apple, tesla et al are going to be an unforeseen game changer in this area. computer algorithms will produce far more efficient commutes than brain dead drivers with road rage. they will also improve gas mileage compared to the heavy footed drivers on the road today.
Read the article, and then comment, Baffs.
http://www.cnbc.com/2015/11/23/traffic-is-getting-worse-heres-how-to-trade-it-commentary.html
steven, your article is right on several fronts. we have clearly neglected infrastructure spending, for a couple of decades now. on the transportation front, this will hit us from two ways. functionally, we do not have appropriate infrastructure to meet current and future demands appropriately. continued increase in miles travelled, especially per capita, will be hindered by this loss in functionality. more glaring, however, is the fact that safe life of many elements of our transportation infrastructure is now being exceeded. work is being done to squeeze a little more life out of these systems safely, but each passing day renders the system more functionally obsolete. unfortunately, at present we have too many in congress who are blind to the need to rebuild this infrastructure for the future. the cost, planning and time line for such work is enormous, and every passing day puts us that much further behind.
because we have so much anti politicking in government today, i do not anticipate the ability to adequately expand our transportation systems to meet future demands. many metro areas are growing every year, and new road construction is not keeping up. the best alternative, is to pursue solutions which help to slow the demand for road miles, especially in our cities. subways, hov, self driving cars, etc will all help control the demand for road miles in the cities.
steven, in your article you state “This constitutes an unprecedented loss of mobility for American society,” in reference to the drop in miles driven since the great recession. i am not so sure this is truly a loss of mobility. it is more likely a result of improved efficiency. a decade ago, i could easily put 30k miles a year on a car. now i don’t even put 10k. my position in life is much better today, allowing me to locate work and home much closer. but other things have happened in society which decrease miles driven. we significantly expanded out the retail and shopping base, so people could still shop, but drive far fewer miles to get there. growing up, it was a 45 minute drive to the nearest mall. over the last couple of decades, i have always lived within 15 minutes. these events accumulate and reduce the need to travel. the push towards more urban environments (or suburban locales which mimic town centers) will continue to reduce auto demand. and as urban centers continue to grow, with congestion, people will continue to pursue ways to minimize wasted time on the road.
i think you and i will disagree on the value of increasing vmt per capita. you probably feel this is good-because it benefits the oil industry. i would rather us hold steady and be more efficient with our use of vmt. if an increase occurs, i would prefer it is because electric cars and self driving systems make us travel those additional miles more productively.
Baffs –
I posted VMT and VMT per cap back to 1970 on my blog (below). The loss in mobility, particularly after 2005, is really striking. If you had to give up your car for a month, do you think you’d do less? Almost certainly. That’s the source of economic stagnation.
http://www.prienga.com/blog/2015/11/24/vmt-and-per-capita-vmt
steven, nice plot. i notice 2 past years events. around 2000, you see a change in the rate of increase-we start to level off. we peak in 2005, and begin to drop. i am referencing per capita data. we had a drop in per capita before the financial crisis was even a thought-this still occurred during the boom heydays. so it seems to me, around 2000 we had a change in behavior which was rather distinctive, and in 2005, per capita rates actually dropped without recession. the great recession certainly slowed things down for several years, but judging by trends prior to the financial crisis, i am not sure you will see a robust rebound going forward. we will catch up on some of the lost years due to recession, but there already seemed to be downward pressure on the demand for vmt per capita. i think there has been a rather large change in the mindset of most people when it comes to vehicular travel-they are looking at alternative solutions. none of the past recessions produced such deep and prolonged reductions in vmt per capita. baby boomers probably drove past decades growth in vmt per capita-cars were in their blood. but as they age, i would expect less travel. and the next big cohort, millennials, seem to care less about a car unless it is an apple or tesla!
The way they did I-95 south of DC with the switching back and forth in direction and huge expensive flyovers is an abortion. Appeals to the techie neoliberal who thinks it’s so cute to have flexible directionality of two lanes. but the total space would easily take another total 6 lanes. And cost of the bridge work less than the massive flyovers! Then you have the dulles access highway (inner and outer parts).
Stein’s law says oil prices will rise: http://www.reuters.com/article/2015/11/23/oil-prices-kemp-idUSL8N13I37R20151123#wJl5uV2DGFS6XwrZ.99
” “If something cannot go on forever, it will stop,” according to Herbert Stein, former chief economist to U.S. President Richard Nixon (“What I think: essays on economics, politics and life” 1998). Stein’s law is one of the most simple but important statements in economic theory, yet it is remarkable how often it is forgotten.
Stein’s law explains why oil prices crashed from the middle of 2014 after spending more than three years over $100 per barrel (http://tmsnrt.rs/1SVIZk9). Most commentators now accept a price of $100 was unsustainable (though at the time there were plenty who predicted prices would remain at that level forever).
High prices were encouraging too much new production, especially from U.S. shale, while causing consumption to fall in the advanced economies and slow in emerging markets. The emerging supply-demand imbalance could only be resolved by a sharp price fall which was triggered in July 2014 after Islamic State fighters failed to seize Kurdistan’s oilfields and Libya resumed oil exports. In retrospect, all this is obvious…”
———–
Of course “Stein’s Law” is more of a philosophical statement than some statistical correlation. And Kemp goes on to say that one can have over-runs before corrections and no one knows when were a correction will occur. [Further one can think of examples like natural gas prices where the unsustainable does seem to have been sustained and we really have a state change.]
Saudi Arabia says ready to work with others to stabilise oil market:
http://www.reuters.com/article/2015/11/23/saudi-oil-cabinet-idUSL8N13I33520151123#3Xe7EX1sKraAVQw1.99
“Saudi Arabia’s cabinet said on Monday it was ready to cooperate with OPEC and non-OPEC countries to achieve market stability…Oil prices jumped $1 a barrel after the comments…”
—-
Granted it is only a small price move…but it was only a comment. Seems like the markets are aware of and influenced by OPEC even though they are an imperfect cartel.
This is the sort of thing I often hear from peak oilers: “Why “supply and demand” doesn’t work for oil”.
http://ourfiniteworld.com/2015/11/23/why-supply-and-demand-doesnt-work-for-oil/
In discussions, they are often ignorant of the most basic micro econ concepts (like an intersection moving along a demand curve because of a supply curve shift versus the demand curve itself shifting…just that basic concept of a slide versus a shift…to even discuss it!) Or they confuse micro economics with macro. Or they think somehow supply and demand makes you a Republican. Sorry…supply/demand functioned in the Roman Empire. If functioned in the USSR black market. It functions in crack cocaine and bootleg body parts and ISIS oil.
I’m also amazed that the person who wrote this piece, “Gail the Actuary”, is revered as some sort of super quant in the peak oil world. I (just Bayesian bettingly, not cruelly) would not trust her to set up a simple NPV model for a valuation. I mean, I may you may not like Milton Friedman or Krugman’s politics, but you can respect their ability to do (to have done) diff E Qs, stats, etc. etc.
Anyway, if supply and demand don’t work in oil, what’s next? Physics and chemistry not working? The whole peak oil scene smacks of advocacy and politics and religious thinking and justification. Rather than the curious attitude of an analyst, of a scientist.
BTW, here is a great example of supply and demand “working”:
http://www.cnbc.com/2015/11/25/reuters-america-column-us-traffic-is-growing-at-fastest-rate-since-1997-kemp.html
Stuff got cheaper, people use more!
This seems to evolve into a “Nony” show, knows more than Hamilton.
Interest rate change in Dec. is going to be interesting.
I quit reading and responding to Nony’s comments some time ago.