According to economic theory, one of the most promising ways in which monetary policy might be able to stimulate an economy in which the nominal interest rate has reached zero is to promise to follow a different policy rule once interest rates are again positive. A commitment to more stimulus and inflation in the future regime could in principle influence expectations and actions of people in the economy today, and thereby offer a means by which the central bank could help an economy recover from the zero lower bound. But as a practical matter, how does the Fed communicate to the public at date t something it intends to do at some future date t+h?
What the Fed actually did was to issue the following statement on August 9, 2011:
The Committee currently anticipates that economic conditions–including low rates of resource utilization and a subdued outlook for inflation over the medium run–are likely to warrant exceptionally low levels for the federal funds rate at least through mid-2013.
The key departure from previous statements was the link to a calendar date one year and three quarters ahead. What did market participants make of this announcement? Federal Reserve Bank of San Francisco President John Williams last week described the August 2011 statement as a “sledgehammer” that very effectively delivered the Fed’s message. Williams noted for example that the Blue Chip consensus estimate of how long it would be before the Fed started raising interest rates jumped from 1 year before the statement to 1-3/4 years after the statement.
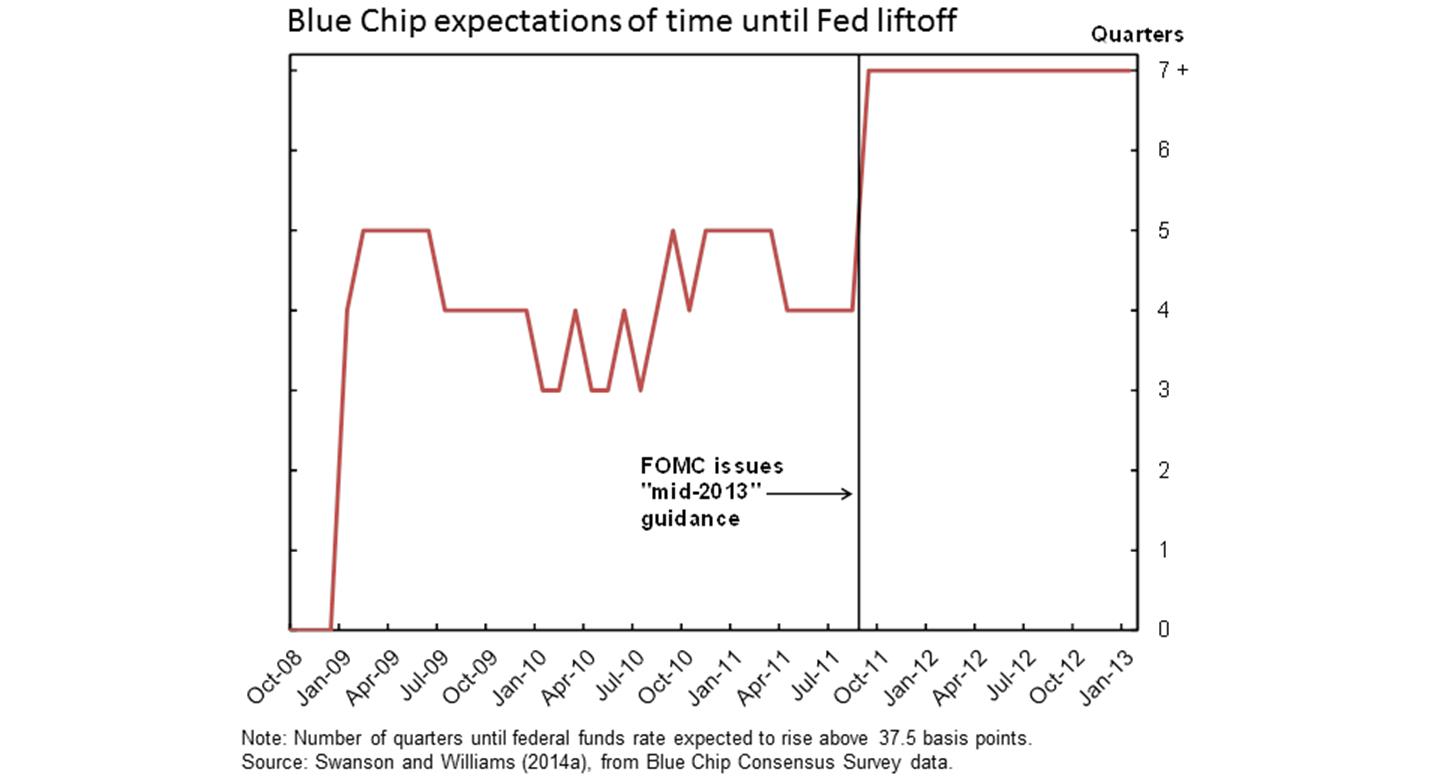
Figure 1. Source: Williams (2016).
Such “forward guidance” had the potential to start influencing economic activity the minute that the statement was issued in August of 2011. If markets were persuaded that the Fed was going to keep rates low for a longer period, longer term interest rates should fall on the news. And indeed, the yield on a 5-year U.S. Treasury bond fell by 20 basis points on the day the Fed released the statement. Lower interest rates on longer term borrowing could help to increase spending right away.
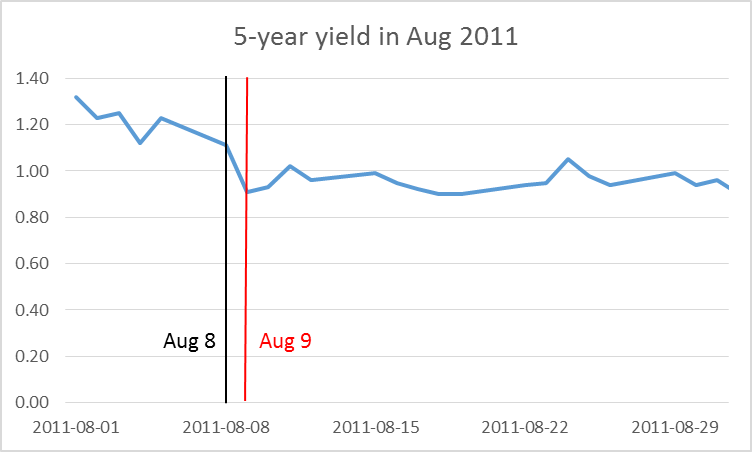
Figure 2. Yield on 5-year Treasury bond as of close of business each day, with values before and after the August FOMC statement highlighted with black and red lines, respectively.
But committing today to a future decision is problematic in both theory and practice. The Fed may say at time t that it is going to take a certain action at some future date t+h, but when the date t+h finally arrives, what prevents the Fed from embarking on a new plan rather than the one it announced at date t? If the Fed had wanted to raise rates at the end of 2012, would the August 2011 statement somehow have prevented it from doing so? A 2012 paper by Campbell, Evans, Fisher, and Justiniano drew an analogy to the account of the legendary Greek King Odysseus, who instructed his crew to bind him to the mast of his ship so that he would be denied the temptation of steering the ship toward the enticing songs of the Sirens. By announcing in August 2011 that it did not intend to raise rates over the next 7 quarters, the Fed was intentionally making it more difficult for it to deviate from that announced course.
But there is another possible interpretation of how the Fed’s announcement could be interpreted, which Campbell, Evans, Fisher, and Justiniano likened to a different story from Greek mythology based on the Oracle of Delphi, who had the power to predict the future. Perhaps what the Fed was doing with the statement was simply passing along the insights from the Fed’s unique crystal ball– the Fed was simply issuing a prediction in August 2011 of how it would behave through 2013. The Fed might have a better prediction than the rest of us about this for two reasons. One is that the Fed knows its own mind better than we do. Perhaps they were saying, “y’all may think we’re hawks, but we’re really doves, doves, doves.” Rather than bind itself like Odysseus, the Fed was merely predicting that it would want to keep rates low through mid-2013, and the market snapped in line on receiving this news, as revealed in Figure 1 above, perhaps because they had not understood just how dovish policy-makers were.
But another reason that the Fed might have issued such a prediction is that they simply anticipated that the recovery was going to continue to be disappointingly weak: “We’re the same Fed we always have been and always will be. But we anticipate that the economy’s going to stink, so we anticipate that we won’t be raising rates any time soon.” Why should markets respond at all to such an announcement? If I think that the Fed may have better information about economic fundamentals than I do, when I learn that the Fed is concerned about where the economy is heading, I become more concerned as well. Under this interpretation, the drop in longer term rates on August 9 may have reflected news of a weaker economy than people had been aware of prior to the Fed announcement. If “forward guidance” operates through this second kind of “Delphic” channel, the statement could end up having the opposite of the intended stimulus effect.
Can we find anything in the data to help distinguish between Odyssean and Delphic forward guidance? We could look at how other prices changed on August 9, to see if they are more consistent with news of more stimulus or news of deteriorating economic conditions. Unfortunately, it’s hard to draw any firm conclusions from that exercise. The stock market scored an impressive gain on August 9, but it was entirely wiped out the next.
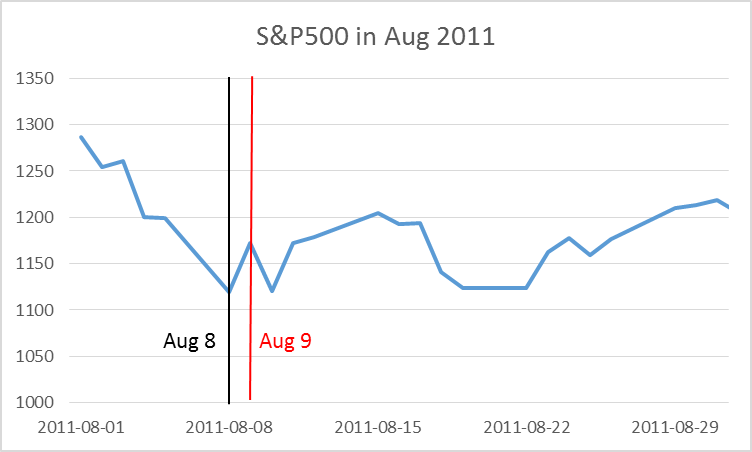
Figure 3.
The change in the yield on 5-year Treasury Inflation Protected Securities on August 9 was exactly the same as that on regular 5-year Treasuries, suggesting that the announcement had no major implications for future expected inflation.
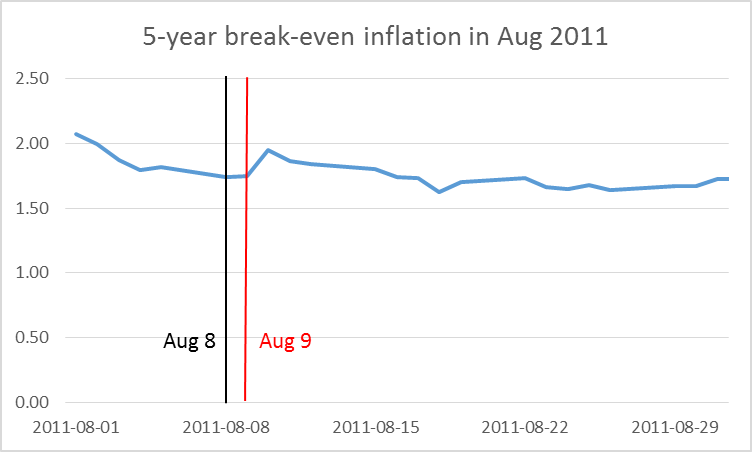
Figure 4. Yield on 5-year nominal Treasury bond minus yield on 5-year TIPS.
Or we could look at how the people whose assessments of time to liftoff were plotted in Figure 1 above also changed their assessments of future output and inflation. At the beginning of August 2011, the Blue Chip 3-quarter-ahead consensus forecast was 8.8% for the unemployment rate and 1.8% for inflation. By the beginning of September the unemployment forecast had been revised up to 9.0% and the inflation forecast was down to 1.7%, more consistent with Delphic pessimism than Williams’s sledgehammer.
Campbell, Evans, Fisher, and Justiniano looked systematically at these relations using data from 1990-2007. They isolated the change in current and expected future interest rates on days of FOMC announcements over this period, and looked at their correlation with changes in future Blue Chip forecasts of inflation and unemployment. They found that if the Fed announcement led to higher expected future interest rates, we would usually see that month accompanied by an upward revision of inflation forecasts and a downward revision of unemployment forecasts, consistent with the conclusion that there is often a strong Delphic component to the news value of Fed statements of future policy intentions. Although we have a much shorter sample of data from the zero-lower bound episode after 2007, these authors concluded that the relationship over 2008-2011 was consistent with what they found in the earlier data.
Although it may have been useful for the Fed to commit itself to a future course of action in 2011, it is a separate question whether it is helpful for the Fed in March of 2016 to try to tie its hands for this year and next by giving the market clearer guidance of its intentions. An interesting paper presented by Feroli, Greenlaw, Hooper, Mishkin, and Sufi at the U.S. Monetary Policy Forum on Friday distinguished between forward guidance that specifies particular dates when actions are likely to be taken and guidance that tries to better communicate the way in which the Fed will respond to future incoming data. The authors developed a characterization of the forward content of FOMC statements, with a value of +4 indicating a clear communication of the kind of data on which future decisions would be based and -4 a clear communication linking future decisions to passage of calendar time. The August 2011 statement discussed above was an example of the strongest form of time-based forward guidance.
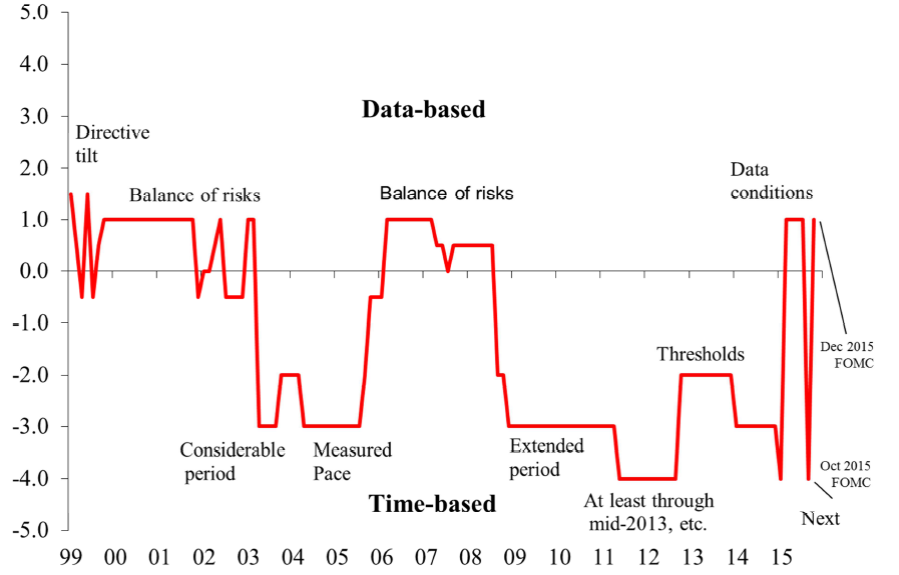
Figure 5. Chart shows a judgmentally computed index of the relative strength of net time-based or data-based content of FOMC forward guidance at any given point in time. Numbers closer to zero denote weaker guidance. Labels indicate key terms used in guidance. Source: Feroli, Greenlaw, Hooper, Mishkin, and Sufi (2016).
In addition to episodes during the zero-lower-bound regime, another period that stands out in their index is the “measured pace” of the Greenspan tightening of 2004-2005, in which the Fed telegraphed that it was planning to implement a 25-basis-point hike in the fed funds rate at every FOMC meeting. Although this approach was intended to reassure markets with the predictability of Fed actions, with hindsight it is clear to many of us that it was a mistake not to adapt monetary policy more quickly to the developing house price bubble.
Feroli, Greenlaw, Hooper, Mishkin, and Sufi conclude that although there may be occasions when it could be helpful for the Fed to commit itself to a particular calendar-based policy path, the tightening cycle of 2016 is not likely to be one of them.
U.S. annual per capita real GDP growth in 2004-06 was 2.04%, which is less than the 1982-07 average of 2.30%.
So, it seems, the tightening of 1/4 point at each meeting in 2004-06, from 1% to 5 1/4%, wasn’t a mistake.
I agree, the easing took place too quickly in 2008. However, that’s because the easing began too late.
One big problem was too much capital was directed into the housing market. It should’ve been redirected into tax cuts. So, households could pay-down and pay-off debt.
It seems, per capita real GDP growth slowed to less than 1% in 2007. And, the economy peaked in December 2007 – basically after a 25-year boom.
So what does this tell us about the real value of the Fed’s policy preference for transparency if everyone ends up believing the Fed is gaming them anyway? It always struck me as hilarious how some of the Fed Heads would talk about how important transparency is, and then FedSpeak had to be translated the same way Kremlinologists used to divine who was “in” and who was “out” based on where Comrade Whatshisnameski would be sitting relative to Fearless Leader.