One conservative meme is that Wisconsin’s apparently poor economic performance relative to other Midwest states is due to an inappropriate choice of reference dates; for instance, a year ago, Political Calculations made the assertion in the title, based on a July 2013 reference date. The logic?
…the tax policy of the previous Democratic party majorities in the state would remain untouched until at least July 2013, when the state’s next biennial budget would go into effect.
As events transpired, thanks to Scott Walker’s victory in the June 2012 gubernatorial recall election and the widening of Republican party control of the state’s elective institutions in subsequent elections, July 2013 marks when the state more fully adopted the Republican party’s preferred suite of economic policies.
Even using this (to me odd) criterion, it would be hard to say Wisconsin has been doing particularly well.
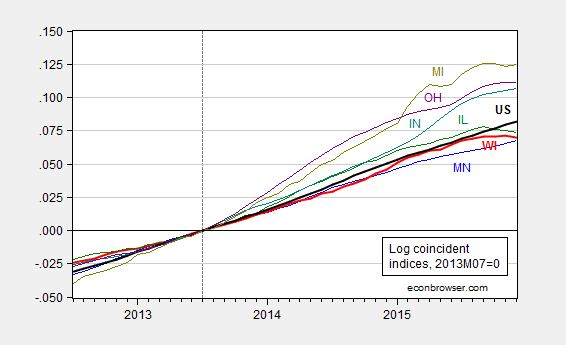
Figure 1: Log coincident index for Minnesota (blue), Wisconsin (red), Illinois (green), Indiana (teal), Michigan (chartreuse), Ohio (purple), and US (black), all normalized to 2013M07=0. Source: Philadelphia Fed and author’s calculations.
Wisconsin is a regional laggard (and as I have documented elsewhere, seems poised to lag further behind, based upon Philly Fed leading indices).
However, July 2013 is only an appropriate reference point if one takes Republican policies in Wisconsin as only having an effect starting in mid-2013. Those of us who lived in the state at the time recall the passage of many provisions [1] [2] [3] that led to a contraction of the economy and a heightening of policy uncertainty: the “budget repair bill” (which strangely enough was not viewed as necessary in the last budget cycle despite similarly tight fiscal conditions — chalk that up to “rosy scenario”), and the passage of Act 10. I think that it remains most appropriate to use a January 2011 reference date. Then, Wisconsin’s truly pathetic macro performance is made manifest.
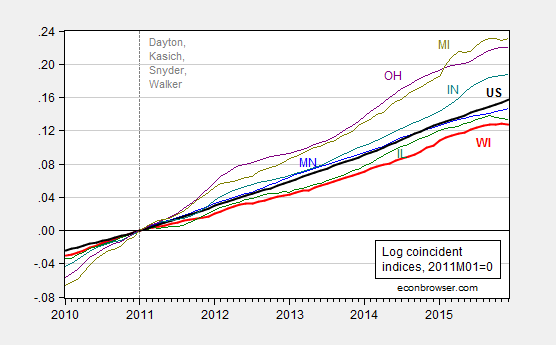
Figure 2: Log coincident index for Minnesota (blue), Wisconsin (red), Illinois (green), Indiana (teal), Michigan (chartreuse), Ohio (purple), and US (black), all normalized to 2013M07=0. Source: Philadelphia Fed and author’s calculations.
Of course, the appropriate comparison is to see whether Wisconsin is doing worse than what it should, based upon other observable factors (besides let’s say economic policies pursued in the state). And here, as shown in Figure 3, it is pretty clear that Wisconsin has been doing poorly, with statistical signficance, relative to a plausible counterfactual (see this post for an explanation of the ex post historical simulation, using US economic activity as an observable, and an error correction model specification):
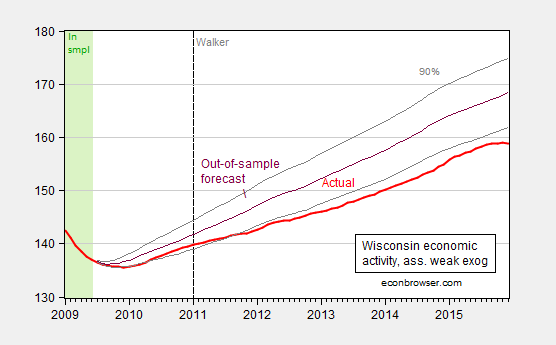
Figure 3: Wisconsin coincident index (bold red), and dynamic out-of-sample forecast (purple), and 90% band (gray lines). Green denotes in-sample period. Assumes US economic activity is weakly exogenous with respect to Wisconsin. Source: Philadelphia Fed, NBER, author’s calculations.
I am confident that some will continue to try to show that Wisconsin’s performance is, reported data notwithstanding, really, really, really good. Is that mendacity or merely incompetence? I let readers decide.
PS: Does anybody know when Department of Revenue will release the next triannual/quarterly Wisconsin Economic Outlook? The last one was released in May 2015.
Expectations change with election, if they don’t, someone isn’t doing their job.
Interesting that Minnesota does look too good on the first graph.
Steve Kopits: Minnesota does look pretty good, using 2011M01 as reference data, and looks even better relative to Wisconsin, taking into account Philly Fed forecast.
Wisconsin unemployment has a fallen from 15th best in the middle of last year to 21st best in January. On the other hand, Minnesota has not done much better, dropping for a peak rank of 5th to 10th currently. Wisconsin also lowered its unemployment rate by more in absolute terms, -0.7 pp, than Minnesota, -0.2 pp, in 2015.
http://www.ncsl.org/documents/employ/STATE-UI-RATES-2015.pdf
http://www.bls.gov/web/laus/laumstrk.htm
Some of the best performing states have Republican governors, including Indiana and Michigan.
Steven Kopits: Once again, let me refer you to “fixed effects”. On average, Wisconsin’s unemployment rate is about 0.8 ppts below the national average (up to end 2010). It is only 0.3 ppts right now. Minnesota’s is 1.2 ppts, while the average is 1.3 ppts. In other words, Wisconsin is doing worse than it usually does. Minnesota is just about on target. Sigh.
Dear Dr. Chinn,
Thank you for your work in tracking employment in Wisconsin against a defined benchmark.
I find the WI Dept. of Workforce Development’s employment statistics highlights more and more difficult to interpret in a meaningful way relating to the situation in the state:
For example, “Wisconsin was one of only 10 states with an annual average unemployment rate in 2015 lower than 2007, the year that the Great Recession began. The state’s average annual unemployment rate was 4.6 percent in 2015 (not seasonally adjusted).”
https://dwd.wisconsin.gov/dwd/newsreleases/2016/unemployment/160316_january_local.pdf
(Gov. Walker took office in 2011.)
You may also want to note that in the interest of open and transparent government, the Office of the Governor announced a new Agency Performance Dashboard at https://performance.wi.gov/
Best regards,
Also, I would note that despite extensive cuts in state funding for education and transportation (two of the most critical functions for state governments), Wisconsin has the third highest tax rates in the nation – http://wbay.com/2016/03/16/report-wisconsin-has-the-third-highest-tax-rates-in-the-nation/
Thank you
Just as important to my mind is the direction of legislation. Wisconsin hasn’t gone the full-Kansas, or full-Louisiana route quite yet. Give the WisGOP a few more years and we’ll get there.
It might be time for another ALEC post comparing economic performance for those ALEC seal of good governance states (snark) with the rest of the country.
There have been many posts which seem to push the notion that “things are different after the great recession.” For example, there have been arguments put forth about the lower participation rate at being the new normal because the over-55 demographic has dropped out faster than previously. Not sure how that plays out in Wisconsin versus other states.
If we look at the midwest, unemployment rates in January were:
Minn. 3.7%
Wisc. 4.6%
Illin. 6.3%
Ind. 4.6%
Mich. 4.9%
Even Texas with the big oil boom is at 4.5%.
So the question is: Is Minnesota with an extensive health care industry the beneficiary of Obamacare rather than its government performing so much better than the rest of the Rust Belt? And a secondary question: are employment rates in the rest of Midwest reflecting the “new normal” and the exodus of population and old-line manufacturing?
I also noticed that mining and logging have been the big losers in Wisconsin. Is that the fault of the Walker administration or are EPA regulations and Canadian lumber killing those industries?
One other issue may be affecting Wisconsin: taxes. Contrary to the “Walker is cutting jobs to give tax cuts” meme, this analysis shows that Wisconsin may still be the victim of very high effective state and local taxes. https://wallethub.com/edu/best-worst-states-to-be-a-taxpayer/2416/
Only Nebraska and stuggling Illinois have higher effective state and local tax rates.
Bruce Hall: Well, then after the tax cuts, we should have seen a tremendous acceleration in growth.
Uh, that was after the tax cuts.
Bruce Hall: I understand. Did we see a tremendous acceleration in growth relative to pre-tax cuts? That is what should happen in the standard supply side story. Yet, I see most recently absolute shrinkage in Wisconsin economic activity, even with these decreased tax rates. Please explain.
Menzie, I understand what you are implying. What I have pointed out is that “tax cuts” are not the whole story when you are only talking about income taxes. The article I referenced takes in the whole gamut of taxes and fees that government collects and then provided an overall taxation impact. In that respect, Wisconsin is still overburdened relative to other states.
Other potential issues facing Wisconsin and similar “rust belt” states is the gradual decay of old-line manufacturing and slow population growth. Contrary to the opinion of some, people have voted for warmer climates… as long as they are affordable and there are halfway decent jobs available. http://www.newgeography.com/files/mcc-08.png
“In that respect, Wisconsin is still overburdened relative to other states.”
perhaps. but is it unburdened today relative to the start date of the analysis?
The problem with studies that look at taxes have is that they don’t look at the benefits that the taxpayers receive. If a middle class family pays an extra $100 per year in extra taxes but has three kids that go through college without any debt they are much better off. If they pay an extra $100 per year in property taxes but receive an excellent public school education instead of paying for a private school they are much better off. Same with utilities, roads, health care, etc. There are some things that are required by the vast majority of citizens that are better provided by the government due to economies of scale. The right refuses to accept this, to the detriment of those in right wing states.
It’s not that simple. You need to examine the trade-offs or costs and outcomes.
And, there’s a “free rider” problem.
Phil, sign me up for that excellent public system for only $100 more. Where is it? I’m moving there?
Perhaps there is one more explanation: Wisconsin hasn’t been too involved in The Third Industrial Revolution.
http://freakonomics.com/podcast/american-growth/
I realize there is a what have you done for me lately factor in economics and these data make Wisconsin look reasonably good.
https://www.bea.gov/newsreleases/regional/gdp_state/qgsp_newsrelease.htm