The Bureau of Economic Analysis announced today that U.S. real GDP grew at a 0.5% annual rate in the first quarter. That’s disappointing, even by standards of the weak growth that has become the norm since getting out of the Great Recession.
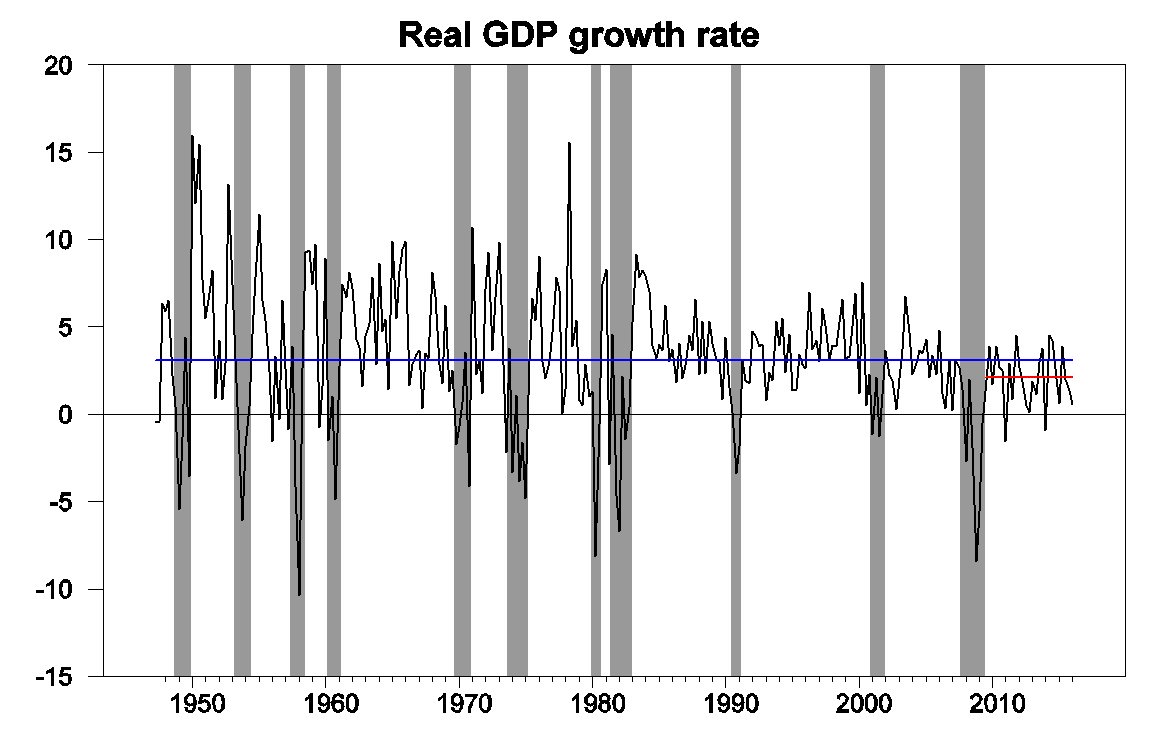
Real GDP growth at an annual rate, 1947:Q2-2016:Q1, with historical average (3.1%) in blue and post-Great-Recession average (2.1%) in red.
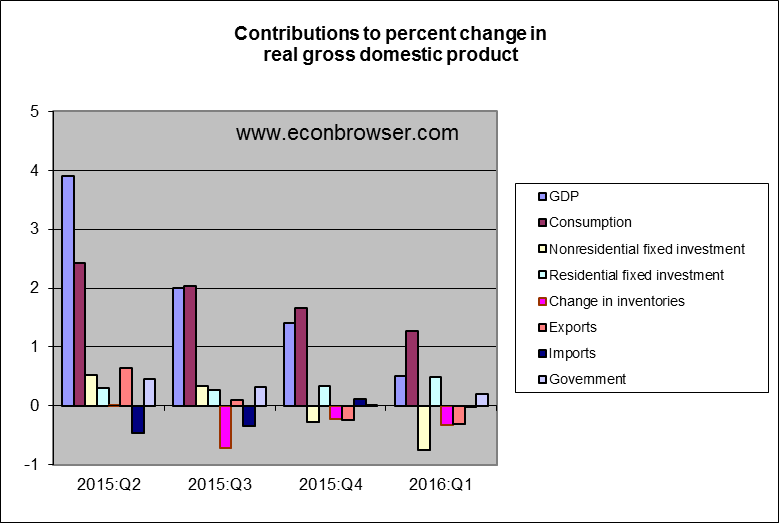
Housing investment was one bright point. Another was growth in government spending at the state and local level which more than made up for a drop at the federal level. An important drag came from the decline in exports, reflecting economic weakness outside the United States. The biggest negative was a drop in nonresidential fixed investment, which by itself subtracted 3/4 of a percent from the Q1 annual growth rate.
Further declines in investment spending in the oil-producing sector contributed to that. Domestic spending on mining exploration, shafts, and wells is now down more than $100 billion at an annual rate (about 6/10 of a percent of total U.S. GDP) from the levels seen in the summer of 2014.
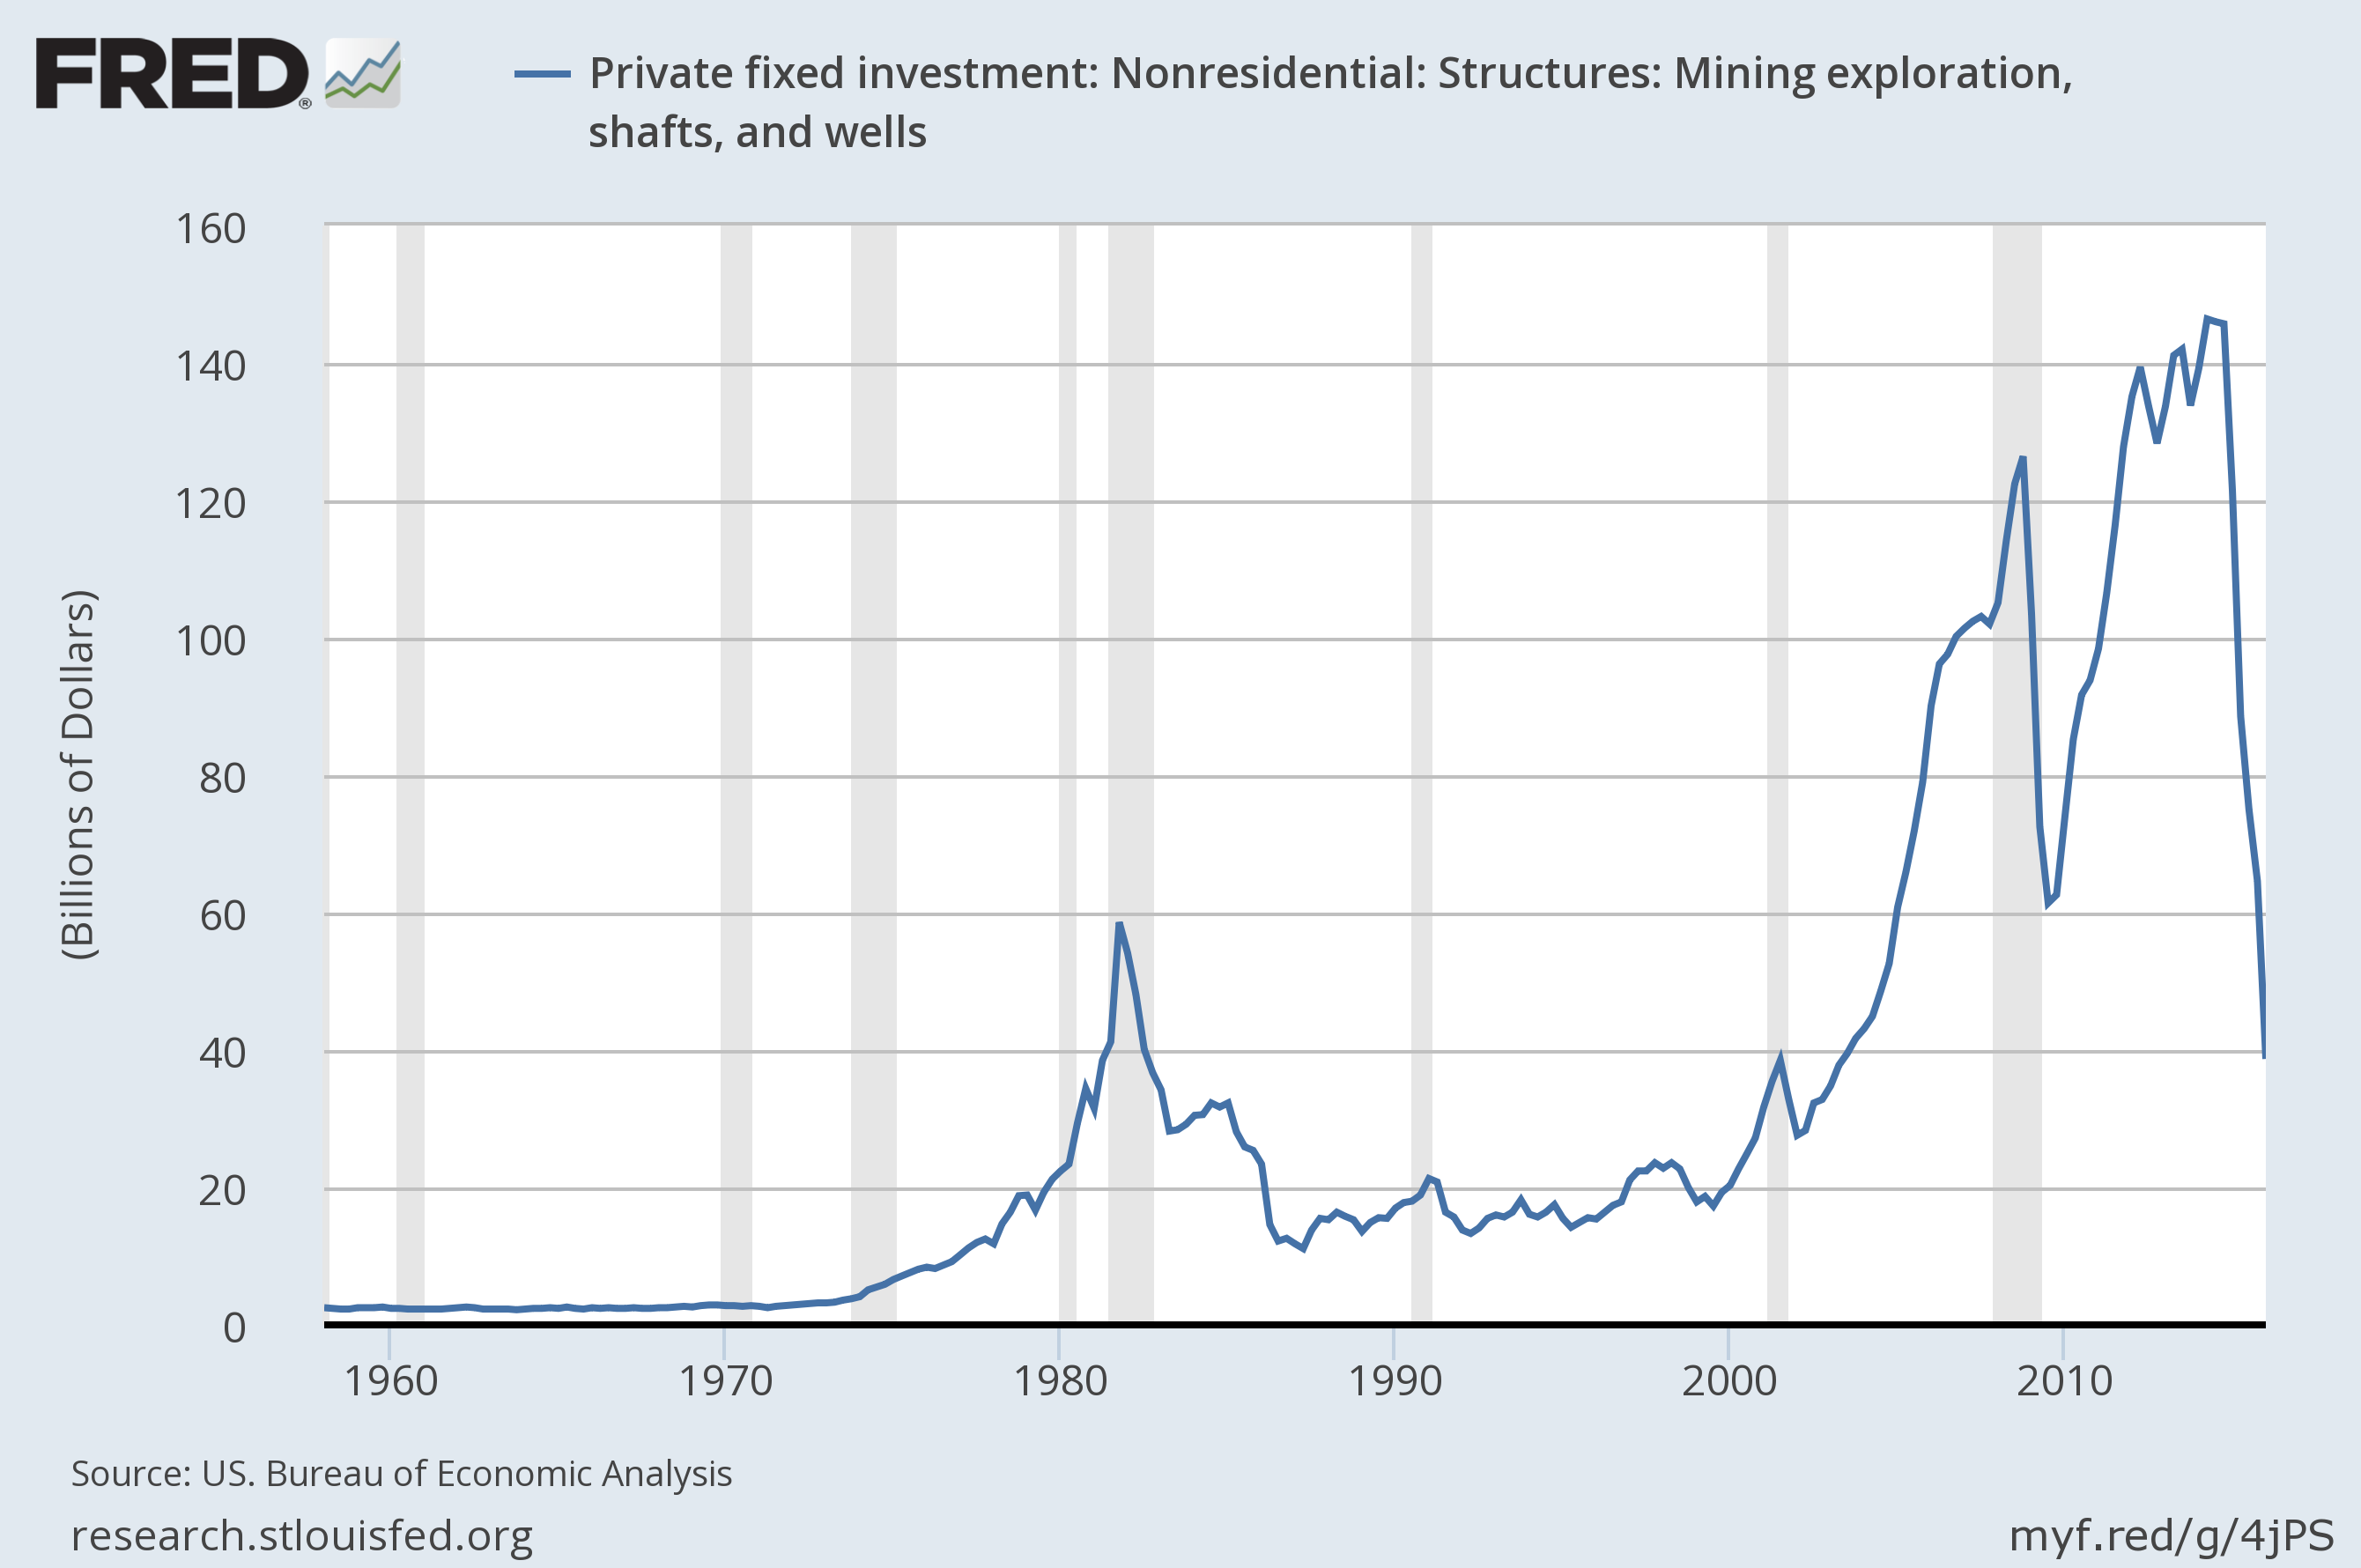
Expenditures on private fixed nonresidential structures investment in mining exploration, shafts, and wells. Source: FRED.
The disappointing Q1 GDP numbers brought our Econbrowser Recession Indicator Index up to 15.7%. The index uses today’s data release to form a picture of where the economy stood as of the end of 2015:Q4. That’s still significantly below the 67% threshold at which our algorithm would declare that the U.S. had entered a new recession.
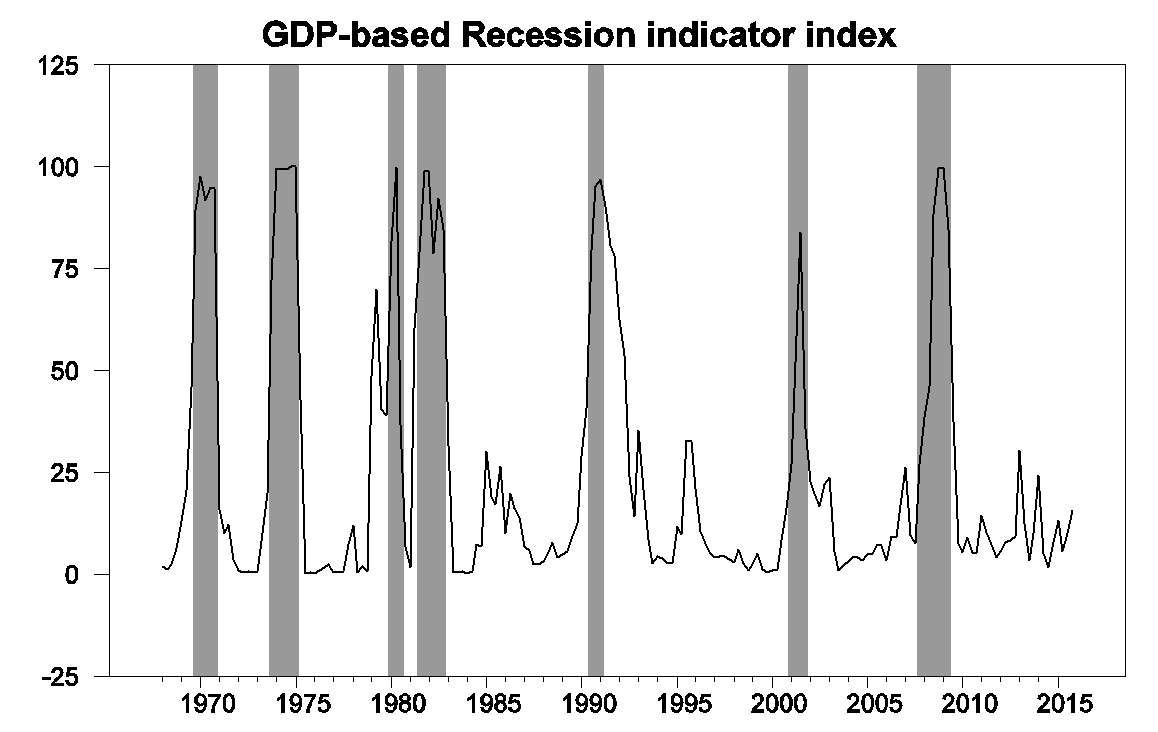
GDP-based recession indicator index. The plotted value for each date is based solely on information as it would have been publicly available and reported as of one quarter after the indicated date, with 2015:Q4 the last date shown on the graph. Shaded regions represent the NBER’s dates for recessions, which dates were not used in any way in constructing the index, and which were sometimes not reported until two years after the date.
U.S. growth is certainly facing some significant headwinds, and lower oil prices do not appear to have helped. Nevertheless, the employment numbers have been showing strong momentum, and housing can make further positive contributions in the coming two years. Maybe not enough to get us back to 3%. But we can still hope to get back to 2%.
“But we can still hope to get back to 2%.”
What a pathetic situation we are in. I remember the Reagan Recovery when growth averaged 4.9% annually from 1983 through 1988.
Of course Reagan was not afraid of deficits and he tripled the federal debt because he saw how FDR had handled the Great Depression.
Today’s politicians will not add a dollar to the debt unless it is to fund a war somewhere. Then the deficit is no problem at all.
The Fed can’t influence macro-economics like it could in the early 80s. If we went into the 2007-2009 recession with double digit interest rates and high inflation, then it would have been easy to achieve 4+% growth. With low interest rates and low inflation, the Fed doesn’t have nearly the same macro-economic impact that it had in the early 80s. Given the more difficult economic problems we face, 2% isn’t half bad (see Europe).
Amazing that you completely ignore fiscal policy! Of course the Fed cannot be effective at ZLB, but Congress definitely could spend money to build infrastructure and fund other vital needs. It chooses not to do so in order to limit economic growth to the absolute minimum.
I’m not ignoring fiscal policy, but I think the early 80’s recovery was much more due to the Fed than increased spending and tax cuts (which were quickly scaled back).
I agree that congress has done a horrible job, and that the U.S. could have been in a much better place with better fiscal policy.
We’ve added on average over a trillion dollars a year to the debt over the last eight years and you’re suggesting deficits weren’t big enough? I see you were clever enough to change your last name, Mr. Krugman.
The average deficit from fiscal year 2008 – 2015 was $894 billion. A larger deficit during the worst of the recession through basic public investments followed by more deficit reduction recently and in the longer term would have been better. Especially while interest rates are at historic lows.
You’re argument boils down to “big numbers are scary”, but the U.S. economy can sustain big deficits.
Since 2010, Q1 growth has averaged 0.7 percent, while Q2-Q4 growth has averaged 2.6 percent. Since the recession ended, Q1 has consistently under-performed the rest of the year and been the only quarter to post negative growth. Seems to be a pattern.
With private hours worked up 1.8% (SAAR) this implies that productivity growth will be negative in the first quarter.
So unit labor cost will continue to grow faster than inflation. The spread between unit labor cost and inflation is a major determinate of profits growth.
For profits growth to turn positive requires some combination of weaker compensation, stronger productivity or higher prices.
Yet, I do not see any of the wall street pundits looking at these factors when projecting positive earnings growth in 2016.
I would put my bet on higher prices–especially if oil prices have bottomed.
I don’t know how you get declining productivity in a recovering economy.
Can you define a “recovering economy” for us?
Not easy to do. Recovering economies went out of style when Ronald Reagan left office.
*Rolls eyes*
Productivity is output per hour. So if GDP grows slower than total hours worked, you get a growing economy with slowing/shrinking productivity.
First, ,we are in an expansion, not a recovery.
A lot of the weak data from wages to productivity, etc. is being driven by the fact that we are creating weak productivity, low wage jobs in retail, restaurants and other services while we are destroying strong productivity, high wage jobs in the oil patch and manufacturing. Even info tech is weak.
If you look at a lot of the data from this perspective it makes sense.
Well, there is only one thing to do if we can’t fix the economy: fix the blame. Based on other posts, I’d have to say the fault lies squarely on the shoulders of Govs. Brownback and Walker.
Exhale slowly.
Bruce Hall: Thank you for your comment, of the typical level of sophistication and nuance we have become accustomed to.
Menzie One should have a little humor occasionally… even bad humor.
Professor Hamilton,
I notice that an ECM using monthly data from 1992 to 2010 seems to predict industrial production (indpro) nicely from January 2011 to about January, 2015 using total non-farm payrolls (payems) as the independent variable. Indpro then declines from the prediction line to below the 95th percentile confidence level. Is this due to the impact of the slow-down in the oil industry flowing through to other industrial production elements and then showing-up as a slow-down in the overall economy?
Will consumption keep up? Unemployment report is gonna come out this week, up to this point it has been defying gravity. If unemployment starts to tick up you can count on consumption to fall in a already weak economy. My 2cents
Weakness in private nonresidential investment is somewhat striking. I’ve estimated an analogous model to that used by Professor Hamilton to determine the recession probabilities but with the contribution of PNFI growth to PFI growth (FRED source: https://research.stlouisfed.org/fred2/series/A008RZ2Q224SBEA). The outcome for Q4:15 is 61.9 percent. For Q1:16 it is even higher, 75.5 percent. Of course it does not mean that the U.S. economy is in recession but the ongoing weakness in investment spending surely is a threat for future growth…
Fig. PNFI to PFI contribution implied recession probabilities
[img]http://i.imgur.com/h581XKj.png[/img]
I guess the site does not support images in the comments so here is a link: http://i.imgur.com/h581XKj.png
The lacking growth seems to be so worrying, that the FED goes berserk, talking massive treaty violations
https://www.treasury.gov/resource-center/international/exchange-rate-policies/Documents/2016-4-29%20%28FX%20Pol%20of%20Major%20Trade%20Partner%29_final.pdf
“Pursuant to the Act, Treasury finds that no economy currently satisfies all three
criteria, however, five major trading partners of the United States met two of
the three criteria for enhanced analysis.
Treasury is creating a new “Monitoring List” that includes these economies: China, Japan, Korea, Taiwan, and
Germany.”
(2) excluding the country from U.S. government procurement;
Correctly it was the Fed which did the biggest currency manipulation of all human history with their QE programs
The Korean KRW stayed close to fair value at 1100 all the time since 2009, chinese CNY around 6.4 to the Dollar,
and the American were cheering all on to the ECB lowering rates.
Now thes want to violate trade treaties to punish Germany somehow for policies others demanded from the ECB against our wishes ?
A bit rich.
The predeccesors of Janet Yellen could at least beat our their wives when things didn’t go as expected.
US growth is presently stalling at 0.5% per anno, basically a ZERO per capita, the Government debt is already at 107 % GDP and that makes further QE driving that up even more a little bit tricky. Interest rates for US 10-years are already 0.3% higher than Italy and Spain, cough.
And the massively shrunk energy costs do not boost US growth, to the contrary
http://www.petertulip.com/frbus_equation_documentation.pdf
log(XGPOT) = (0.700 * (log(LEPPOT) + log(QLWW) + log(LQUALT)) + 0.265 * log(KS) + 0.0350 * log(VEOA) + log(MFPT)) / (1-0.0350
6 quarters of oil a factor 2.5 lower should yield a 0.3% higher output by now, nowhere to be seen
http://www.brookings.edu/blogs/ben-bernanke/posts/2016/02/19-stocks-and-oil-prices
Real per capita GDP was negative last quarter and roughly flat the last two quarters. Chart:
http://www.advisorperspectives.com/dshort/charts/indicators/GDP-per-capita-overview.html?GDP-per-capita-since-1960-with-regression.gif
Monetary and fiscal policies can’t get us out of this depression, since 2009, because they didn’t cause it. Until we identify the causes and make adjustments, we’ll continue to be poorer.
I take a longer-term view of these things. I always look first at table 8, the quarter versus same quarter of previous year, which overall growth and PCE growth steady at 2% and 2.7% respectively. I think you can see the oil price fall’s contribution very clearly in the upturn from around 1.5% PCE growth in 2012-13 to around 2.5-3% since mid-2014. Given our demographics 2.7% PCE growth is not the leas bit shabby.
We have though seen a definite slowdown of non-residential investment, durable goods and exports, all of which are typical signs of a late and turning cycle. It is definitely not a good sign for auto sales growth to be slowing as oil prices drop. There seems to be some subprime credit exhaustion story there. The pick-up in residential construction counters that trend, though. The non-residential investment and exports slowdowns are also tough to gauge: are they short-term adjustments related to oil and other commodities price falls, or the beginning of something bigger.