The FOMC and professional forecasters expect the Fed eventually to achieve its 2% inflation target. The market seems more skeptical.
The U.S. Treasury began offering Treasury Inflation Protected Securities to investors in 1997. These insure against inflation risk by having a coupon and par value that rise with the headline CPI. The difference between the yield on a normal Treasury security (which has no guarantee against inflation) and a TIPS of corresponding maturity is known as the break-even inflation rate. The break-even inflation rate is sometimes used as an indicator of the rate of inflation that bond market participants are expecting. That number currently is around 1.6% for every maturity.
The blue line in the graph below plots the current break-even inflation rate on the vertical axis as a function of the maturity of the security on the horizontal axis. This comes from the difference in continuously compounded pure discount bond yields as calculated by Gurkaynak, Sack and Wright. The height of the graph corresponds to the average expected inflation rate (quoted at an annual rate) between today and n years from today, plotted as a function of n.
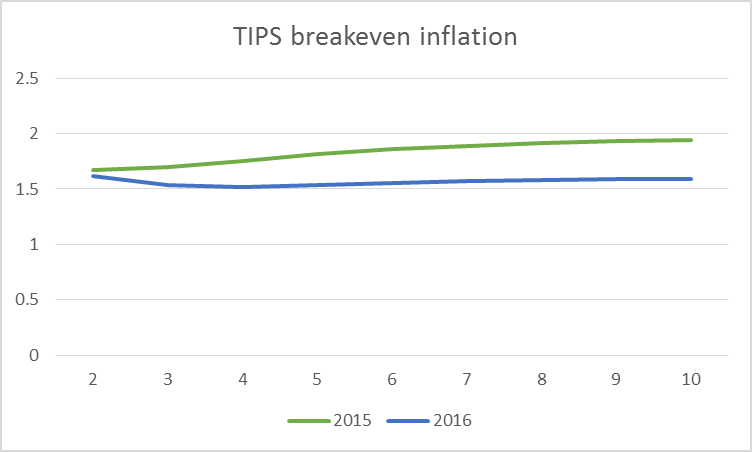
Horizontal axis: number of years looking ahead from indicated date. Blue: break-even inflation rates over that horizon as of May 4, 2016. Green: break-even inflation rates as of May 4, 2015. Data source: Gurkaynak, Sack and Wright.
The green line in the above graph plots the break-even inflation rate as of a year ago. At that time, the market seemed to have more faith that the Fed would gradually achieve its 2% inflation target.
A number of researchers have argued that risk premia and lack of liquidity in the market for TIPS make interpretation of the break-even inflation rate difficult. Haubrich, Pennacchi and Ritchken (2012) developed an alternative approach that relies on the prices of more liquid inflation swaps along with nominal interest rates and survey-based measures. Updates of their series are regularly posted by the Federal Reserve Bank of Cleveland. Although their series often differs from the TIPS break-even rates, at the moment they are virtually identical, signaling 1.6% inflation for most of the next decade.
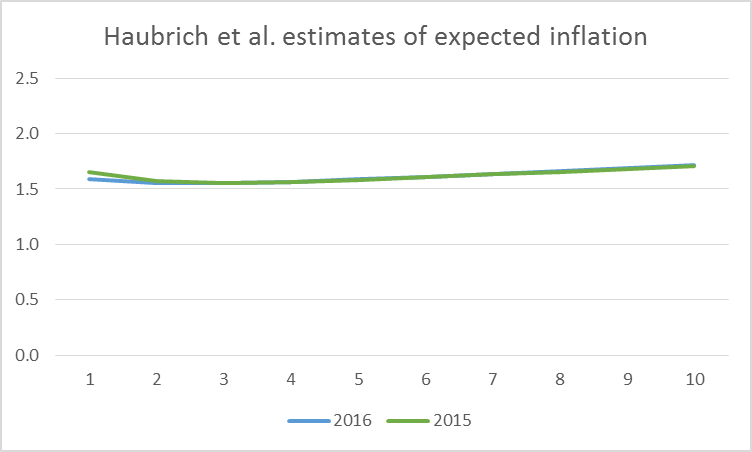
Horizontal axis: number of years looking ahead from indicated date. Blue: average expected inflation rates over that horizon as of April 2016 as inferred from inflation swaps, nominal yields, and survey responses. Green: expected inflation rates as of April 2015. Data source: Inflation Central.
Boragan Aruoba has an interesting new approach to summarizing the answers given by survey respondents to questions about the future. The basic idea is to assume that graphs like the ones above can be represented using the functional form that is used in the dynamic Nelson-Siegel model of interest rates developed by Christensen, Diebold and Rudebusch (2011). The values of the functions at any point in time are then chosen to match as closely as possible the answers given to different questions in the Survey of Professional Forecasters as well as the Blue Chip forecasts. Unlike the TIPS- and swaps-based measures, Aruoba’s survey summary suggests an inflation rate that will average above the Fed’s 2% target. Moreover, the curve has moved up from where it was a year ago.
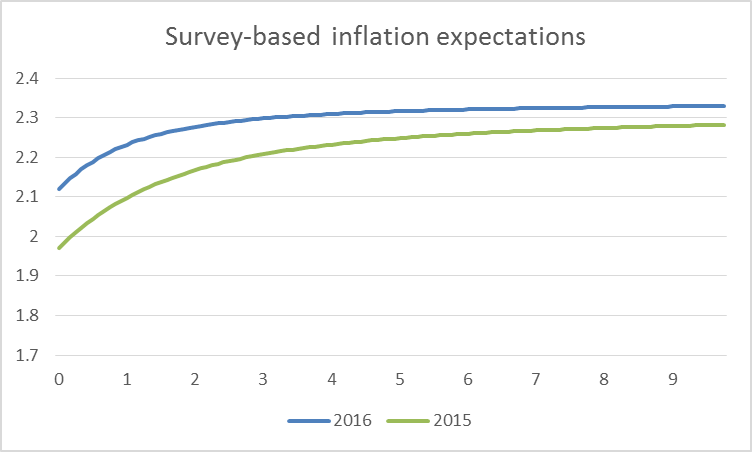
Horizontal axis: number of years looking ahead from indicated date. Blue: average expected inflation rates over that horizon as of April 2016 as inferred from Survey of Professional Forecasters and Blue Chip forecast. Green: expected inflation rates as of April 2015. Data source: Federal Reserve Bank of Philadelphia.
So who’s right? I know this much: inflation came in at 0.8% over the last 12 months and has averaged under 1.6% over the last 10 years.
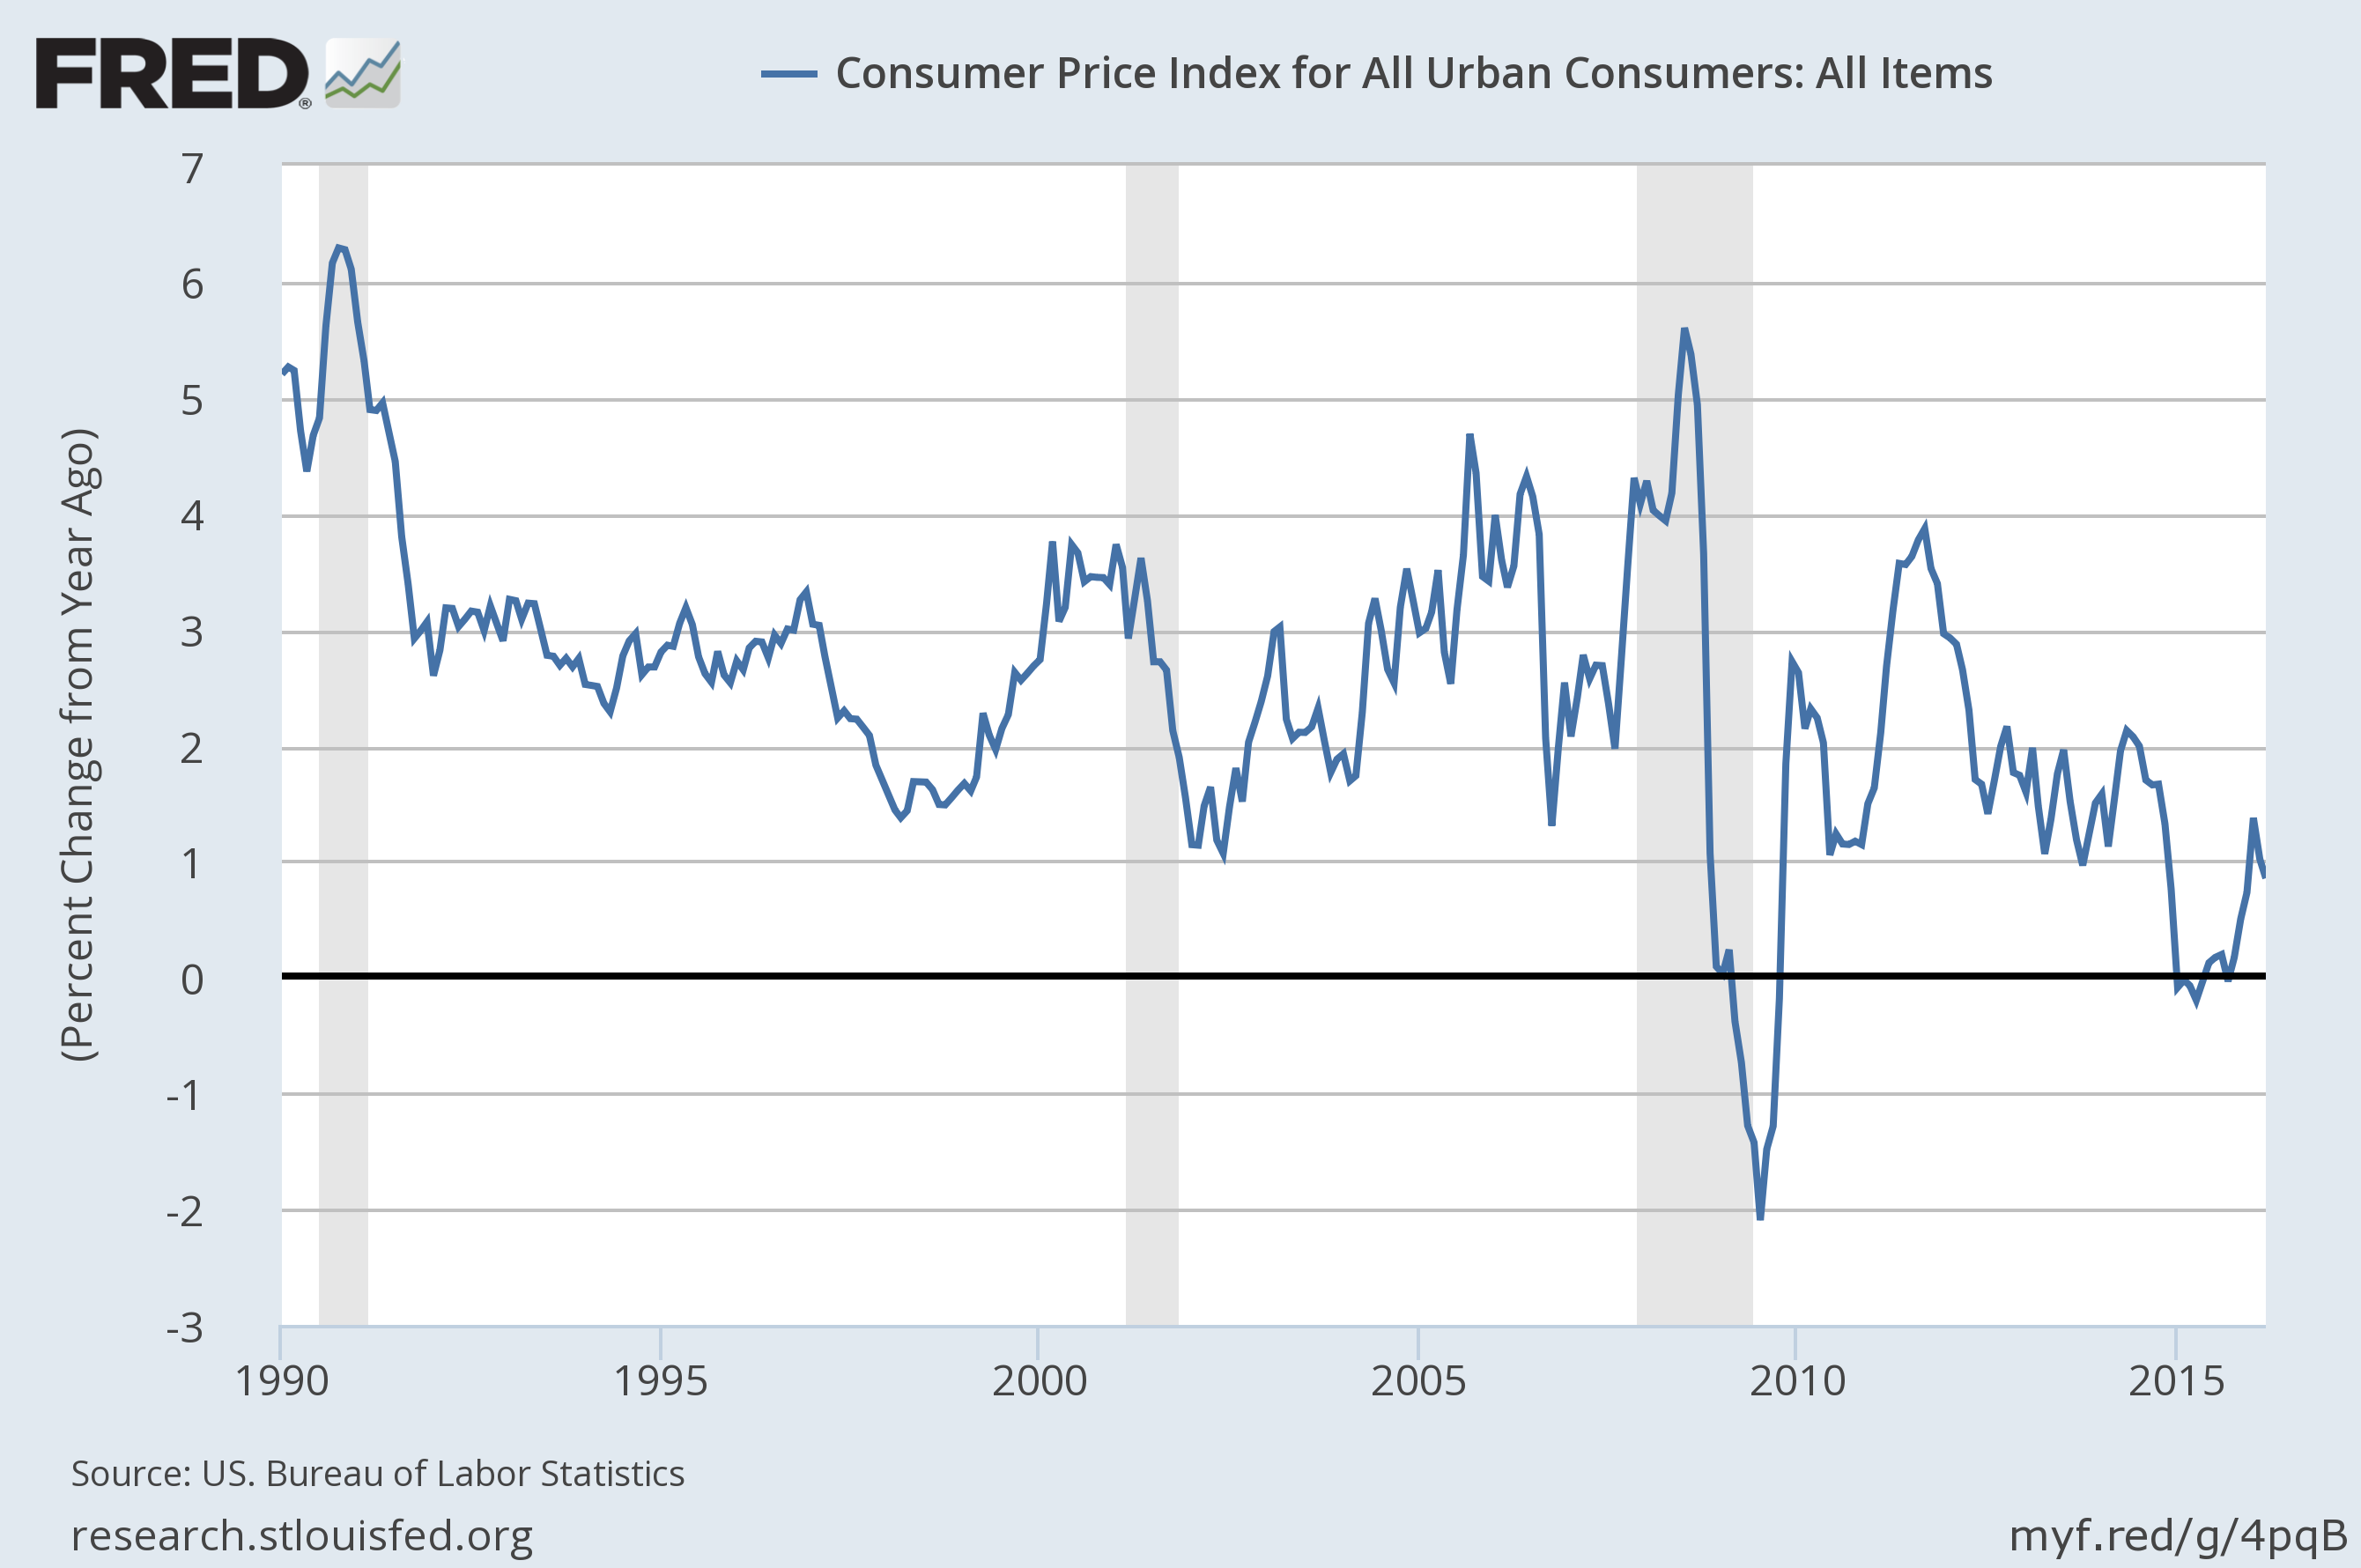
Year-over-year percent change in the seasonally unadjusted CPI. Source: FRED.
They say, “don’t bet against the Fed.” But the market seems to be doing just that.
I think, it’s very difficult to measure the real improvements in the material well-being of the masses. For example, the inventions of household appliances freed-up an enormous amount of time. And later, just the benefits of the microwave oven were likely grossly understated. The evolution of the phone has been enormously beneficial, along with computers replacing typewriters, and all the inventions and innovations in the workplace. Too much government paperwork, legal expenses, regulations, etc. offset much of the benefits. There were enormous improvements in the pre-Keynesian Industrial Revolution that were likely very understated, although suboptimal.
American Prosperity and Price Deflation
Written by Richard M. Ebeling
Friday, 09 May 2008
The decades between 1865 and 1900 were the years of America’s industrial revolution. Before this time, America had an economy of primarily light industry and farming. By the beginning of the 20th century, however, the United States had surpassed all of the European nations in manufacturing, including Great Britain and Imperial Germany, the industrial giants of the time.
Mass immigration from Europe, huge capital investments, and technological improvements provided the means for America’s growth and rising standards of living that soon became the envy of the rest of the world.
During the years after 1865 prices in general slowly fell from their Civil War highs. A Consumer Price Index that stood at 100 in 1865 had declined to 57 by 1900, or a 43 percent decrease in prices over a 35 year period. On average prices went down around 1.2 percent each year over three and a half decades.
At the same time, indices of money wages in agricultural and manufacturing employment both rose during this period as labor was becoming more productive due to capital investments, even with a rising population resulting from millions of immigrants joining the American work force.
The index of money wages in agriculture rose by almost 40 percent between 1866 and 1900, while money wages in manufacturing went up 20 percent during this period. Thus, on average, money wages in general increased by about 30 percent for workers as a whole.
In combination with the productivity gains and the capital investments that resulted in the 43 percent decrease in the price level, this meant that in the last 35 years of the 19th century the real standard of living of the American people increased by almost 75 percent as measured by the positive change in the average American’s buying power in the market place.
In addition between 1865 and 1900 the US became one market rather than several disconnected ones. In 1865 the pacific coast and the east were distinct markets for most goods since shipping was so costly. This began to breakdown in 1869 and continued as more and more railroads reached the pacific coast. (And also covered the great plains as well). In 1865 essentially north of the Ohio and east of the Mississippi was one market but the rest was distinct. It took 10 years or so to get the south into the unified market also as the railroads went to standard gauge in the south. Of course in addition you had the development of larger and larger steamships to that the wheat market became global as Ukrainian wheat competed with Dakota wheat. Further of course for business purposes the time for news to reach at least world capitals went to seconds. (Not so much in the boonies off the railroads until 1910).
The article’s math isn’t right. For example, if prices are half as much and money wages are unchanged, then buying power doubled.
It seems, it should’ve been calculated as 130 / $0.57 or a 128% increase in buying power.
given the well known bias by the potential investors (annuities providers) to prefer inflation protected bonds, the TIPS based inflation expectation are perfectly inline with the Bundesbank target of lower, but close to 2%
Genauer: If investors prefer inflation-protected bonds, they would be willing to pay more for them. A higher price for the bond means a lower interest rate associated with the bond. Since the calculation used to generate the first figure subtracts the TIPS yield, if the latter yield is lower than a risk-neutral evaluation would be, that would mean my expected inflation series is higher than a risk-neutral evaluation would be. In other words, according to your argument, the market expects an inflation rate even lower than 1.6%.
By the way, Narayana Kocherlakota has an interesting paper in which he argues that policy makers should base their decisions on the values such as reported in the first figure rather than trying to risk adjust them, because the Fed should have the same concerns about risks as the public.
but that is what your data are showing, lower tips based inflation (rate) numbers than the inflation expectations from the Phillie Fed.
inflation ten years from now …
reminds me of the high-level talks during the shale boom years : ten years from now we will be oil import independent …
@genauer: oh yes, investors are biased. I would even say, they are biased to drive the market into a certain direction.
Interesting post and discussion.
Once confidence is restored to the global economy and economies outside of the US, particularly Europe and the emerging market economies start to grow, investment flows will push down the US dollar and increase measured inflation. (Obama drone technological demonstration and diffusion could get in the way if security appears jeopardized and confidence collapses.)
Unless there is a sustained investment flow to emerging markets, the increase in measured inflation could be short-lived.
Which begs the larger question: why not move the goal posts to a 1% inflation target? Or perhaps even 0%?
Are modern markets so clunky that they require positive rates of inflation to properly clear? Or are Americans still suffering too much from the post traumatic stress of one event of early 20th century deflation? Or is the fear that a near 0% inflation target would reduce employment opportunities for American economists?
Erik Poole: You raise a good point. The Fed’s convoluted argument for its 2% target is specious at best. The only time this country has seen a Fisher debt-deflation spiral was 1929. And the Fed caused that episode, and then worsened its down phase. There’s also a deeper reason for the 2% target that the Fed does not discuss. It allows government confiscation of wealth by ongoing devaluation of money. Using M2 as the measure and 2% as the confiscation rate, that’s $250 billion annually lost to those who hold money balances. Two percent inflation also enables greater debt creation, as policy would have to be tighter to keep inflation stable at 0%. Excessive debt is now by far the global economy’s greatest problem (though you would never know it from your coursework if you were getting a bachelors, masters, or doctorate in economics). Two percent inflation also injects noise into the price system shaving something off productivity growth. Allowing inflation to deviate from zero was also the initiating source of all but two of the postwar recessions. Finally, what is evident to anyone who has thought deeply about this, the inflation prong of the Taylor rule is only half right. Asset inflation must be kept tame too. Not having an asset augmented Taylor rule (and then following it) was sufficient condition for the housing bubble which led to the Great Crisis. This is why Greenspan and Bernanke were the prime cause of the crisis. But for one. That being the economics profession itself, which by the effect of its reigning paradigm on public thinking enabled the Fed to get away with it.
JBH: There were several periods of negative inflation in American and British history prior to the 20th century that coincided with positive economic growth.
I agree with the comments there needs to be more foreign investment, although it’s uncertain where demand will come from. The U.S. has little or no control over foreign economic policies and demand in the U.S. is hampered by household and government debt.
The U.S. should’ve had a large middle class tax cut to allow the spending to go on. The result would’ve been a stronger banking system, as households paid-off and paid-down debt, and higher discretionary income. Also, fewer costly regulations should’ve been implemented, at least until the economy actually recovered, or an overhaul of regulations was needed.
During the Industrial Revolution, the U.S. surpassed its competitors. However, no country is close to even begin catching-up to the U.S. in the Information and Biotech Revolutions, where the U.S. not only leads the world, it leads the rest of the world combined (in both revenue and profit).
“demand in the U.S. is hampered by household and government debt.”
household debt is affecting demand, not government debt.
“The U.S. should’ve had a large middle class tax cut to allow the spending to go on.”
a tax cut would have resulted in more government debt. if government debt were a hindrance as you noted above, then the tax cut you proposed would not work.
A large tax cut would’ve “refunded” dollars back to the people who spent them, because huge trade deficits shifted dollars from households to government.
would the tax cuts pay for themselves, or would they need to be partially funded with government debt?
Recirculating the dollars isn’t funded by government debt.
but a tax cut must be funded unless you believe you can recoup the tax cut fully with your recirculated dollars. is that what you are saying? that a tax cut during the recession and recovery would have been fully paid for by the recirculating dollars it produced? i don’t think the evidence supports this stance. so again i ask you, how will you cover the shortfall in tax revenue, other than by increasing government debt. and yet you argued government debt was hampering growth. you cannot have it both ways.
You’re making a lot of false assumptions. Consumers, not taxpayers, funded government through trade deficits, and government should’ve refunded consumers through tax cuts. However, government didn’t store those funds, it spent them. That doesn’t mean government funded tax cuts, because of larger budget deficits.
peak, i will give you your tax cut. if resulting tax revenue does not increase, and your federal budget is stationary, how do you pay for the budget? and if your tax revenue does increase, tell me how.
peaktrader wrote: “I agree with the comments there needs to be more foreign investment, although it’s uncertain where demand will come from. The U.S. has little or no control over foreign economic policies and demand in the U.S. is hampered by household and government debt.”
peaktrader, I am not sure where you read the suggestion for more foreign investment, certainly not in my remarks. I disagree that the U.S. has little or no control over “foreign economic policies” in regards to investment flows.
The U.S. has chosen to maintain a dual mandate monetary policy rather than relying on targeted fiscal policy for employment goals. The U.S. has chosen to heavily subsidize and de-risk private home ownership. Financial regulations and lack thereof leading up to the financial crisis of 2008 were all made in American.
The U.S.-made financial crisis spread to other parts of the the world, notably Europe and the U.S. became, ironically enough, the preferred safe haven for capital despite the surprisingly high public debt burden. The zero interest rate policy championed by the Bernanke federal reserve and now his successor have ultimately prolonged the recovery and and complicated the normalization of the US and global economy as U.S. monetary policy lags technological innovation and economic structural change.
Barring regional nuclear war or a salient drone attack on American or European citizens or the election of Donald Trump as president of the U.S., as global economic growth and confidence is restored, capital flows should reverse and head for destinations outside the U.S. That will push the dollar lower and temporarily increase measured inflation. In this case, a lower dollar will in effect be a symptom of a healthier global economy and signal more opportunities for American firms and entrepreneurs abroad.
On the other hand, I would agree with you that the U.S. has little or no control over the dysfunctional, populist economic policies in emerging markets that have clearly contributed to much lower rates of growth and even deep recession in some cases. Many of these countries have not done themselves any favours by adopting a U.S.-style presidential system but those decisions were voluntary. Please note that many of the world’s richest countries as measured in terms of real per capita income and wealth and most stable countries have British-style parliamentary democratic systems.
Erik, you seemed to imply capital inflows pushes down the dollar and then say capital outflows pushes down the dollar. Americans have benefited from U.S. multinationals investing in other countries.
PT, I have no idea how you drew that conclusion. Net inflows push up the relative value of the domestic currency.
I strongly agree with you that Americans have overall benefited hugely from foreign direct investment in other countries via numerous channels including the U.S. based multinationals. I say “overall” because uneducated, unskilled, unproductive Americans tend to fare poorly in the new economy. That explains in part the popularity of presidential candidate Donald Trump. It also explains in part the ineffectiveness of radically stimulative monetary policy.
As for your following comment, I must be a very bad writer. Apologies. Though I suspect your own personal confirmatory bias is affecting your interpretation of what I am writing. U.S. citizens democratically choose dysfunctional self-loathing policies as do citizens in democratic developing countries.
If, for example, foreign governments adopt the rhetoric of the War on terrorism, they do so voluntarily and because that rhetoric works to the advantage of political elites in those countries. It is rather ironic when you think of all the innocent civilians that have been slaughtered under the rubric of the War on terrorism.
And, how does the U.S. control economic policies of other countries? It’s up to foreign countries to decide their own economic policies.