Not terribly great, especially since 2013.
Some people think that Kansas would look good, if only one used a different normalization than the 2011M01 date I used in this post.
I think it’s downright dodgy for Menzie Chinn to normalize in 2011, when clearly if you want to compare those four states (Kansas, Wisconsin, Minnesota, California) you must immediately accept that Kansas is exceptional amongst the four in that it was the least hit by job losses during the 2009 recession (by a significant margin). You could normalize based on 2005 and get a completely different picture, it’s quite a deceptive presentation.
Here is private nonfarm payroll employment, normalized to 2011M01.
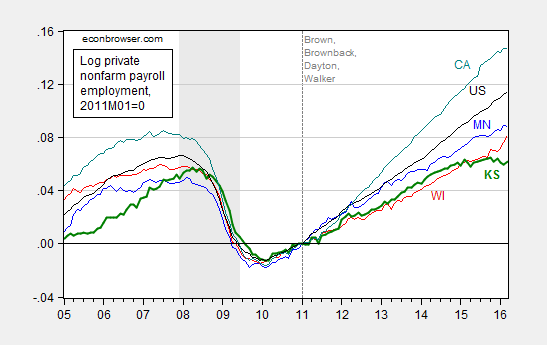
Figure 1: Log private nonfarm payroll employment in Minnesota (blue), Wisconsin (red), Kansas (green), California (teal), US (black), all 2005M01=0. NBER defined recession dates shaded gray. Source: BLS, NBER, author’s calculations.
And here is private nonfarm payroll employment, normalized to 2005M01.
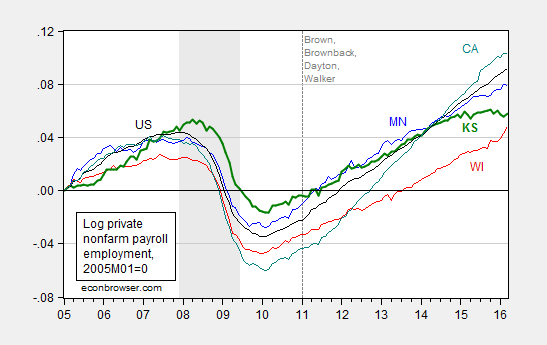
Figure 2: Log private nonfarm payroll employment in Minnesota (blue), Wisconsin (red), Kansas (green), California (teal), US (black), all 2005M01=0. NBER defined recession dates shaded gray. Source: BLS, NBER, author’s calculations.
Doesn’t look particularly impressive to me. (By the way, KS peak to trough decline in employment is comparable to MN peak to trough decline.) Maybe if one normalized on national peak as defined by NBER…
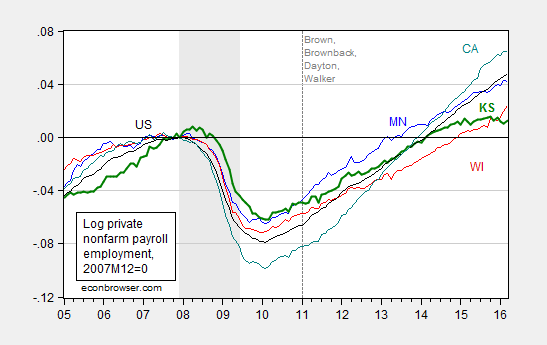
Figure 3: Log private nonfarm payroll employment in Minnesota (blue), Wisconsin (red), Kansas (green), California (teal), US (black), all 2007M12=0. NBER defined recession dates shaded gray. Source: BLS, NBER, author’s calculations.
Still looks like pretty poor performance, post-2011M01.
I fully expect another attempt to prettify the Kansas economic outlook. Like an appeal to unemployment rates, despite the fact that there are fixed effects in unemployment rates. By the standard of 1976-2010, Kansas is underperforming relative to history (see here).
In other news, Moody’s has dropped the credit outlook for Kansas government debt to negative.
Wow, Chinn, are you checking my post daily for updates?
I’d like to get your definition of an “economic disaster.” What technical definition are you using? Perhaps this is just a political term. But then, that explains your repeated attempt to paint me as some kind of partisan. It seems you’re projecting. Maybe there’s some way you can blame Illinois’ poor credit rating on those evil Republicans! http://www.chicagobusiness.com/article/20151022/BLOGS02/151029923/moodys-moves-illinois-closer-to-junk-bond-status
What literature are you (implicitly) citing when you equate a 40 year average with a fixed effect? What about 1976 is relevant to today as it pertains to the Kansas economy? Certainly demographic trends are important, right? Why isn’t the pre-crisis-low a more relevant standard for judging recovery? Krugman uses pre-crisis levels as comparisons in a bunch of his writing.
Looking at the 1976-2016 unemployment rate in Kansas, I’m having trouble figuring out why you think Kansas is underperforming. The most recent datapoint has Kansas unemployment at 3.9%. The only times in the history of the dataset it was lower was in the late 1970s and late 1990s/early 2000s. https://research.stlouisfed.org/fred2/series/KSUR
I only point this out because you didn’t really address the graph in the update to my post.
As I’ve said before, I’m not a fan of Brownback. My point in all of this discussion is that skepticism is good. As Ed Leamer points out, economies are complex and our data is relatively crude. That doesn’t mean we dismiss every attempt to study economies, but it does mean we should be skeptical about causal claims from analysis that is a million miles from a controlled experiment with clean data.
Levi Russell: There’s something in the Google facility called an “alert”. Useful thing, you might try it.
The point of my posts is not to paint you as an ideologue. It’s just when I see macroeconomic malpractice, I want to correct the record. If you say economic conditions are not particularly bad in Kansas, according to our metrics, then I merely wish to document the contrary is true. If you say it’s not necessarily fiscal policy, then we can have a debate. I provide evidence that (1) Kansas macro indicators (output, employment, coincident indices) are not growing rapidly, and (2) are underperforming relative to a benchmark, with statistical significance; you just say (1) it could be other things besides fiscal policy and (2) throw out a lot of possible alternative factors, without validating statistically the argument for the quantitative relevance of those factors. I show that they are not statistically significant determinants of Kansas economic output, and further demonstrate the correlations of the shortfall with spending cuts, in a manner consistent with a Keynesian analysis. You make a freshman error in talking about how by construction, government spending must be correlated with output, hence invalidating my analysis, and yet you do not fess up when confronted by the sheer naivety of your remark.
Finally, I suspect I probably know more of Ed Leamer’s work than you do. I’ve met Ed Leamer. (I’ve been interviewed by Ed Leamer, when I was on the job market). I read his work in both econometrics and trade, when in graduate school. But I don’t think he’d necessarily say because we can’t do a randomized control experiment, we can’t at least deploy as much data and try to identify as many robust stylized facts as possible, in order to make inferences. Along those lines, I’ve tried to use regression analysis, involving as many metrics as possible, and throwing in multiple alternative variables. If you read Ed Leamer’s early work, robustness checks is one way of trying to “take the con out of econometrics”.
By the way, if you knew something about the way in which state level household survey based labor market series were constructed, you’d be a little wary of relying on them too much…
“There’s something in the Google facility called an “alert”. Useful thing, you might try it.”
Another example of your condescending demeanor. I’d hate to see how you behave when you get a rejection from a journal. Are you not interested in providing citations for your equating fixed effects with averages?
I don’t disagree on the raw facts, but you keep using terms like “economic disaster” without any context whatsoever. If you can’t define the words you use in your political hysterics, how am I to evaluate your claims about causation? Is 3.9% unemployment an economic disaster? How much lower should it be before Kansas recovers from this “disaster?”
“I show that they are not statistically significant determinants of Kansas economic output”
You showed your results for drought, yes. Drought is not the sole factor driving ag productivity, as recent data from the sector shows. Were I as snide and pompous as you, I might make a comment about your ignorance. I refrain.
“further demonstrate the correlations of the shortfall with spending cuts”
Yeah, then you implicitly draw a causal relationship with your political hysterics. Oh that we could all make causal claims with simple regression.
“You make a freshman error in talking about how by construction, government spending must be correlated with output, hence invalidating my analysis, and yet you do not fess up when confronted by the sheer naivety of your remark.”
I clarified my point and you know it, Chinn. Grow up. Of course, coming from a guy who took personal offense to a spelling error just might not present the other side’s arguments as clearly as they should.
“Finally, I suspect I probably know more of Ed Leamer’s work than you do.”
Dripping with pomposity, as is your style it seems. Yes, robustness checks are necessary, but they don’t lead to the metaphysical certainty you seem to think you have when you use political terms like “economic disaster.”
Anyway, thanks for the small bump in traffic to my site. I’m signing off. I trust other readers will correct you if you continue to misrepresent my arguments and fail to provide citations for assumptions like “fixed effects = average.”
Levi Russell: Sorry, where have you clarified why the argument that because government spending is a component of GDP, it must be positively correlated with GDP is correct? I don’t recall seeing that clarification anywhere, but I admit I might have missed it. Please provide the link.
Finally, I really do not understand your point about fixed effects. If in a panel, I regress Y on dummy variables for each individual, what are the coefficients I obtain except individual-specific averages (or deviations from average if I include a constant)?
I clarified my point here: https://econbrowser.com/archives/2016/04/kansas-this-other-eden-demiaustrian-paradise#comment-196167
As you noted in your original response, I mis-spelled your name. I am human and subject to poor writing. I just can’t understand why you keep coming back to this after I clarified, except to sling mud. Please address my questions above.
Fixed effects are used to pick up unobserved heterogeneity when such heterogeneity is constant, specifically when these effects are not correlated with the independent variables. I’m not sure what the purpose of regressing Y on individual dummies is, but the point is to pick up the effects of latent variables. If you want long-run averages, just take long-run averages. What is the unobserved heterogeneity you are talking about in unemployment in Kansas? You claim that Kansas is underperforming but unemployment has hardly ever been so low in Kansas.
Anyway, thanks for the discussion. It’s been fun!
Levi Russell: The point of clarification that I was in search of was in regard to whether X as a component of Y implied the correlation of X and Y had to be positive. I never referred back to the misspelling after the first occasion.
You keep on mentioning the different structures associated with different states — well, isn’t that an unobserved heterogeneity? That’s exactly why one might want to estimate individual fixed effects…
Ugh, sorry… not clear again.
In the link I posted on my previous comment, I clarified what I meant about Kansas GSP. You claim I made some kind of freshman error but I really just botched my statement. I’ve clarified this a few times but you seem to want to keep driving at it. Why aren’t you addressing the point as clarified instead of addressing my (admittedly) poorly-worded one? It’s quite frustrating and seems underhanded, sort of an ad hominem.
I’m glad we’re on the same page about fixed effects. I was just confused as to why you equated such effects with long-run averages when any well-specified model would be quite different. Still confused about your claim that Kansas is underperforming in terms of unemployment though.
” I want to Correct the Record (TM)”
Yes, that much is clear
Your digression on fixed effects makes no sense to me, and at the very least does not represent good economic analysis. The “fixed effects” estimates you came up with are almost assuredly wrong. In most cases, economic analysis should not rely on simple averages, as your estimates do (when you say “California unemployment is typically about 0.77 percentage points higher than the national average” and “On average, Kansas unemployment is 1.67 percentage points lower than the national average”).
Who cares what the overall average is since 1967? It is only important what the average is during years that show similar unemployment rates. Should one really expect the Kansas unemployment rate to be 1.67 percentage points lower than the national average if Kansas unemployment is 3-4 percent? Probably not. So your “fixed effects” assumptions that you linked to in this blog and discussed in your previous blog are likely very wrong, and your “average” should be adjusted so that it includes overall unemployment (which I believe would be easy with dummy variables, or by showing the difference between a state’s unemployment rate and the national unemployment rate as a percentage difference, not nominal difference as you are currently showing it). (Please note that I am not sure what KS unemployment rate is, I was just using 3-4 percent as an example.)
Anonymous: I have no idea what this statement means: ““average” should be adjusted so that it includes overall unemployment”.
The sample I use runs from 1976-2010. 1976 (not 1967 as you state) is the beginning of the household survey based estimates. Please tell me your preferred start date, perhaps with a rationale.
Ok, I would recommend using only months in which US unemployment is less than 5.5 percent (because 5.5 percent is very close to today’s rate of 5.0 percent), not every month. I’m not sure why you are ignoring the LEVEL of unemployment when calculating your fixed effect.
You realize you are coming across as desperate. Facts are facts. They may have a liberal bias (according to the right wing noise machine) but they can’t be denied. Trickle down…doesn’t. Never has, never will. Cutting “regulations” causes higher levels of pollution and other negative externalities. Right wing policies have always created great disparities in wealth in every country they have been tried, destroying the middle class. Always. Arguing whether a date on a chart should begin at some arbitrary UE rate will prove this wrong is sticking your head in an ideological pile of sand.
Phil,
I am not defending right wing policies – I have no doubt that KS and WI are not doing well, as Menzie shows. I was simply pointing out that Menzie’s methodology for determining each state’s fixed effects was oversimplistic.
AT
And the dates don’t matter – I have no problem with the 1976-2010 time period. But, and I think even Menzie would agree, if KS unemployment shrinks to 1 percent, Menzie’s 1.67 percent estimate of how much unemployment “should” be below the U.S. average would mean that KS unemployment would have to be negative to be considered normal, which makes no sense. And the reason he comes up with such a large number (1.67 percent) is because he includes many months of data that have U.S. unemployment rates at 9 or 10 percent (and KS unemployment rates are simultaneously 5-6 percent). How can you compare those months to the current situation, where U.S. unemployment is 5 percent and KS is less than 4 percent?
There used to be a term used called “full employment” which I haven’t seen written about here. Perhaps it is too vague. But if full employment is a valid concept, then maybe once that analytical level has been reached, simply maintaining that level would be seen as very successful policy and management. This would seem to be useful when comparing various states to each other where some states have had severe employment losses and then delayed recoveries while other states have had far less employment losses and earlier recoveries. Otherwise, it would seem the thinking behind these comparisons is that there is no acceptable lower limit on unemployment.