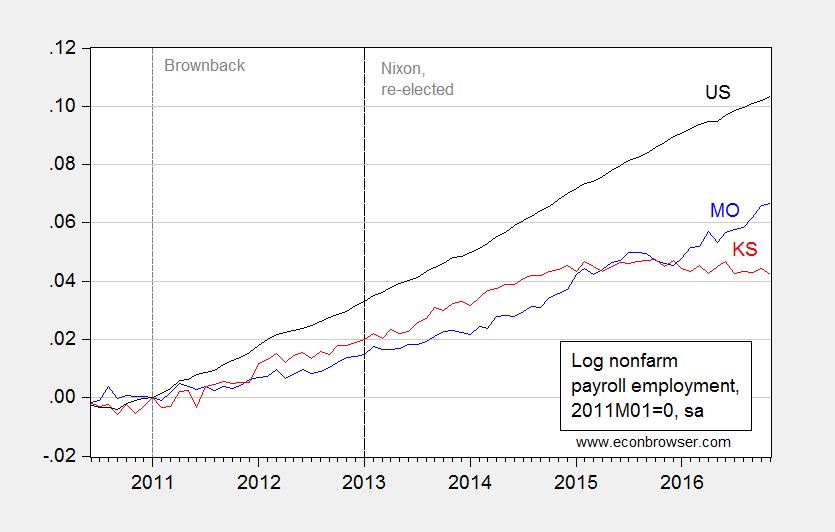
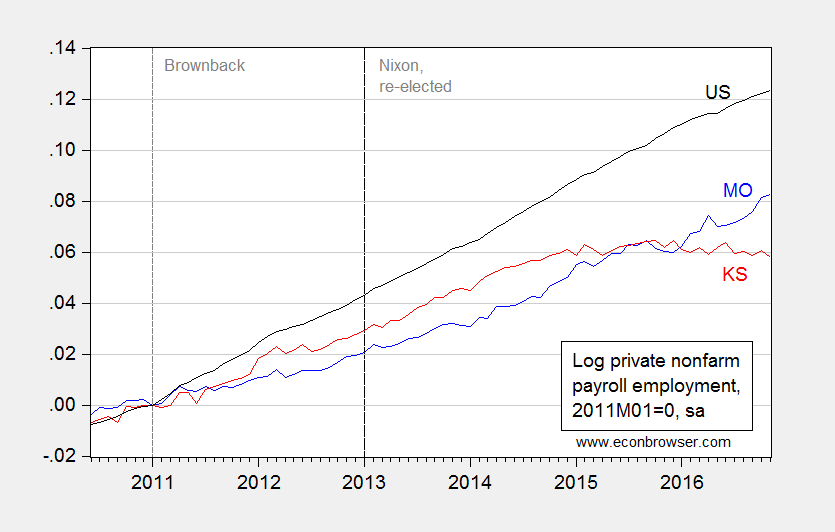
Missouri employment rises.

Figure 1: Log Missouri nonfarm payroll employment (blue), Kansas (red), and US (black), all normalized to 2011M01=0. Source: BLS, author’s calculations.

Figure 2: Log Missouri private nonfarm payroll employment (blue), Kansas (red), and US (black), all normalized to 2011M01=0. Source: BLS, author’s calculations.
More on Brownback’s agenda and impact here.
Disability by region. This is where the low labor force participation rate is hiding. And it’s taking a lot of opioids to boot.
https://www.bloomberg.com/news/features/2016-12-16/mapping-the-growth-of-disability-claims-in-america