From the Trump-Pence website:
DONALD J. TRUMP’S VISION
…
Boost growth to 3.5 percent per year on average, with the potential to reach a 4 percent growth rate.
Figure 1 depicts the growth rate of potential GDP since 1951, over select subsamples, and projections to 2027, from the CBO’s Budget and Economic Outlook, released yesterday.
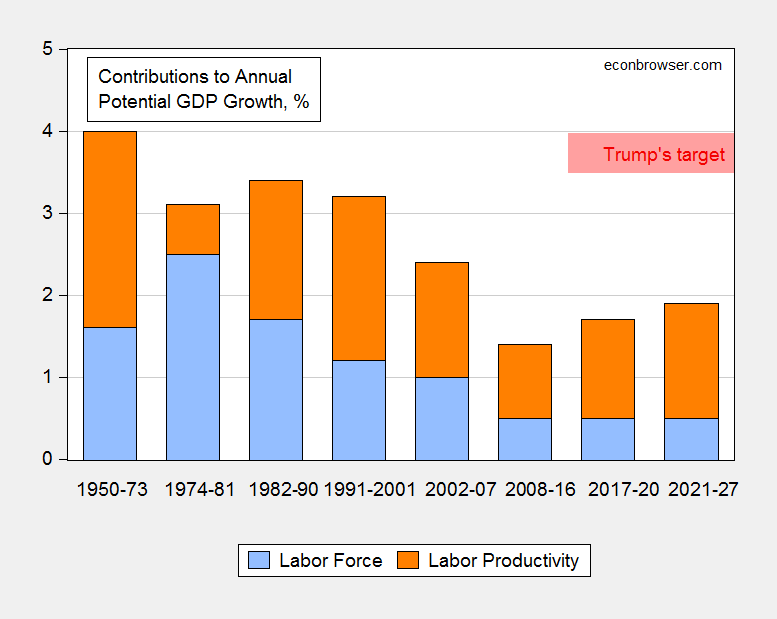
Figure 1: Contributions to annual growth in potential GDP growth, from labor force augmentation (blue bar), and from labor productivity growth (orange bar). DJT’s target of 3.5-4% shown as pink range. Source: CBO, Budget and Economic Outlook, January 24, 2017, Table 2-3; and Trump-Pence website
In order to hit the lower bound of the Trump target for 2017-2020, either contributions from labor force growth, or labor productivity, or combination thereof, must accelerate by 1.8 percentage points. To hit the 4% upper bound by 2021-27, the acceleration must be 1.6 2.1 percentage points. (h/t Bruce Bartlett who suggested this depiction.)
For more on the growth accounting approach, see Dan Sichel’s EconoFact memo on this subject.
To further see place into historical context what a 3.5% or 4% growth rate looks like, see below.
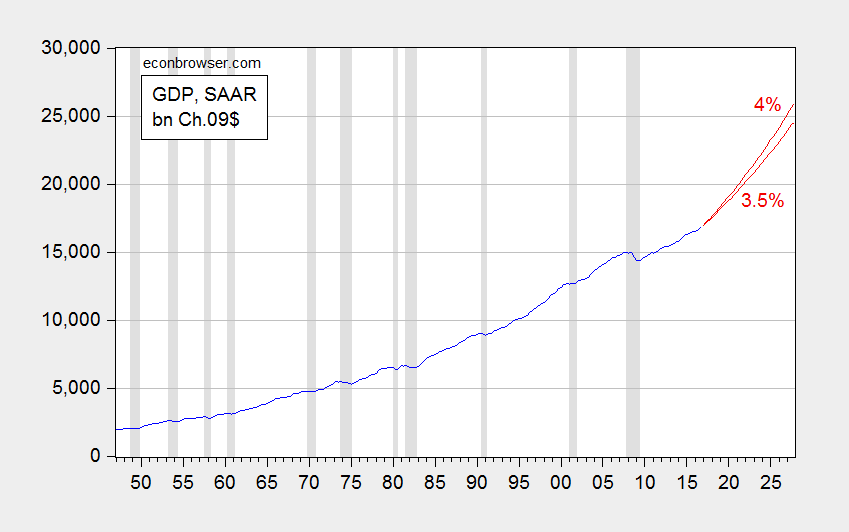
Figure 2: GDP, bn. Ch.2009$, SAAR through 2016Q3; 2.2% growth rate for 2016Q4 from Macroeconomic Advisers (blue); 3.5% and 4% growth rates (red lines). NBER defined recession dates shaded gray. Source: BEA, 2016Q3 3rd release; Macroeconomic Advisers GDP tracking (1/24/2017), NBER, and author’s calculations.
While it seems unlikely to have acceleration of growth to the indicated rates, especially if policies are undertaken to deport some portion of the population, I am confident with sufficient determination to find “alternative economic data”, the goal can be achieved.
* See here.
Update, 5:30PM Pacific:
Bruce Hall says not so unreasonable to get to 4%. Here are two pictures germane to that assertion.
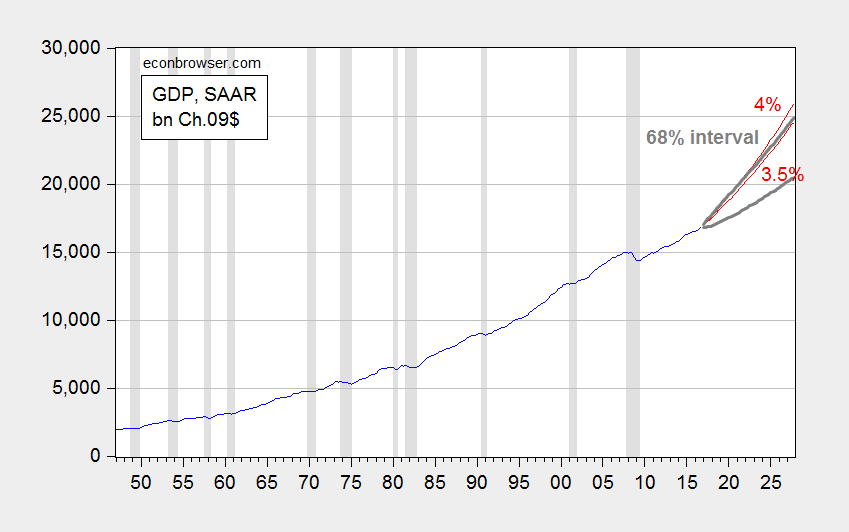
Figure 3: GDP, bn. Ch.2009$, SAAR through 2016Q3; 2.2% growth rate for 2016Q4 from Macroeconomic Advisers (blue); 3.5% and 4% growth rates (red lines); and 68% prediction interval (gray lines) from ARIMA(1,1,1) estimated on log GDP 1967Q1-2016Q4. NBER defined recession dates shaded gray. Source: BEA, 2016Q3 3rd release; Macroeconomic Advisers GDP tracking (1/24/2017), NBER, and author’s calculations.
Sustained 3.5% growth could occur. I wouldn’t bet on it. More perspective below.
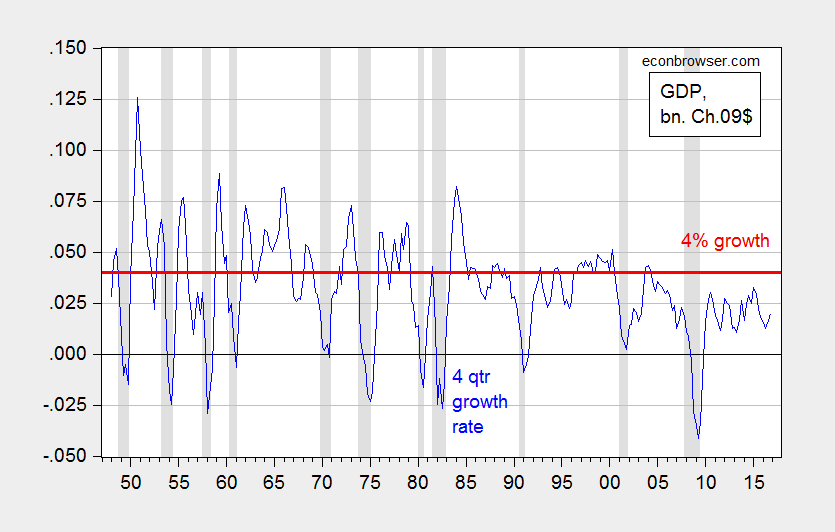
Figure 4: 4 quarter real GDP growth rate (blue), and 4% growth (red line); NBER defined recession dates shaded gray. Source: BEA 2016Q3 3rd release, Macroeconomic Advisers (1/24/2017), NBER and author’s calculations.
Over the last 5 years when real GDP growth averaged 2.1% the average growth rate of real non-farm business output was 2.6%. ( from the BLS productivity data)
The 0.5 percentage point difference largely reflects the negative impact of the tight fiscal policy imposed on the US by congress.
So it might be a lot easier for Trump to achieve 3%-4% real GDP growth than you think. Essentially, all he has to do is let government grow.
Spencer, it should be noted, because growth in the private sector was weak, government growth was also weak.
If we had a strong recovery, federal, state and local tax revenue would’ve been greater to support government growth.
“it should be noted, because growth in the private sector was weak, government growth was also weak.”
Peak, we could have avoided our government austerity policies. this would have beneficial to government and private sector growth. during times of demand shortages, government can have a positive impact on both. would have helped with a stronger recovery.
Under Obama the deficit fell from almost 10% of GDP to under 3%. This 7%-8% fall in the deficit implies that federal expenditures were not constrained by low receipts.
Spencer? This is one of the craziest statements I have seen. Please define how it could be otherwise.
The purpose of Figure 2 seems to be to show that the 4% claim is ridiculous. The RGDP growth rate for 1996-2000 was over 4% if my eyeball is working right. It wasn’t ridiculous then.
Granted, the blue bars on the graph have gone low. Perhaps vigorous growth will bring them up again, similar to the way vigor raises productivity.
Financial costs have fallen and private debt is climbing again. These are signs of vigor.
Arthurian: If we are deporting undocumented workers en masse, how is the blue bar going to be expanded?
1. As a follow-up: Adam Ozimek says “If you look over the long-term, the employment to population rate falls during recessions then slowly recover. So if we can avoid a recession, it’s not crazy to think we could get back to 2000 levels.”
2. “If we are deporting undocumented workers en masse, how is the blue bar going to be expanded?”
Oh… Did Trump say he was going to deport undocumented workers? That guy is such a liar…
🙂
Ordinarily, immigration–both legal and illegal–increases with US GDP growth.
To make 4% GDP growth, the US will need a lively immigration market.
Menzie,
Because you recommended EconoFact, I’ll simply provide the link to an “alternative” view of GDP growth: percentage vs. linear scale dollars. http://econofact.org/can-the-u-s-economy-sustain-3%C2%BD-to-4-percent-economic-growth (you should have been copied on my email to the author).
With the exception of the last decade and the “oil shock”, Trump’s target doesn’t seem quite so absurd. Whether or not his policies can achieve that is another matter, but then Obama’s policies of high-regulation, expensive social experiments, and forcing the U.S. away from low-cost energy didn’t seem to do the trick, so maybe “all is lost… woe is us.”
Bruce Hall: And pigs might be able to fly, because of genetic engineering. See Figures 3 and 4 in the meanwhile.
Menzie, I know you get frustrated with opposing views, but “pigs won’t fly if all else remains equal”. Got it. Just don’t accept it.
http://www.hoover.org/research/whats-wrong-american-economy
I think, Trump will work hard to finally close the output gap and eventually exceed potential output.
Replacing Obamacare will free up discretionary income for the middle class, renegotiating trade deals can make the U.S. more competitive, and reducing regulations and corporate taxes will be a boom for businesses, particularly small businesses. More defense and infrastructure spending will add to GDP.
He should also reduce or eliminate negative income taxes, cut middle class taxes, and raise the minimum wage. The tens of millions of Americans who can work, but don’t, should be put to work, like 1995-00.
How does replacing Obamacare free up discretionary income for the middle class? 86% received subsidies. So it’s a very small number of middle class people who pay the full premium. A million? 3 million? 1% of the population?
The middle class pay more and too much for health care insurance and health care. So, there’s less income to spend on other goods & services.
perhaps the middle class does pay too much. but they have done so for years-before obamacare. that is not the fault of obamacare. it is the result of free market economy. you should not blame free market problems on obamacare. it is a dishonest argument.
What baffling said.
So single payer is what you’re after?
Peak –
I think Trump is clueless about economic theory or things like output gaps.
Replacing Obamacare will free up discretionary cash, but pre-existing conditions are likely to find their way directly onto the Federal budget–just as the Wall is.
Increased spending is supposed to be covered by the border adjustment tax. However, if the dollar does not appreciate as required, then it will constitute the largest consumer tax increase in decades, and there will not be on Tea Party Congressman left from Pennsylvania to Nevada. I don’t think BAT is passed for just that reason.
So, all the stuff you’re describing is likely to end straight up in the deficit. And I’d add that the high growth era of Clinton was accompanied by declining Federal spending as a share of GDP and a balanced budget. Neither of these are on the horizon for the Trump administration.
Bruce Hall and PeakTrader If I asked you to explain the concept of a “convergence rate” would you have any idea what that term means as used by growth economists? Could you tell me the empirical estimates of the US convergence rate of potential GDP? Would you be able to square those estimates with your fanciful claims about explosive growth from all of those supply side actions? I eagerly await your reply.
Next question. Are either of you at all familiar with the basic workhorse models used by growth economists; e.g., the Solow model, various endogenous technology models (e.g., P. Romer, Jones, Aghion-Howitt, etc.)?
2slugbaits, all my economic explanations are based on orthodox economic models. I’ve shown before you haven’t been able to square the variables.
Why don’t you propose a theory and I’ll show you why it’s wrong (again). Perhaps, you can explain the sudden and sustained downshift in growth, since the recession ended in 2009.
Peak Trader: Orthodox on some planet. Not mine.
Menzie Chinn, I’m sure, you’re teaching the same or similar models I was taught at the University of Colorado.
I think, the disagreement, in this case, is the amount of idle capital and labor in the economy.
I’ve shown before, there has been too much idle, or underemployed, capital and labor in the economy, which explains much of the anemic growth, since the recession ended.
1. First, there was a sharp drop of growth going from Clinton (high tax and medium regulation) to Bush (low tax, low regulation, and high deficit). After the 2001 recession, the difference between before 2002 – 2008 and 2009-2016 is that Bush II 9/11 and Iraq War military Keynesian spending and the housing bubble boosted aggregate demand. Immigration (legal and illegal) boosted the labor force, and the decline of the dollar (except against China) boosted exports in 2005-2007.
2. The primary reason for 2% growth the last 7 years as opposed to 2.5% is the unneccessary Fiscal austerity imposed by a Republican Congress and agreed to by Obama (Obama and the Democratic Congress in 2009-2010, particularly in 2d half of 2009 and 2010 were way already practicing austerity). Although I doubt Peak Trade will accept this fact, there are less public sector jobs at the end of Obama’s 8 years then there were at the beginning. Compare and contrast with Reagan and the two Bushes. http://www.calculatedriskblog.com/2016/12/public-and-private-sector-payroll-jobs.html
3. I expect Trump’s military and security Keynesianism may boost growth and incomes in 2017, but if there is a real deportation program instigated, with wide spread work place raids, and restrictions on legal immigration, this is certainly going to reduce the growth in the labor force, which will reduce growth unless there is a explosion in productivity. However, the strong dollar will keep downward pressure on median incomes, which means labor will continue to be cheap, reducing the incentive for businesses to invest in training and labor saving technology.
4. There are a lot of unknowns. How much will dismantliing of Obamacare without a replacement that produces the same level of demand cost the Medical services sector of the economy? How much will lack regulation enforcement cause increase fraud, injuries, disease, accidents, resulting in lost work days and increased insurance damage? Will reduction of regulations create a spurt in aggregate demand? Will increase tensions in Mideast (likely given Trump’s comments and already enacted policy changes regarding moving Embassy to Jerusalem and greenlighting Israel’s settlements in West Bank) cause oil prices to increase? Will that oil price increase spur domestic investment in oil and gas, increasing the “I” in the C+G+I+ (Exp-Imp)=GDP Identity equation? Will heat waves and other severe weather cause damage outside normal patterns of the last 50 years? Will the adoption of a complex “border adjustment tax” to pay for dropping the individual and corporate tax rates cause apparent inflation to rise in 2017-18 and will the Fed raise interest rates to high as a result? As Bill McBride states, growth, which has been steady under Obama’s regular and consistent approach at 2% a year, despite the headwinds of a strong dollar and Fiscal austerity, is likely to be 2.5% to 3.0% in 2017 as Trump boosts “G” and his tax cuts boost “C,” this will be somewhat off set as Net Exports go even more negative, unless of course someone does something real stupid. http://www.calculatedriskblog.com/2017/01/question-1-for-2017-what-about-fiscal.html But beyond 2017, the situation gets very murky as the labor force growth will slow if strong anti-immigration policies are enacted, the Affordable Care Act is dismantled, and Trump appoints hard money ideologues to the FED.
1. I have put in one explanation in an earlier post. However, some facts should be introduced. First the growth rate under Obama’s administration a 2.1% annual average GDP growth for 2009-2017 is only slightly less then George W. Bush’s 2.3% for the entire period from Jan 2001 to Jan 2009, despite the Great Recession. https://www.bloomberg.com/view/articles/2016-09-06/how-obama-s-economic-record-stacks-up and
2. Most articles on the subject neglect the demographic headwinds to economic growth during the Obama administration. Not only a decline in participation rate as boomers started retiring, but also slower growth in the labor force (actual decline) during most of the Obama administration resulted in lower growth. (This also affected the Bush II administration, but to a lesser extent as there was higher immigration, legal and illegal, under Bush II. http://www.pewresearch.org/fact-tank/2016/11/03/5-facts-about-illegal-immigration-in-the-u-s/
3. Finally, as Rogoff and Rinehart have shown, economic growth after a deep recession caused by a major financial crisis is always slow and below average for approximately 10 years after the crisis as it takes that long to restore banks and individuals balance sheets and Governments practice austerity to reduce public debit. Only now to do a substantial number of homeowners have equity they can borrow on and balance sheets for both banks and individuals look good (until the next blow up).
Perhaps, you can explain the sudden and sustained downshift in growth, since the recession ended in 2009.
Three letters: G O P. To the extent that the economy was unable to quickly return to potential GDP, it’s fair to throw a lot of the blame towards a dimwitted Tea Party Congress in 2011. Growth was actually picking up until the Tea Party came to town and gave us austerity. But even without the Tea Party it would have been a tough slog closing the GDP gap because this was a financial recession. Even still, the US economy did a little better than we had a right to expect given past financial recessions.
Now if you’re talking about the longer run slow down in the growth rate of potential GDP, then that’s a much longer story and it didn’t begin with the Great Recession. Secular stagnation is part supply side (e.g., Robert Gordon) and part weak private sector investment demand and low interest rates (e.g., Larry Summers & Paul Krugman). If Gordon is right, then we’re pretty much screwed. If Summers & Krugman are right, then we have half a chance.
Menzie, Calculated Risk has shut down its comments, HCN. How do you keep your comments from exploding into funny cats and national politics poo throwing?
Menzie,
I love the “alternative presentation of the facts”; however, I was referring to a specific article and specific graphic in EconoFacts and a specific email to which you were copied:
“Dan Sichel:
Your article, http://econofact.org/can-the-u-s-economy-sustain-3%C2%BD-to-4-percent-economic-growth , poses an interesting question and your chart may provide more insight than you intended.
Inline image 1 https://dl.dropboxusercontent.com/u/33425283/Change%20in%20U.S.%20GDP%2C%20Labor%20Force%20Participation%2C%20and%20Productivity.JPG}
Until the downturn began a decade ago, no one would ask that question. The economic dislocation (pick your favorite causation) certainly affected employment and investment. But after nearly a decade of “fine tuning” by the Obama administration, not much has happened to restore decades of growth to the levels in question. Those levels, by the way, were achieved during periods of declining labor participation through ups and downs in productivity.
So, it would seem that we have some questions to ask:
– What has happened since 2008 that forever changes the GDP outlook?
– What, if anything, did President Obama fail to do that prevented a reversal of lost output?
– What policies, regulations, and disincentives (such as taxation) are playing a part in the sluggish growth?
If your answer to the last two questions is “nothing”, then I suggest that you are not looking very closely. Still, I will concur that “all things being equal”, it is unlikely that the U.S. can achieve 3.5-4% growth. The question is then whether it is necessary for all things to remain equal.
You stated: “The arithmetic of growth, and the experience of the past half-century, suggest it unlikely that sustained growth of this magnitude is possible.” My question is what was the average growth between 1960-2005? If you eliminate the peak in the mid-’60s and the trough in the early-’80s, your chart appears to show a fairly stable growth band within the levels in question.
So, why should we not view this last decade as an aberration and the policies of the last decade as failures?”
____________
So, I will concede that my conclusions, based on the data from the Econofact article, may be incorrect, if you concede that the graphic from Econofact, which you endorsed, is not an accurate representation of the relationship of GDP change, labor participation, and productivity.
Bruce Hall GDP growth rates started slowing down long before the Great Recession. Go check Table 7.1 over at the BEA. I’m of course assuming that Trump hasn’t shut down that website yet. The 2001 recession was very mild and Bush 43 pumped lots of fiscal stimulus into an already full employment economy, but per capita growth rates were no different than they are today. Most of Menzie’s posts are about aggregate demand policies that try to close the output gap. You’re right to want to better understand why productivity is falling, not just here but pretty much across the developed world. Labor productivity in Britain has really tanked bigtime. But this isn’t a recent problem. It’s been around for awhile. Labor productivity has been falling for a long time. What kept kept labor’s contribution to GDP growth going was the increased size of the workforce; i.e., women and baby boomers.
This is a little nerdy, but the growth accounting shown in Menzie’s table is not ideal. Even the standard Solow residual approach that Menzie mentioned has its problems….like how should we interpret the residual. Formally it’s just a measure of our ignorance.
2slug,
My comments were only based on the EconoFact graph which show two distinct levels of GDP growth: 1960 – 2007 and 2008 and beyond. https://dl.dropboxusercontent.com/u/33425283/Change%20in%20U.S.%20GDP%2C%20Labor%20Force%20Participation%2C%20and%20Productivity.JPG
If you want to dispute the data, do so with Econofact.
There is also a relationship between import acceleration after the late 1990s and a general slowing of U.S. GDP growth. http://www.indexmundi.com/facts/united-states/imports-of-goods-and-services
I’m not making up the data, simply making some observations. If you want to be an apologist for Obama’s policies despite obvious lackluster performance, that’s your right. I’m not defending Trump’s particular policies or plans; only saying that prior to 2008, 3.0-3.5% growth in GDP was apparently fairly commonplace.
Menzie seems to take offense that EconoFact, a site in which he participates, allowed someone to produce and publish a chart with which he disagrees. I simply asked him to say as much and that the discontinuity with the prior period has to continue despite any change in policies, regulations, or disincentives. In other words, “all things being equal” will remain equal.
“only saying that prior to 2008, 3.0-3.5% growth in GDP was apparently fairly commonplace.”
you are implying it should continue that way into the future. but we do know that the past performance does not require future performance to be the same. it is false to say future performance not equaling this metric is subpar.
just a thought experiment. the financial crisis was a huge event. probably impacting to a greater degree than you want to admit. its timing coincided with a shift in demographics as well-baby boomers retiring. it is entirely possible the financial crisis made a significant shift in boomer behavior, including forcing marginally successful (economics wise) boomers into an earlier retirement-one they would not have been prepared for. the financial crisis amplified and concentrated that change-rather than having it spread out over years. this could produce an abrupt change in overall economic performance-given the size of the boomer cohort. this is more likely than any negative policy you may attribute to the obama administration.
baffling,
“only saying that prior to 2008, 3.0-3.5% growth in GDP was apparently fairly commonplace.”
you are implying it should continue that way into the future. but we do know that the past performance does not require future performance to be the same. it is false to say future performance not equaling this metric is subpar.
I believe that is what I have said in several comments to this post. The poor performance of the last 8 or 9 years (past performance) is not indicative of a new ceiling on future performance… I just stated the flip side. But, yes, I do see the last 8-9 years as subpar… especially because its starting point was so low. The opportunity for improvement, given the right policies, was greater.
“The opportunity for improvement, given the right policies, was greater.”
you are playing word games again. you are basing opportunity on past performance. we both agree, there are times when past should not be used to measure future. 2007-08 appears to be a point in time where that change occurs.
but as slugs pointed out, if you want to blame obama for poor policies, then you need to explain how performance was already beginning to fall in 2006-way before obama took office. my thought is the boomers produced a bigger drag than many people acknowledge. the financial crisis amplified their impact.
Bruce Hall The drop off in GDP growth rates did not begin in 2008. You should look at the actual data. The drop off actually began in 2006 (it fell from 3.3 in 2005 to 2.7 in 2006) and then fell again in 2007 to 1.8. Since 2009 it’s average about 2.1 (including the 1.6 for 2016). If you believe there is a significant GDP gap and we can do better than 2.1, then you should be arguing for government spending as fiscal stimulus. If you oppose fiscal stimulus, then you are logically telling us that you think the economy is currently operating at potential GDP. If that’s the case, then Obama’s policies don’t have much to do with the low growth. It would be entirely explained by the fall in the civilian population and falling labor productivity.
The fact that the drop off actually began two years before the Great Recession strikes me as pretty good evidence that the reason for lower growth rates today has more to do with long run structural issues than today’s fiscal policies, although I would agree that less austerity might have arrested some of that decline in productivity. The fact that falling productivity and secular stagnation is happening in just about every advanced economy is further evidence that most of today’s low growth environment is going to be a tough nut to crack.
2Slug,
The drop off in GDP growth rates did not begin in 2008. You should look at the actual data. The drop off actually began in 2006 (it fell from 3.3 in 2005 to 2.7 in 2006) and then fell again in 2007 to 1.8.”
Two years is evidence of a long-term structural change? Seriously?
And yes, I know there was a drop off in 2006 because it began in Michigan with a sharp decline in home values and then a sharp decline in automotive sales. Home values have recovered partially (same home sale/valuation) and the auto industry is doing just fine having benefited from pent up demand and give-away interest rates.
But nationally, the GDP performance has been pathetic since 2008-09. If you want to blame it on a “structural change”, okay. But based on two years? I’m more inclined to go with bad policies, mandates, regulations, and tax disincentives.
2slugbaits: Those are all good questions. But frankly, one is either familiar with those models and the data sets used to motive them or one is not familiar.
Menzie Chinn: In the growth accounting literature, there are several approaches that can divided into two frameworks: 1) Value-added and 2) gross output.
If adopting the value-added framework that requires information on growth in labour inputs, growth in capital inputs and then growth in productivity (value-added TFP) — the Solow residual.
Or you could attribute all technical/productivity growth to just one primary input, i.e., labour. Is that what you are doing? And if so, why?
Erik Poole: I’m not saying all the growth has to come from aspects of labor. The decomposition I used is mechanically perfectly valid. Labor productivity is an amalgam of TFP growth, capital deepening and skill- and human capital augmentation in labor. I would’ve preferred the standard Solow residual approach, but I admit that the graph is driven in part by expediency, as CBO only provided the standard TFP decomposition for business sector, not for overall economy, and Trump-Pence made assertions about overall GDP growth.
Based on my reading of the literature regarding the slowdown in TFP (e.g., Fernald et al.), I don’t think my conclusion would change using the usual growth accounting approach. Do you?
Menzie: Thanks for the clarification.
If you are going to subsume everything, including capital inputs in ‘labour productivity’, why bother with a growth accounting framework?
Upon a second more careful read, I have no idea why the CBO is using Potential GDP as opposed to measured real GDP from those select periods (unless that is a typo).
It would be simpler to track US labour productivity growth over time as measured by real GDP/labour input growth for arbitrary periods. Presumably the Trump administration will expel so illegal immigrants that the workforce growth will stagnate.
A better way to illustrate that Trump’s growth wishes are unrealistic would be to discuss various growth theories and to show how growth in per capita income tends to slow down over time for mature economies. At the same time remind people of the stylized facts of growth rates of economies recovering from severe financial crises. From that perspective, the Obama administration performed well.
The Obama regime removed 2.4 illegal immigrants between 2009 and 2015. The minimal fanfare that accompanied these deportations probably contributed to Hillary Clinton’s defeat. I would guess/assume that the vast majority of those illegal immigrants are low productivity workers, whose net contribution to US wealth is skimpy at best.
I see the appeal of large immigration numbers from the perspective of special interests. The ‘nice’ self-styled humanitarians feel good. For other Americans, it presents opportunities to get richer quicker and easier.
Two closing comments:
It is unfortunate that so many focus on aggregate real GDP growth and not growth in per capita wealth.
It is unfortunate that so many economists and others blithely advocate ‘open access’ style policies for immigration (legal and illegal) without understanding the impact on specific neighbourhoods, specific sub-cultures, social capital and similar.
Erik Poole: If you examine referenced Table 2-3 in the CBO document, you will see that they provide a more conventional decomposition for nonfarm business sector. The difficulty with doing the full economy is that multifactor productivity is very difficult to measure in the government sector… In general, there is no single right decomposition. I find the labor force/labor productivity illuminating even if you don’t.
I could’ve referred to growth theories, but I thought for the short sample, just showing a comparison to the most recent past was useful. And anyway, there’s convergence, and there’s convergence clubs. Which model do you believe? And do you believe in endogenous or exogenous growth theory… some reasons why I didn’t get into all this in a short post.
PeakTrader I have no idea what you were taught, but much of what you seem to be passing off as “orthodox” economics seems to be based on cocktail napkins and hand waving. When economists talk about economic growth they usually have in mind two different models. Cyclical models are typically concerned with managing economic shocks; usually aggregate demand shocks. That’s what standard Keynesian econ is about. Those kinds of models aren’t really relevant for long run growth analyses except to the extent that prolonged slumps risk hysteresis. The kinds of things you keep mentioning (viz., relaxed regulations, unchaining that mythical Promethean entrepreneur, etc.) all belong to the supply side of the problem; i.e., potential GDP. For the moment I’ll set aside the issue of whether or not the things you propose actually increase potential GDP, but I’ll circle back to it later.
Regarding long rung growth in potential GDP, the consensus view is that changes to the growth rate, as opposed to changes in growth levels, evolves very slowly. It takes a long time for positive supply side actions to work their way through the economy. Chad Jones has a nice chart in his draft paper “The Facts of Economic Growth” (April 2015) that shows the per capita GDP growth rate for the US. It’s been 2 percent per year since Reconstruction. It’s almost a natural law. The convergence rate for the US economy is very slow. Even if you release all kinds of inefficiently employed resources, it takes a long time to re-employ those resources in projects that have a higher marginal rate of return. Remember, we’re not talking transient aggregate demand falling short; this is about redeploying resources. It takes a long, long time. Generations. Firing government bureaucrats doesn’t automatically translate into higher potential GDP. Free trade agreements are another example. Over the very long run the economic growth rate increases with free trade, but it takes time. If you really want to increase potential GDP and the long run growth rate, then you need to concentrate on doing things that disburse knowledge and technology. Now there is a new NBER working paper (#23077…it’s very short…I read it over lunch yesterday) that argues “robots” are allowing us to avoid secular stagnation associated with an aging labor force, but even robots require knowledge and technology. And oh by the way, making knowledge more available means loosening up on excessively restrictive copyright and patent protections. The economy wants just enough copyright/patent monopolies to temporarily reward innovation, but not so much that those monopolies outlive their economic usefulness. There is almost universal agreement on this among growth economists.
Now, circling back to the things you cited as inhibiting growth. There is no evidence that Obamacare has hurt long run growth. Obamacare has almost certainly made the labor market more efficient to the extent that it unchains labor from employer based health insurance, which is a major drag on productivity. And there is considerable evidence that a generous welfare state encourages risk taking and innovation. It’s also not clear that regulations hurt growth. No doubt some do, but plenty grease the skids for growth. What happens in the absence of regulations? One answer is that the court system gets clogged up even more. One function of regulation is to decide issues in advance of court cases. And you absolutely need regulations over the financial sector. Every major recession we’ve had can be traced to a financial sector gone off the rails. It was true in the 19th century. It was true in the 20th century. And it is still true in the 21st century. Climate change legislation is something else that improves long run potential GDP because it correctly prices externalities. Yes, you can boost GDP in the short run by ignoring greenhouse gases and pollution, but you end up hurting potential GDP down the line. Ignoring externalities is always tempting for a politician, but it’s godawful economics. So if you’re worried about pushing out potential GDP, then you need to advocate for the very things that you generally argue against. You have a tendency to confuse cyclical models and growth models.
Finally, let me suggest that you pick-up a standard graduate textbook on macro. The first few chapters are almost always about various growth models and how to do growth accounting. For example, David Romer’s “Advanced Macroeconomics” is a standard text and it’s in its umpteenth edition, so you should be able to pickup a copy at a reasonable price. Warning: some math (first order diff eqns) is required.
2slugbaits, you’re the one confused. For example, I haven’t been talking about raising potential output. Instead, it has been closing the output gap. And, right, you have no idea what I was taught in undergrad and grad Neoclassical economics, which has a lot of math. Your misguided “normative economics” explains to a large extent why the economy is still depressed, although that’s beginning to change. Your explanation for the weak recovery, after the severe recession, is a financial crisis and the GOP. However, the prior financial crises didn’t have expansionary fiscal policy, very accommodating monetary policy, and TARP. And, the GOP had very little influence in 2009-11. Obama-Reid-Pelosi still had a lot of power after 2011 to compromise. It’s unsatisfactory Americans are much poorer today than otherwise, given trillions of dollars of lost output, since 2009. The top priority should’ve been to close the output gap, which would’ve raised tax revenue and reduced spending on the unemployed. Then, we can afford more government, including regulations.
PeakTrader No, you’re the one who is confused about the curves. Advocating policies that you think might make the economy more efficient operate on the supply side, not the aggregate demand side. Making the economy more efficient does not close the GDP gap…it widens it. The kinds of things you usually toss out operate on the supply side.
You’re right that a lot of prior financial crises did not have expansionary fiscal policy and accommodating monetary policies. They also lasted a helluva lot longer than the Great Recession. The financial depression in 1837 lasted almost 10 years and went a long way towards giving us the Civil War. The financial crisis of 1873 lasted at least 6 years in the US and persisted even longer in Europe. The Great Depression lasted more than a decade. The Great Recession was nowhere near that long or as deep as those recessions. But if you look at the data you will see that growth rebounded nicely in 2010 (from -2.5% to +2.3%), but fell to 1.6% when the Tea Party got all austerity crazy.
I agree that we should have had a lot more stimulus in 2009 through 2011. Given our braindead congress critters I don’t know if Obama could have gotten a bigger stimulus package, but it is still fair to blame him for not even trying. Instead he underbid and hoped to get a second bite at the apple later on. He never got that second bite.
If the federal budget were run more like Kansas or Wisconsin the 4% growth rate would be almost immediately reached [1].ALEC has plenty of papers to prove it.
[1] Just pass a bill stating growth rate *is* 4%. End of story.
How do the demographics factor into the analysis? In particular, the effect of an aging population?
Nick de Peyster
http://undervaluedstocks.info/
I stated before, the 2001-07 expansion was on top of the 1982-00 economic boom and the mild 2001 recession. Increasing trade deficits, which reached 6% of GDP in the mid-2000s, subtracted from GDP. We had a consumption boom at full employment in the 2000s. And, dollars were shifted from consumers to the federal government through foreigners, who bought Treasuries from trade deficits. We needed a big tax cut to refund consumers to allow the spending to go on, rather than a small and slow tax cut.
What I found funny here was Menzie understandably misinterpreting the word “potential” to refer to the potential GDP counterfactual used in macroeconomics. Whereas the policy statement clearly meant 4 percent potential as a “stretch goal” for actual GDP. It seems safe to bet that the policy grandstander was ignorant of the economics lingo of “potential GDP”.
This led me to consider the CBO’s methodology: http://www.cbo.gov/sites/default/files/cbofiles/ftpdocs/51xx/doc5191/03-16-gdp.pdf
Essentially the CBO leverages Okun’s Law and NAIRU. Okun’s Law is a widely-questioned free labor constraint upon output, and NAIRU is an imaginary parameter that was created to try to patch the failure of Okun’s Law to handle stagflation in the 1970s. In an increasingly automated economy, is it really useful to estimate potential output as s a linear function of unemployed hours x a productivity constant?
Since my paycheck does not depend upon me not understanding it, I question what we learned from carefully analyzing the plausibility of pom-pom-waving forecast actuals versus dubious counterfactual potentials?
Dan Nile: I understood Trump-Pence used potential in the general sense of the word. But since actual growth cannot substantially exceed potential for long stretches of time (particularly if we are already near potential), it works out that potential growth delimits what you can get on average.
I’m questioning the well-accepted model assumption of a rigid anticorrelation between unemployment and inflation. That is, in practice how “potential GDP” is estimated.
In 2008 we had high unemployment and low inflation.
In 2017 we have low unemployment and low inflation.
Either the fickle NAIRU gods made this work out, or Okun’s Law and therefore the potential GDP numbers we are talking about are “not even wrong”. I think economists may have erred in assuming the robots and computers are improving productivity, when they are disconnecting the labor-output relation assumption of Okun’s “Law”. When capital can increasingly provision a unit of robot labor at will, I don’t know what it means to say that potential growth constrained by human labor availability limits average growth.