Those are estimated amounts of currency undervaluation, using the Big Mac index and the Penn Effect as of July 2016. Guess which currency is 3.7%, and which currency is 50.2%.
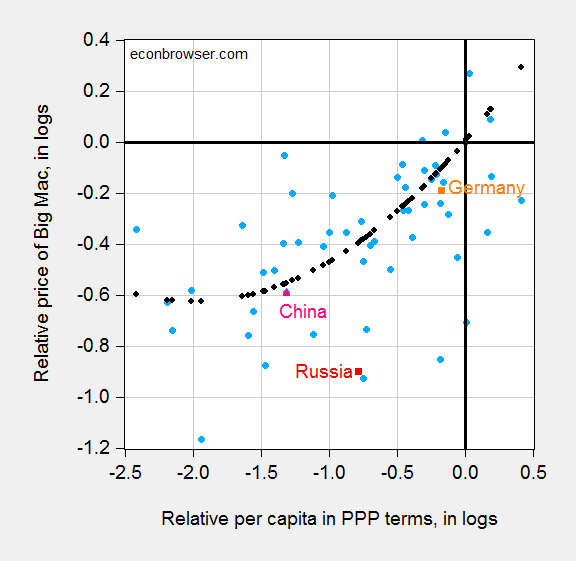
Figure 1: Log relative dollar price of Big Mac against dollar price of US Big Mac (July 2016) versus log relative per capita income in PPP terms (2016 estimates); regression fit from quadratic specification (black dots). Source: Economist, World Bank World Development Indicators, and author’s calculations. Data [XLSX]
50.2% undervaluation is Russia; 3.7% is China. 8.5% is Germany, the currency of which was highlighted by Peter Navarro. As shown in this post, the German estimate is well within the 90% prediction interval, while Russia (and Taiwan) are well outside the interval. Why isn’t the Administration threatening to impose trade sanctions on Russia (and Taiwan)? Not that I’m asking them to do it, but the selection of sanctions targets seem odd.
For a more formal examination of Chinese yuan undervaluation, see this paper; and for misalignment concepts in general, this post.
I find the Russian currency valuation arguments to be fairly oblique. 15 months ago, The Economist was claiming the ruble was well overvalued. http://www.economist.com/blogs/freeexchange/2015/05/russian-rouble
If it was just a matter of oil prices, then I don’t see the argument one way or the other as oil prices have been low for over two years… more than enough time for the ruble to have settled to either “overvalued” or “undervalued”, but not both.
Maybe the currency market is similar to the stock market with “experts” predicting up and down at the same time. Is it nothing more than expectations?
Bruce Hall: Well, I did explicitly say it’s just one approach (MacParity). You could try a Behavioral Equilibrium Exchange Rate model which incorporates a role for terms of trade (e.g., price of oil). Oops, Deutsche Bank said it was undervalued by 45% in March 2016. Maybe you can find some “estimate” (I use the word loosely) in ZeroHedge or the like. And by the way, the Economist article you link to only has a graph showing REER appreciation since 2002. That doesn’t prove over- or under-valuation (and I think Zsolt Darvas would agree). So don’t get your estimates from the Economist — try reading actual reports.
bruce,
check the tool of the economist (PPP and PPP adjusted for penn effect) and tell me where you see the ruble overvalued in 2015/2016
http://www.economist.com/content/big-mac-index
Can’t I believe Russia has 50% undervaluation? What does it mean? If you’re a currency trader how you we apply this knowledge?
I blog at pba-schedule.com