Steven Kopits, in response to my caution over using state level household based employment series, writes:
If you are telling me you’re smarter than BLS, go ahead.
Well, I don’t think I’m smarter than BLS. I just think it’s a good idea to know what kind of imprecision is associated with the series one works with — so without further ado, here are two vintages of household survey based civilian employment for Kansas. Tell me what you think…
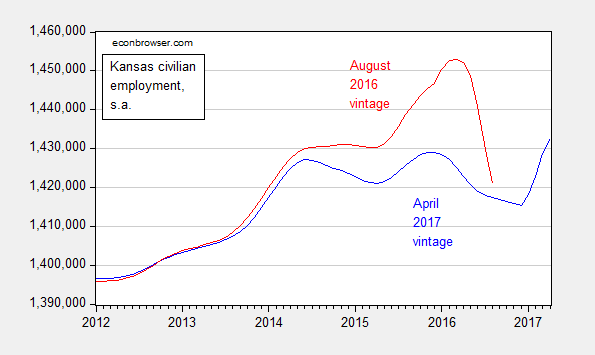
Figure 1: Kansas civilian employment, from April 2017 release (blue), and August 2016 release (red), seasonally adjusted. Source: BLS.
So, I’d take that surge in employment growth with a grain of salt…
I’ve mentioned this point about state level employment and labor force series, particularly for states with relatively small populations, following on Wolfers’ discussion.
To conclude, know your data! Not that the Brownback boosters will heed the call.
A picture of the nonfarm payroll series for Kansas (disastrous) vs. Missouri and the Nation, see here.
Update, 10AM Pacific: Steven Kopits has responded to this post on an earlier thread, so I reproduce below:
Let me also comment more broadly on the matter of credibility.
You may think that you are advancing liberal causes with attacks on Kansas governance. However, when I revert to the actual statistics, and see your claims are at best misleading, it calls into question your motivation and credibility. And this is the more so when we extend these posts to a longer stretch, with memories of the joys of ‘good’ Minnesota v ‘bad’ Wisconsin.
I am frankly accustomed to your spin by now, but conservatives will not draw the lesson you intend. Rather than question their ideological or policy orientations, they will take away the lesson that the left is well prepared to lie to them. And I mean this more broadly, not just to you specifically, but to the likes of CNN, MSNBC, the NYT and NPR, as well.
The left has no monopoly on spin, and Fox has become all but unwatchable when they are in a mood to slavishly support the President in the face of the most patent transgressions. Hence the surge in MSNBC ratings as those of us in the middle feel around for someone to give it to us straight, or at least straight-ish.
Nevertheless, the net result of all this partisanship is the implosion of belief in the press and any number of analysts as detached observers of the political scene. No one — or very few — retain credibility in this world.
I do not know whether this is compatible with democracy in the longer run.
Here is my response.
Well, first, we seem to be working off the same webpage, but I can’t tell, because you don’t link your source. If it’s the same page, then I am using the row of numbers literally four above yours.
https://www.bls.gov/eag/eag.ks.htm
Now, you seem to be arguing that the BLS has a chronic upward bias in presenting civilian, and by extension, farm employment in the state and you are arguing that, in fact, the non-farm payrolls are correct and the civilian employment numbers are wrong. Well, ok, but I probably would have mentioned the discrepancy had it been my post.
Let me further say that your own graph shows that Kansas out-performed Missouri from Jan. 2011 to late 2015. So Brownback was superior, by your metrics, for the first four years of his administration, faltering only since early 2015.
Now, what happened in early 2015? Oh yes, oil, gas and commodities fell apart, with Kansas losing 4,000 jobs in the mining and logging sector over the last four years, with a particularly rapid roll-off from Q1 2015. No doubt direct job losses were associated with indirect losses in services and manufacturing of another 2000+ jobs.
https://data.bls.gov/timeseries/SMS20000001000000001?amp%253bdata_tool=XGtable&output_view=data&include_graphs=true
So, if you want to make a nice post about why the BLS civilian employment numbers are consistently over-stated, go ahead, by all means.
Nevertheless, the data as provided by BLS directly refutes your own assertion, as indeed, do your own metrics for the four years to Jan. 2015.
And I continue to stand by my statement regarding credibility.
Steven Kopits: No, you are (I think deliberately) misreading what I wrote. I am asserting that it is better to put higher weight on a series that has lower degrees of imprecision, and subject to smaller revisions (i.e., the establishment series) than on a series that has a higher degree of imprecision, and subject to larger revisions. I don’t actually know if the household series at the state level is upwardly biased or downwardly biased; I just know it’s a relatively low information series — as you can see from the figure.
By the way, this is the same principle as is used in Bayesian model averaging.
Off topic, but is there a reason why more administrative data isn’t used to help improve accuracy of these series? I mean, the IRS has to have a pretty good idea of payroll additions/subtractions every month, right?
Absolutely correct. The HH survey is much smaller, and the establishment survey gets tied back to its population (the UI records) every year.
I haven’t read the original post, but the idea that the establishment data is generally more accurate, particularly at the state level, is clear.
Have you looked at state employment trends using the American Community Survey instead of the CPS, which, I believe, is the basis of the state household employment numbers?
gregc: No, although those numbers only come out once a year. Quarterly Census of Employment and Wages comes out more frequently, but with about a six month lag.
Menzie, what do you make of the information from the Philadelphia FRB Coincident Economic Activity Index? Kansas appears to be enjoying a marked acceleration in growth. The index for Kansas is up 9.3 at an annual rate over the first four months of this year. https://fred.stlouisfed.org/series/KSPHCI
Neil: No idea, I’m afraid. But mechanically, it must be the contributions of the other three variables (avg. hours in mfg., unemployment rate, real wage and salary disbursements) have changed drastically.
Problem: it took more than 8 years for Kansas to reach the level of employment (1.4335 million) reached in September, 2008 when the labor force totaled 1.504 million. In fact, bls this past September, pegged the number of employed Kansans at 1.416 million with a labor force down to 1.48 million.
For five of those years, the Brownback hyperbole failed–can we say miserably?–to accomplish what it claimed it would. Texas, here we come? Best package for growth in the country? Not.
At the same time, the Kansas labor force has not increased (bls May data shows 1.487 million potential workers, a very slight increase from the 1.481 million five years ago when the legislature enacted Brownback’s cuts).
Interestingly too, others on this site have noted the difference in the unemployment rate in Kansas and California, although comparing the two is similar to comparing an orange and an almond. What’s seldom mentioned, however, is that while Kansas has seen a 34% decrease in its unemployment rate, since May 2012, California has experienced a 55% decrease during the same period.
That shot of adrenalin into the heart of the Kansas economy seems more like daily shots of cheap bourbon that keep the drinker reeling until such time he can swear off the hard stuff and let nature take its course.
In another (meth) lab of right-wing policy, we’ve found out in the last week that Wisconsin’s job growth dropped by 70% in 2016 vs 2015, and that the Milwaukee metro area had the largest job loss of any metro area in America.
https://jakehasablog.blogspot.com/2017/05/wisgop-and-corporates-make-milwaukee.html?m=1
Those low unemployment numbers in Kansas and Wisconsin are due to people LEAVING IN DROVES. Kinda hard to get growth if that happens