Today, we present a guest post written by Jeffrey Frankel, Harpel Professor at Harvard’s Kennedy School of Government, and formerly a member of the White House Council of Economic Advisers. A shorter version appeared in Project Syndicate on September 25th.
During most of 2017, the VIX — the Volatility Index on The Chicago Board Options Exchange — has been at the lowest levels of the last ten years. It recently dipped below 9, even lower than March 2007, just before the sub-prime mortgage crisis. It looks as though, once again, investors do not sufficiently appreciate how risky the world is today.
Known colloquially as the “fear index,” the VIX measures financial markets’ sensitivity to uncertainty, in the form of the perceived probability of large changes in the stock market. It is inferred from the prices of option on the stock exchange (which pay off only when stock prices rise or fall a lot). The low VIX this year signals that we are in another “risk on” environment, when investors move out of treasury bills and other safe haven assets and instead “reach for yield” by moving into riskier assets like stocks, corporate bonds, real estate, and carry-trade currencies.
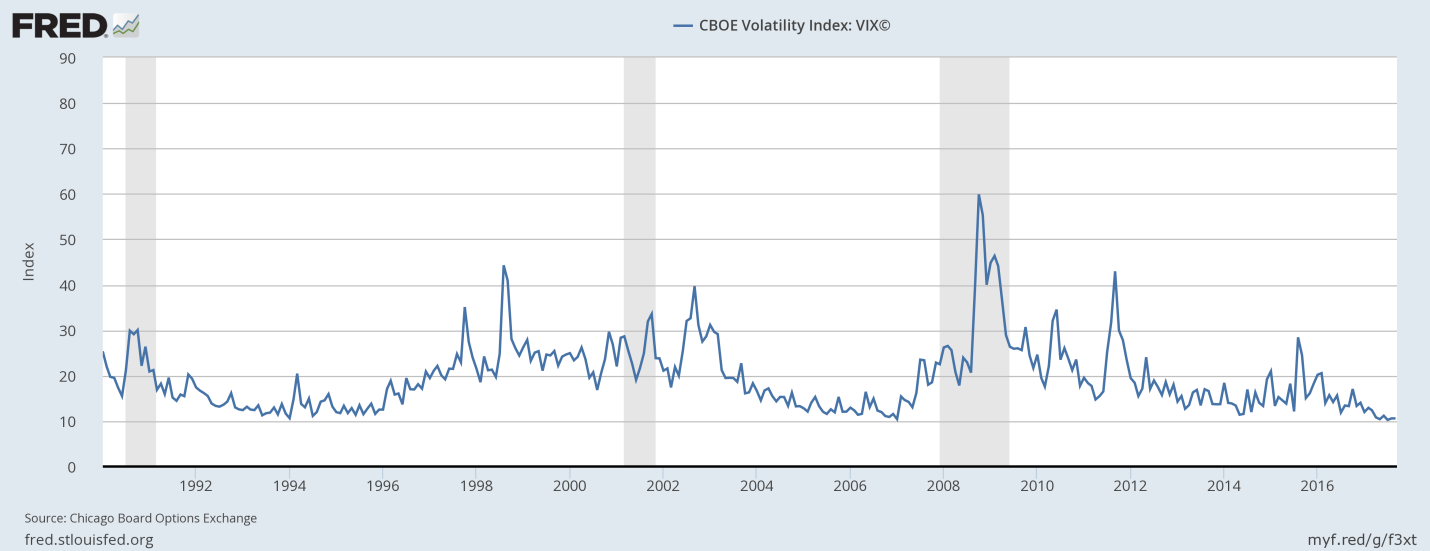
Figure 1: VIX: Less concern about risk, even, than in 2006-07
One need not rely exclusively on the VIX to see that the markets are treating the current period more as a risk-on opportunity than risk-off. The returns on safe-haven assets were generally lower than the returns among risk-on assets in the first half of the year. On the one hand, the Swiss franc depreciated. On the other hand, the Australian dollar and Chinese yuan appreciated. And the stock market has hit record highs.
True risk is currently high
Why do I presume to second-guess the judgment of the VIX that true risk is low? One can think of an unusually long list of major possible risks. Each of them individually may have a low probability of happening in a given month, but cumulatively they imply a worrisome probability that at least one will happen sometime over the next few years:
- Bursting of stock market bubble. Major stock market indices hit new record highs this month (September 12), both in the United States and worldwide. Equity prices are even elevated relative to such benchmarks as earnings or dividends. Robert Shiller’s Cyclically Adjusted Price Earnings ratio is now above 30. The only times it has been this high were the peaks of 1929 and 2000, both of which were followed by stock market crashes.
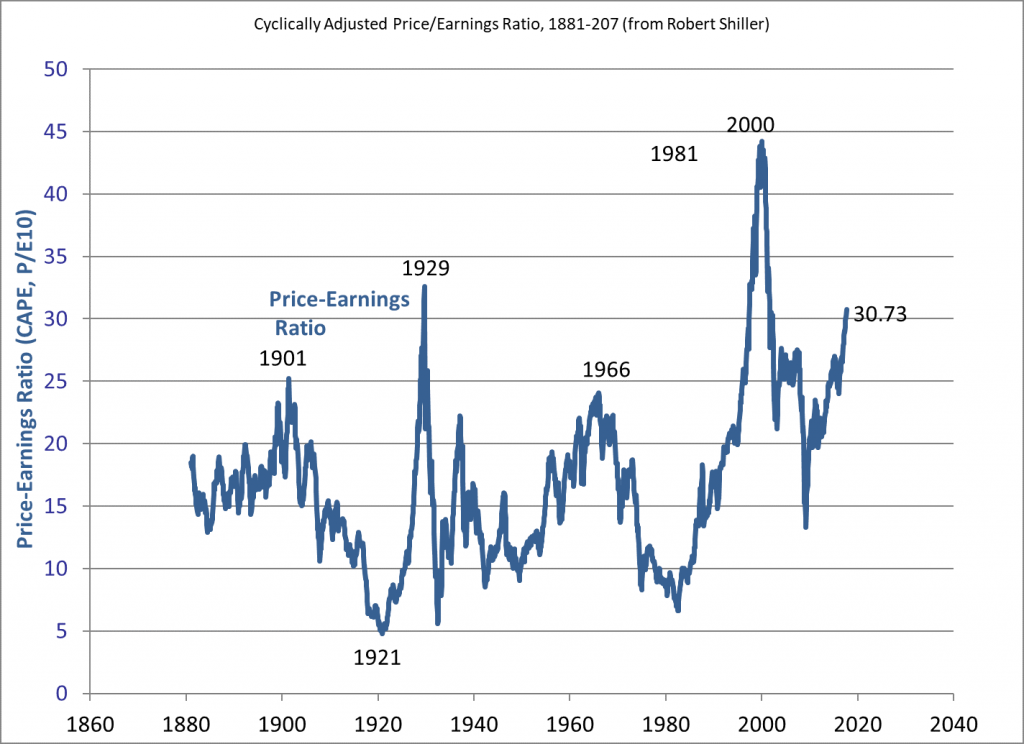
Figure 2: Stock market P/E (Shiller adjusted): At the 3rd-highest level of the last century - Bursting of bond market bubble. Alan Greenspan has suggested recently that the bond market is even more overvalued (by “irrational exuberance”) than the stock market. After all, yields on corporate or government bonds were on a downward trend from 1981 to 2016 and the market has grown accustomed to it. But, of course, interest rates can’t go much lower and it is to be expected that they will eventually rise.
- What might be the catalyst to precipitate a crash in the stock market or bond market? One possible trigger could be an increase in inflation, causing an anticipation that the Fed will raise interest rates more aggressively than previously thought. The ECB and other major central banks also appear to be entering a tightening cycle.
- Geopolitical risks have rarely been higher, and faith in the stabilizing influence of America’s global leadership has rarely been lower. The gravest risk lies in relations with North Korea, which Trump has not been handling well. But there are also substantial risks in the Mideast and elsewhere. For example Trump threatens to abrogate the agreement with the Iranians that is keeping them from building nuclear weapons.
- In many policy areas it is hard to predict what Trump will say or do next, but easy to predict that it will be something unprecedented. So far, the ill effects on the ground have been limited, in large part because most of the wild swings in rhetoric have not translated into corresponding changes in the law of the land. (If he really had stuck with his decision to kick 800,000 young DACA workers and students out of the country it could have caused a recession.) But this is a time of policy uncertainty if there ever was one.
- US Congressional showdowns over the debt ceiling and government shutdown were successfully avoided in September, but only by kicking the can down the road to the end of the year, when the stakes could well be higher and the stalemate worse.
- A constitutional crisis could arise, if for example the Special Counsel were to find that contact between the Trump campaign and the Russian government was illegal.

Black swans are not unforecastable
The current risk-on situation is reminiscent of 2006 and early 2007, the last time the VIX was so low. Then too it wasn’t hard to draw up a list of possible sources of crises. One of the obvious risks on the list was a fall in housing prices in the US and UK, given that they were at record highs and were also very high relative to benchmarks such as rent. And yet the markets acted as if risk was low, driving the VIX and US treasury bill rates down, and stocks, junk bonds, and EM securities up.
When the housing market indeed crashed, it was declared an event that lay outside any standard probability distribution that could have been estimated from past data, supposedly an example of what was variously declared to be Knightian uncertainty, radical uncertainty, unknown unknowns, fat tails, or black swans. After all, “housing prices had never fallen in nominal terms,” by which was meant they had not fallen in the US in the last 70 years. But they had fallen in Japan in the 1990s and in the US in the 1930s. This was not Knightian uncertainty, but classical uncertainty with the data set unnecessarily limited to a few decades of purely domestic data.
In fact the “black swan” analogy fits better than those who use the term realize. Nineteenth-century British philosophers cited black swans as the quintessential example of something whose existence could not be inferred by inductive reasoning from observed data. But that was because they did not consider data from enough countries or centuries. (The black swan is an Australian species that in fact had been identified by ornithologists in the 18th century.) If I had my way, “black swan” would be used only to denote a tail-event that could have been assigned a positive probability ex ante, by any statistician who took the care to cast the data net widely enough, but that is declared “unpredictable” ex post by those who did not have a sufficiently broad perspective to do so.
The risk-on risk-off cycle
Why do investors periodically under-estimate risk? There are specific mechanisms that capture how market analysts fail to cast the net widely enough. The formulas for pricing options require a statistical estimate of the variance. The formula for pricing mortgage-backed securities requires a statistical estimate of the frequency distribution of defaults. In practice, analysts estimate these parameters by plugging in the last few years of data, instead of going back to previous decades, say the 1930s, or looking at other countries, say Japan. More generally, there is a cycle described by Minsky whereby a period of low volatility lulls investors into a false sense of security which in turn leads them to become over-leveraged, leading ultimately to the crash.
Perhaps investors will re-evaluate the risks in the current environment, and the VIX will adjust. If history is a guide, this will not happen until the negative shock – whatever it is – actually hits and securities markets fall from their heights.
This post written by Jeffrey Frankel
Just curious how much greed and fear play into this as much as failure to cast a wide enough statistical net.
Cancer
Just curious how much greed and fear play into this as much as failure to cast a wide enough statistical net.
Jeff,
You say:
“The formulas for pricing options require a statistical estimate of the variance. The formula for pricing… In practice, analysts estimate these parameters by plugging in the last few years of data, instead of going back to previous decades, say the 1930s, or looking at other countries, say Japan. ”
Since many students read econbrower and might be confused about the discrepancy between what they learn in class and this statement, let me, at the risk of being pedantic, point out that this is not true. As one prominent textbook, John Hull’s “Options, Futures, and Other Derivatives” puts it in Section 14.11:
“The one parameter in the Black-Scholes-Merton pricing formulas that cannot be directly observed is the volatility of the stock price. In Section 14.4, we discussed how this can be estimated from the history of the stock price. In practice, traders usually work with what are known as implied volatilities. These are the volatilities implied by option prices observed in the market.”
Section 14.11 continues:
“Implied volatilities are used to monitor the market’s opinion about the volatility of a particular stock. Whereas historical volatilities are backward looking, implied volatilities are forward looking. Traders often quote the implied volatility of an option rather than its price. This is convenient because the implied volatility tends to be less variable than the option price. As will be explained in Chapter 19, the implied volatilities of actively traded options are used by traders to estimate appropriate implied volatilities of other options.”
Jeff,
You say:
“The formulas for pricing options require a statistical estimate of the variance. The formula for pricing… In practice, analysts estimate these parameters by
plugging in the last few years of data, instead of going back to previous
decades, say the 1930s, or looking at other countries, say Japan. ”
Since many students read econbrower and might be confused about the discrepancy
between what they learn in class and this statement, let me, at the risk of being
pedantic, point out that this is not true. As one prominent textbook,
John Hull’s “Options, Futures, and Other Derivatives” puts it in Section 14.11:
“The one parameter in the Black-Scholes-Merton pricing formulas that cannot be
directly observed is the volatility of the stock price. In Section 14.4,
we discussed how this can be estimated from the history of the stock price. In
practice, traders usually work with what are known as implied volatilities.
These are the volatilities implied by option prices observed in the market.”
Section 14.11 continues:
“Implied volatilities are used to monitor the market’s opinion about the
volatility of a particular stock. Whereas historical volatilities are backward
looking, implied volatilities are forward looking. Traders often quote the
implied volatility of an option rather than its price. This is convenient because
the implied volatility tends to be less variable than the option price. As will
be explained in Chapter 19, the implied volatilities of actively traded options
are used by traders to estimate appropriate implied volatilities of other
options.”
Note: Sorry if this comment is duplicated: the econbrowser server is behaving strangely.
Jeff,
You say:
“The formulas for pricing options require a statistical estimate of the variance. The formula for pricing… In practice, analysts estimate these parameters by plugging in the last few years of data, instead of going back to previous decades, say the 1930s, or looking at other countries, say Japan.”
Since many students read econbrower and might be confused about the discrepancy between what they learn in class and this statement, let me, at the risk of being pedantic, point out that this is not true. As one prominent textbook,
John Hull’s “Options, Futures, and Other Derivatives” puts it in Section 14.11:
“The one parameter in the Black-Scholes-Merton pricing formulas that cannot be
directly observed is the volatility of the stock price. In Section 14.4,
we discussed how this can be estimated from the history of the stock price. In
practice, traders usually work with what are known as implied volatilities.
These are the volatilities implied by option prices observed in the market.”
Section 14.11 continues:
“Implied volatilities are used to monitor the market’s opinion about the
volatility of a particular stock. Whereas historical volatilities are backward
looking, implied volatilities are forward looking. Traders often quote the
implied volatility of an option rather than its price. This is convenient because
the implied volatility tends to be less variable than the option price. As will
be explained in Chapter 19, the implied volatilities of actively traded options
are used by traders to estimate appropriate implied volatilities of other
options.”
Note: Sorry if this comment is duplicated: the econbrowser server is behaving strangely.
unfortunately, while i do monitor the vix, i am woefully out of touch with the details of its calculation and necessary inputs. it seems as though it is driven through options types of instruments to predict future movements. these types of instruments are typically used by more “sophisticated” investors, especially those working directly in the financial industry. over the past decade, it appears as though more and more retirement money is moving into more passive investment strategies (401k index and target year funds) that are not what one considers actively managed or hedged. how much of the growth of passive investing is impacting the behavior of the vix? what i wonder, is there a way the measurements from the vix have been watered down by an increase in money that does not use tools the vix uses? or is the vix methodology immune to this effect? can any of you with expertise in the vix provide a primer on how exactly the vix is calculated?
Baffled,
The VIX index is a volatility index which measures the market’s expectation of the volatility of the S&P500 index over the next 30 days. The formula for calculating it, which is complicated, does not depend on an option pricing formula such as Black-Scholes and uses a wide variety of short-dated S&P 500 index options, both puts and calls, with various strike prices, and expirations more than 23 days but less than 37 days. I won’t go through the excrutiating details but will give you a more high level description of what happens in the calculation. Here are the steps:
Step 1: Start with with the formula for the expected average variance of the S&P 500 index over the next T days. This formula, which is used to calculate the VIX, essentially takes each put and call price with the same expiration and weights them by the inverse of the square of the strike price of the options. The intuitive reason for this weighting scheme is that it corrects for the sensitivity of the price of an option with different strike prices to the underlying implied volatility of the option. Prices of in and out-of- the-money options are more sensitive to changes in volatility, holding other factors constant.
Step 2: Interpolate between the variance calculated for options with expirations before 30 days and options with expirations after 30 days to get an estimate of the variance over the next 30 days.
Step 3: Annualize that 30-day variance, take the square root of it to get volatility, and then multiply by 100 so that the index is expressed in percentage points
Thanks rick. What i am curious about is how the vix is impacted by volume. In particular, it would appear to me (although i most definitely could be wrong here) that the greater number of option contracts which exist versus the number of tradable shares for a stock could have an impact on the vix? My question is related to what appears to be an increasing number of shares moving into rather passive investment vehicles-ones that probably play little role in the buying and selling of options. Does the vix work strictly off of the number of options contracts, without regard to any concept of available shares to trade, or unavailable to trade? What i mean by available are shares that are actively moving in the market versus locked into say a retirement account, where the owner has given no indication of a buy or sell because they have no options behavior. Would this change the average value of the vix compared to a different time period when a different ratio of available stocks vs options existed? In particular, is the concept of low vs high vix (and volatility) normalized?
Baffled,
To answer your question, the VIX calculation depends only on SPX options quoted with non-zero bid prices. It does not depend on available shares to trade or unavailable shares. The number of options used in the VIX calculation will vary however, since the number of SPX options quoted with non-zero bid prices will vary with the level of general SPX volatility. In general, as vol rises, the number of options available for use in the calculation will tend to rise, and vice versa as vol falls.
On your other question, the VIX is not normalized. A low VIX just means that realized vol of the SPX is also low on average, since as I mentioned, the VIX is an estimate of the market’s expectation of the volatility of the SPX over the next 30 days. There is a subtlety here though. The VIX is a “risk neutral” expectation, meaning that it contains a variance risk premium besides an expectation of future realized vol. So, we’d not expect the VIX to be an unbiased predictor of future realized 30-day vol. But it should be in the same ballpark.
“In general, as vol rises, the number of options available for use in the calculation will tend to rise, and vice versa as vol falls.”
thanks rick. this is exactly what i am interested in. i am curious how much this relationship has changed over the past decade or so. and if so, could it affect our interpretation of what is a high or low vix number? it seems over time, the vix seems to be settling toward lower values during lower stress environments, and am curious as to why this has been happening.
JF says: “The gravest risk lies in relations with North Korea, which Trump has not been handling well.”
Hasn’t Trump, and Nikki Haley, done an excellent job tightening the noose around North Korea, and getting other countries to go along, including China?
Prior Administrations have not been effective dealing with North Korea, which is why Trump inherited Fat Boy on the verge of possessing nuclear missiles that can reach the U.S..
It appears as though North Korea is firing missile technology imported from trump’s bff, putin.
Maybe, Trump will give Putin a present – like Crimea.
JF says: “…kick 800,000 young DACA workers and students out of the country it could have caused a recession.”
The U.S. has the dumbest immigration policy in the world. We’ve allowed tens of millions of very poor foreigners, with little education, skills, and wealth, and their subsequent children and families, while the annual H-1B quota, for only 85,000 high skilled workers, gets filled in less than five days.
“The U.S. has the dumbest immigration policy in the world. ”
my best friend came to america several decades ago in his mothers womb, poor and homeless. his father worked as a roofer in LA for decades while his mother raised three beautiful children. All three children completed college, and two are faculty at major universities. They are all successful, and raising families of their own. peak, the only dumb thing about the US immigration policy is that it let somebody like you across the border. what a waste of the american dream you have become.
I guess, you never been in the many parts of LA that look like the poor cities the immigrants came from. In your world, those places don’t exist. They all came here with nothing and through the magic of substantial government services, they’re living in Beverly Hills teaching physics at UCLA.
When there isn’t a doctor to help you out, at least you’ll be content there are plenty of roofers.
Most poor immigrants are hard working and grossly underpaid. However, to get the economy moving, we need fewer low skilled immigrants and more high skilled immigrants, to raise low income wages, reduce spending on government services, including education, create better jobs, taxpayers, businesses, etc.. The economy cannot absorb too many poor immigrants, their children, and their relatives. Perhaps, that’s why so many domestic teens and young Americans dropped out of the labor force or work part-time, dependent on their parents or government, and displaced by more productive immigrants willing to work cheaply.