If one was looking back at the data available a half a decade ago, an observer (not me) might have concluded that there was a hiatus in per capita output that signalled an end to growth.
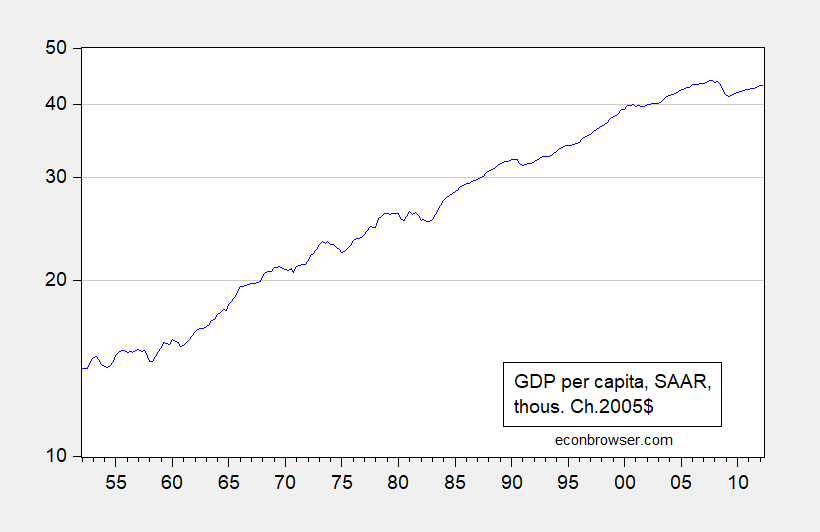
Figure 1: GDP per capita in thousands of Chained 2005$, SAAR, as of September 28, 2012, calculated using GDP and population reported at that date. On log scale. Source: St. Louis Fed ALFRED, and author’s calculations.
This is an analogue to the argument set forth by those who asserted the lower temperatures after 1998 signalled the imminent end of global climate change.
As we know, GDP per capita continued to grow. Here is the graph with the most recent GDP series (today’s release) compared against the 2012 vintage, both normalized to 2005Q=1, on log scale.
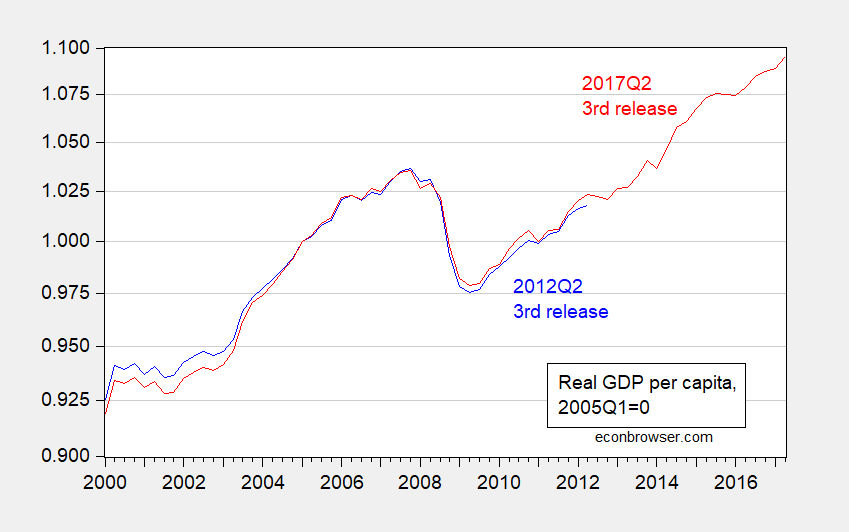
Figure 2: GDP per capita in thousands of Chained 2005$, SAAR, as of September 28, 2012 (blue), and as of September 28, 2017 (red), both normalized 2005Q1=1 On log scale. Source: St. Louis Fed ALFRED, FRED, and author’s calculations.
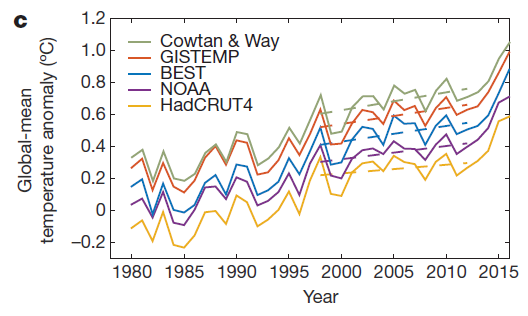
Returning back to the question of whether there was a “hiatus” in global temperatures, here is a conclusion from a relevant paper, published in 2017.
From Medhaug et al. (Nature, 2017):
None of the five current observational datasets for [Global Mean Surface air Temperature] GMST shows a negative linear trend for any duration of more than five years starting in 1998 (Fig. 2c and Extended Data Fig. 1). This supports the finding that there was no decadal-scale hiatus when the hiatus is defined as a period having zero or negative trends and starting in 1998 (ref. 37). HadCRUT4, on the other hand, has a negative decadal trend, but only for periods starting in 2001 or later, and lasting for up to 12 years (Extended Data Fig. 1). Differences across datasets are caused by different data sources, calibration of different instruments, homogenization and interpolation in areas without data38 (see Methods). This makes interpreting and understanding the reasons for the differences in the observational datasets more difficult.
Figure 2c is reproduced below:
Interesting similarity: using the NOAA global temperature anomaly, the 0.61 degree c recorded in 2002 was only slightly less than the 0.67 degree c in 1998 which climate change skeptics focus on (the 90% confidence interval is +/- 0.8 degrees c). That’s a four year “hiatus”. It took six years for per capita GDP to exceed the prior peak.
Menzie, I will be gone today so will not be able to argue any points, but your comment: “This is an analogue to the argument set forth by those who asserted the lower temperatures after 1998 signalled the imminent end of global climate change.” is AFAIR is untrue. I do not remember skeptics saying climate change has ending. [Climate change
Climate change is a change in the statistical distribution of weather patterns when that change lasts for an extended period of time (i.e., decades to millions of years). Climate change may refer to a change in average weather conditions, or in the time variation of weather around longer-term average conditions (i.e., more or fewer extreme weather events).]
I do however, remember skeptics claiming the surface warming has stopped, (in hiatus), and since none of the models predicted a hiatus of that length indicated the models were wrong.
There are a couple of problems with the paper.
1) Use of non-standard data sets Cowtan & Way, and the BEST instead of HadCrut, and the satellite data. Cowtan & Way was created with V1 being released in 2014 and Berkley Earth Surface Temperature (BEST) was released in 2012.
2) Use of the current changed data sets for comparison. Using the changed data makes it impossible to the data set versions available during the hiatus time frame. I did capture the Hiatus in the main datasets near its end: http://agw-alarmism.blogspot.com/
3) Even the paper admits the existence of the hiatus: “Conclusions and implications
The hiatus no doubt was, and still is, an exciting opportunity to learn for
many research fields. …”
4) Use of a revised definition of the hiatus: “Hiatus characteristics and definitions
The ‘global warming hiatus’ often refers to the period starting around 1998 and ending around 2012, During which the annual-mean area-weighted GMST did not seem to increase as much as was expected
from increasing atmospheric greenhouse gas concentrations….”
Strangely in that paragraph they admit:
“In the literature, three main definitions are used..” none of which are the same as their unique definition, and they admit:
” In addition to different definitions, studies also use different start and end years, and different datasets in their analyses…” As confirmed by my URL reference above.
The main climatology lessons from the hiatus is that the science is far from settled, a common claim of the era. That the models did not project/predict a hiatus of such duration. Santer 2011 claimed: “”Because of the pronounced effect of interannual noise on decadal trends, a multi-model ensemble of anthropogenically-forced simulations displays many 10-year periods with little warming. A single decade of observational TLT data is therefore inadequate for identifying a slowly evolving anthropogenic warming signal. Our results show that temperature records of at least 17 years in length are required for identifying human effects on global-mean tropospheric temperature.”
I am running out of time to continue, so that’s enough for a start.
CoRev, do you not understand the concept of sampling error? Do you even understand the words you are quoting? Let me delete some of the big words to make it clearer:
“A single decade of data is inadequate for identifying a slowly evolving warming signal… records of at least 17 years in length are required for identifying human effects on temperature.”
In other words, Santer is saying you can’t just take 5 data points out of a sample to identify a trend – the complete opposite of what you are saying. This is pretty obvious from the paragraph you quoted even without any context. That you can still so profoundly misinterpret it to me shows you read only what you want to read, both into Santer’s comments and into the temperature data.
What Menzie is saying, in case you didn’t pick up on that, is that temperature data not showing any growth for 5 years is no more evidence that climate models are wrong than recessions are evidence that growth models are wrong. Capisce?
P-hack at least know something about the subject, Hiatus, before commenting. Provided is a graph of the actual hiatus in the various commonly used data sets of the day. It was created sometime in the 2nd quarter CY 2015. http://agw-alarmism.blogspot.com/ At that point we were calculating hiatus duration using the monthly data, because it changed every time an El Nino occurred, then after ~ a year it would re-emerge, so if and when it occurred was important.
Santer’s comment was provided to show the importance of the length, and the meaning for AGW prior to the Hiatus becoming a serious embarrassment to the climate community.
Why are you citing some fictitious 5 year period. It has no relevance to the hiatus.
If you believe Menzie is trying to say looking at the overall trend from the start of the temperature records the trend is still positive? Absolutely, yes. I know of no one who wants to go back to the LIA conditions, even at its end.
If that, the positive trend continues, is what you think is important about the hiatus, then you and Menzie need more study. As a hint, it wasn’t skeptics who claimed the science was settled, and that we should be especially fearful because the climate models projected … (add your long list of failed/failing/unsupported empirically) projections here.
Actually, CoRev, what Menzie should have done is make the point that I and many others have repeatedly here, and which you ignore: that using 1998 as a starting point for any analysis of global warming trends is if not merely misleaiding, evidence of someone engaging in fraud and propaganda. 1998 was an extreme outlier on the upside. No analysis made of trends using it as a starting point should be treated with anything other than being tossed into the nearest waste basket accompanied by uttrer contempt for the person or persons putting forth such a bogus “analysis.”
Barkley I totally agree about 1998. The RSS hiatus starting date was 1997.1 going through 2014, and for a short while 2015. In the real works 1997 is before 1998. You do know RSS, right? Here is a Hiatus graph captured early in 2015: http://agw-alarmism.blogspot.com/
Please show all of us which data set shows the hiatus started in 1998.
But your argument (slightly modified): “(The LIA) 1998 was an extreme outlier on the (downside) upside. No analysis made of trends (and especially those EXTREME predictions/projections) using it as a starting point should be treated with anything other than being tossed into the nearest waste basket accompanied by uttrer contempt for the person or persons putting forth such a bogus “analysis.”
Yes, skeptics believe it has warmed since the LIA, and are truly happy with the VERY GOOD resulting from that warming.
Any paper falsely redefining the hiatus, searching for the redefined hiatus , except for one, data sets other then those available at the time, and then relying on those newer or adjusted/changed data sets as proof minimizing the hiatus should be treated as non-science and maybe even scientific fraud.
I know you must believe the hype provided by these climate scientists. After all you parrot their false claims without any critical thinking, but if a trend starting at a high point is bad, then climate models’ projections (not predictions because their outputs are good enough to be so called) trained on the temperature starting at a known and accepted low point are surely as bad. Indeed these predictions should be considered as exaggerations and treated with contempt, especially as time shows they are erroneous. (That’s big lies in skeptic country.)
But that’s just the view of a cynical skeptic.
The existence
CoRev: This is what you said two weeks ago:
the “pause” occurred after the 98 Super el Nino until the build up to the latest
This is what you said today:
hiatus starting date was 1997.1 going through 2014, and for a short while 2015.
Those seem like contradictions to me.
You also made a number rookie mistakes with your goofy trend line. Too many to cover here, but the most glaring is that since you agree that some of the years were El Nino years, others were La Nina years and other years were normal, then the correct procedure would be to set an separate intercept term for each possibility; i.e., add two additional dummy terms to the regression. Of course, you don’t have to bother because NOAA has already done that for you. They found three distinct intercept shifts that all share the same common positive trend.
2slugs, you are absolutely correct, there are multiple start dates depending on the data set tested/discussed. Since you find the difference more important than I tell us what the subject data set was in each quote.
Again, when you say: “They (NOAA) found three distinct intercept shifts that all share the same common positive trend.” For what period were you/NOAA testing, on which version of the data set, and even more importantly who cares. Most climatologists seldom do, I prefer to follow the knowledgeable scientists. Yano, there becomes a point when running standard statistical tests on the same data, unless they are to improve quality, is a waste of time and resources.
Why would this poor illiterate say something antithetical to standard statistical practices? Because the properties of these data are very well known. Moreover they have been tested many times over before even entering the data set. I can’t even guess how many times a single temperature reading has been processed by the time it reaches NOAA, the official repository, for NOAA processing into daily/monthly/annual sets. Unless you are looking for more than a trend going beyond OLS is wasteful. So what was the purpose of the NOAA test, you failed to provide a link to verify. Did they not trust the data in their control?
2slugs, here’s an excellent article describing why pounding the data with mora and complex statistical tests can be counter-productive: https://wattsupwiththat.com/2017/10/01/analysis-says-noaa-global-temperature-data-doesnt-constitute-a-smoking-gun-for-global-warming/
I know its fr
om WUWT, but panning the source because you dislike it is PURE LAZINESS.
Forf those who will refuse to read this article it’s title is: Analysis says NOAA global temperature data ‘doesn’t constitute a “smoking gun” for global warming’
It’s summary says this:
“The global temperature record doesn’t demonstrate an upward trend. It doesn’t demonstrate a lack of upward trend either…. When the global temperature record is tested against a hypothesis of random drift, the data fails to rule out the hypothesis. This doesn’t mean that there isn’t an upward trend, but it does mean that the global temperature record can be explained by simply assuming a random walk…”
Also included in this article is a nice synopsis of the processing done to the raw data to get a annual anomaly figure. Its well worth the read to better understand the underlying uncertainty in the data due just to the processing.
Just for Menzie, I don’t necessarily agree with his selected examples as they are there to illustrate the data quality issues and their potential impacts on conclusions drawn from the temperature data.
KISSing may be the best approach as I’ve already said.
I believe corev fails to understand what variability in the data is, and tries to use variability in the data to indicate a trend. If you remove one single data point, 1998, there is not even a hint of “hiatus”. His entire argument rests on a single data point in time to define a trend.
Baffled, you know better, unless you chose not to look at the URL provided in the last thread. I fnot here it is again: http://agw-alarmism.blogspot.com/
Only this paper provided by Menzie claimed 1998 as the starting point. Not those who showed the Hiatus in the various data sets where we just let the data tell the story. It was the hiatus deniers forced to lie about the data.
corev arguing about the hiatus is similar to trump claiming his inauguration crowd was the biggest ever! everybody knows its false, but the idiot spectacle keeps people watching to see what crazy thing is done next. people like to see how far stupid can be taken, i guess.
Baffled, I agree, “people like to see how far stupid can be taken, i guess.” Are you actually refuting the graph of the actual data already provided showing the hiatus in the major surface data sets? Or are you afraid of another little doubt creeping in?
I found it interesting that the Trump administration is now making claims of the “anti-hiatus” in which one quarter of 1.2% GDP growth followed by one single quarter of 3.1% growth is indication of skyrocketing growth.
Josep, we’ll just have to wait and see.
Menzie, please scan the many global warming comments to show us who and when a skeptic made the claim: “This is an analogue to the argument set forth by those who asserted the lower temperatures after 1998 signalled the imminent end of global climate change.” I’ve already asserted you’ve used the wrong term, climate change, versus what I think you actually meant anthropogenic global warming.
As in the past when you tried, if you find a skeptic making that comment, I think you will be taking a comment out of context.
If you meant anthropogenic global warming, then we need to consider the cause of the recent warming, another super El Nino. There is no credible evidence that ENSO is caused by mankind. The question has always been how much of the warming is natural and how much from man, because both exist.
A natural factor I am hoping gets resolved soon, si the AMO a leading or lagging indicator. If leading then much of the current warming and previous cooling can be explained. If temperatures return to near 2014 levels , then we can assume AMO is leading. If we do have a deep or extended la nina, then we can also assume, and temperatures go even deeper than 2014 then ENSO is a clear major player in temperature change. If we go even deeper then 2014, or re-enter the hiatus due to a major volcanic eruption , as is predicted in Bali, the we can assume that at least for the short term natural factors prevail over human (AGW and ACO2 is questionable as a major driver).
That is the importance of the hiatus. All those issues were being seriously questioned. There has been no resolution, but the issues remain to be answered. Climate science is trying to explain mother nature, and Mother Nature will eventually provide the answers.
CoRev: Some guy back in 2008 wrote:
That guy was a fella named CoRev. That guy wasn’t altogether definitive, but, quote: “All are omens for cooling.” To repeat: “All are omens for cooling.”
Menzie, why persist in out of contest commenting? How could you have actually missed the preamble to your own biased selection? Her it is again from your own pulled quote:
” It’s not that the planet is not warming, but the catastrophic predictions thereof, that deserve the PSHAW!! We have cooled for the past 8-10 years. The ocean temps are not rising. Lower Troposphere is not rising. Solar energy is not rising, and we are about to synchronize several of the major ocean current into their cold phases.?
That’s a pretty definitive list of omens to your emphasized and overly biased: “That guy wasn’t altogether definitive, but, quote: “All are omens for cooling.” To repeat: “All are omens for cooling.””
Your effort was in response to my request: “scan the many global warming comments to show us who and when a skeptic made the claim: “This is an analogue to the argument set forth by those who asserted the lower temperatures after 1998 signalled the imminent end of global climate change.” And yet in my already provided graph reference of the hiatus in the major temperature data sets continuing for an approximate seven years past that comment, only to be interrupted by another super El Nino.
To clarify, as I said in my earlier comments temperature change is NOT climate change, so I did not predict climate change. I did predict a continuation of several indicators/conditons for cooling (Lower Troposphere is not rising. Solar energy is not rising, and we are about to synchronize several of the major ocean current into their cold phases), which occurred for the next 7 years. Moreover continue today.
Do you refute the Hiatus graph already provided? Do you believe that the warming since the LIA was *bad*?
Menzie, while I am discussing the indicators for cooling, the ARCTIC Sea Ice, a Global Warming alarmists bogeyman for years, has risen for the past 6 years. That’s even while we have had two large El Ninos, http://www.woodfortrees.org/plot/nsidc-seaice-n/plot/nsidc-seaice-n/from:2010/trend
My comment you quoted was from 2008 and trend shift in Arctic Sea Ice was within two years of that comment.
I’m awaiting your answer t my above two questions.
CoRev and the Trump administration look at this chart of GDP from FRED and conclude that the blip at the end, 1.2% growth followed by 3.1% growth, is an anti-hiatus showing skyrocketing growth.
https://fred.stlouisfed.org/graph/fredgraph.png?g=fg57
When CoRev looks at climate data, he sees the opposite, a hiatus. For Republicans, cherry picked data series are just a Rorschach test for stupidity.
Joseph, did you look at the graph provided?
Do you believe starting a trend at at known low or high point and then making extraordinary claims for the trend is valid?
Do you believe that the warming since the LIA is *bad*?
Do you have a clue about climate science, because like so many most of your comments are just snark with no evidence of any subject knowledge?
Just wondering what your motivation is.
“Do you believe starting a trend at at known low or high point and then making extraordinary claims for the trend is valid?”
then perhaps you should stop using the 1998 el nino to defend your hiatus.
baffled, I see you have3 not looked at the graph I provided showing the “hiatus” in the various major data sets. Please, please, show us which starts in 1998. You are denying math and history.
CoRev You said: Forf those who will refuse to read this article it’s title is: Analysis says NOAA global temperature data ‘doesn’t constitute a “smoking gun” for global warming’
It’s summary says this:
“The global temperature record doesn’t demonstrate an upward trend. It doesn’t demonstrate a lack of upward trend either…. When the global temperature record is tested against a hypothesis of random drift, the data fails to rule out the hypothesis. This doesn’t mean that there isn’t an upward trend, but it does mean that the global temperature record can be explained by simply assuming a random walk…”
If there was any doubt in anyone’s mind about whether or not you (or that TV weatherman with a high school diploma) understand time series analysis, that comment just about clinched the case that you don’t. Recall that a couple weeks ago Menzie told you the same thing:
CoRev: Over 1979-97, ADF fails to reject unit root at 5% msl, KPSS (trend stationary null) test rejects at 5% msl, so suggests one uses estimate of trend off of first differenced series, rather than linear trend in levels. Estimated drift is positive. Oops.
Got it? Your response at the time led me to believe that you didn’t understand a word of what Menzie was saying and your latest quote confirms it. In levels the time series is non-stationary and you cannot reject a unit root. In other words, in levels the data shows a random walk. That’s exactly why Menzie used first differences and he found a positive drift term. In terms of the old Box-Jenkins approach this is equivalent to an ARIMA(0,1,q) with constant.
Menzie has gone back to 2008, but your record goes back a lot further than that. Over at Angry Bear you were arguing for many, many years that we were on the cusp of a cooling trend any day now…just right around the corner. You’ve been peddling this cooling nonsense for decades.
2slugs. I see you chose to NOT read the article. For years now you have complained about using OLS to determine trends instead the more complex randomness test. The whole purpose of addressing you was to point out that doing more testing than necessary can create some false messages. I don’t think you actually realize the meaning of random walk in the NOAA data for AGW and and all the catastrophic predictions. and especially for the implied trends in Menzies selected graphs in that other article.
It is your reliance on traditional statistical tests that makes you lose sight of the basic picture, and creates the kind of confusion to recommend removal of the seasonal components from averaged annual temperature data! When the simple tests used by most climate scientists.
My most recent response to you questioned why in a 138 year record how many times would such tests be required? Once twice 1 million to determine the same results from the first time they were done? Why not then just use OLS to determine a trend on such suspect data?
Read the section in the article on the processing done to the raw data to get an annual anomaly figure. Its well worth the read to better understand the underlying uncertainty in the data just duet to the processing, and the inherent quality issues. He then directs attention to the adjustments done to supposedly improve the data quality. These are the kinds things skeptics understand that few alarmists even admit exist.
My response to Menzie had to explain why I thought OLS was adequate because few actually believe the tightly bounded, highly correlated temperature record data requires the more complex tests. And my point: “Just for Menzie, I don’t necessarily agree with his selected examples …
KISSing may be the best approach as I’ve already said. ” was to re-confirms my original comment.
Some times I think logic seems to elude you in your efforts to make a gotcha point.
BTW do you think the warming since the LIA was *bad*?
CoRev few actually believe the tightly bounded, highly correlated temperature record data requires the more complex tests.
Ugh. Please take a course on time series analysis. Highly correlated data is exactly why you need to do those kinds of tests!!! It’s the autocorrelations that make the data non-stationary, and you cannot use OLS on a non-stationary time series. Taking first differences removes the autocorrelations.
I’ve read all that stuff on how raw data is processed. Nothing new or unusual here. Anyone who works with data understands that it has to be cleaned up before you can do anything with it.
As to the warming since the LIA, too much warmth is just as bad as too much cold. Just because I wouldn’t want to live in the arctic doesn’t mean I’d want to live the Arabian desert.
2slugs, again you step into the circle of your circular logic. You have claimed that the OLS trends can not be trusted, due to correlation in the temp data. “It’s the autocorrelations that make the data non-stationary, and youcannot use OLS on a non-stationary time series. Taking first differences removes the autocorrelations.” Isn’t calculating anomalies a type of first differences? Almost all the processed data is anomaly data.
You have recently denied the meaning, especially for AGW, for the data failing a randomness test and its importance: ” In levels the time series is non-stationary and you cannot reject a unit root. In other words, in levels the data shows a random walk. That’s exactly why Menzie used first differences and he found a positive drift term. In terms of the old Box-Jenkins approach this is equivalent to an ARIMA(0,1,q) with constant.” Calculating an OLS trend on anomaly data gives us one approximation. Menzie confirmed that positive trend. Did you even notice my question to Menzie re: his selection of 1965 as a start date? Menzie walked away.
You did a hand wave answer re: my comment about the processing adding its own level of uncertainty to already very uncertain data. You continued your waving of hands with: “As to the warming since the LIA, too much warmth is just as bad as too much cold.” Remember it was your concern that runaway warming was a fat tail possibility based upon these statistical tests against all logical and historical evidence. All you are doing is reinforcing your own bias using statistics.
What you and most alarmists using convoluted statistical testing are doing is refuting your own intuition evolved by living through the conditions. Worse you are reinforcing your own “warming since the LIA is bad” bias without evidence and then confirming the bias via statistics.
The problems with the “warming since the LIA is bad” concept is that there is almost zero historical evidence. Again going against your own intuitive knowledge and basic logic.
Why did I include logic? Because most of us agree that AGW exists. But, the big but, is it consists mostly from land use and burning of fossil fuels, without which our living conditions would be immensely compromised. Your preferred solutions deny these logical and intuitive facts, and ignore the impacts from land use.
Should have read: When the simple OLS tests are sufficient for most climate scientists.
@Temperature Change Alarmists let’s be clear. Our arguments center on the impacts, both environmental and to mankind, of the <1C total temperature change since the Little Ice Age (LIA). Some arguments center on statistical tests used to calculate the direction and add precision to the trend of that temperature change. The majority of arguments center on the actual impacts from the <1C change since the LIA, the cause of that warming, and what portion of that change caused by man.
The bulk of these arguments, regardless of view, are asinine. Asinine because we all have lived with this temperature change, and intuitively know the answers to all those arguments. Yes it has warmed, somewhat. More importantly the impacts are overwhelmingly positive for mankind, and mixed for the environment, and yes, man has caused some portion of the warming.
Those who disagree with those answers are very few and misguided. The craziest claim from this group is that runaway warming is possible.
Those few who believe mankind is 100% or overwhelmingly responsible for that <1C temperature increase deny that nature changes. And, yet when we have a natural event El Nino, which is a known increase in temperatures at specific areas of the surface, make claims of new records implying or explicitly blaming mankind's influence for a natural event. All of this, man's the blame, is due to the science's inability to assign irrefutable values for how much of the <1C change is due to man.
Those who blame the <1C temperature change on man deny that there are known natural cycles. The largest of thse cycles are the glaciations, and their associated interglacials. We all must agree that we are within an interglacial, and probably nearing the end. To deny the importance of that simple fact is what it takes to deny the overall trend of the interglacial. Just one example: http://jonova.s3.amazonaws.com/graphs/lappi/gisp-last-10000-new.png
The temperatures for this planet change, but the changes are in a very limited range of ~15 total degrees. Glaciations temperature changes are considerably less, in the ~5-7C range. The history for the current ice age, is a series of glacial events separated by interglacial events during the Quaternary period from 2.58 Ma (million years ago) to present.[1] From Wiki https://en.wikipedia.org/wiki/Quaternary_glaciation
What we are arguing over is the amount of time left in our current interglacial, and is cold worse than warm. The answer is obvious to most skeptics.
@Menzie, another just prior to your referenced paper showing the opposite of your reference. http://www.iieta.org/sites/default/files/Journals/IJHT/35.Sp01_03.pdf
“ABSTRACT
The period from 2000 to 2016 shows a modest warming trend that the advocates of the anthropogenic global warming theory have labeled as the “pause” or “hiatus.” These labels were chosen to indicate that the observed temperature standstill period results from an unforced internal fluctuation of the climate (e.g. by heat uptake of the deep ocean) that the computer climate models are claimed to occasionally reproduce without contradicting the anthropogenic global warming theory (AGWT) paradigm. In part 1 of this work, it was shown that the statistical analysis rejects such labels with a 95% confidence because the standstill period has lasted more than the 15 year period limit provided by the AGWT advocates themselves. Anyhow, the strong warming peak observed in 2015-2016, the “hottest year on record,” gave the impression that the temperature standstill stopped in 2014. Herein, the authors show that such a temperature peak is unrelated to anthropogenic forcing: it simply emerged from the natural fast fluctuations of the climate associated to the El Niño –Southern Oscillation (ENSO)
phenomenon. By removing the ENSO signature, the authors show that the temperature trend from 2000 to 2016 clearly diverges from the general circulation model (GCM) simulations. Thus, the GCMs models used to support the AGWT are very likely flawed. By contrast, the semi-empirical climate models proposed in 2011and 2013 by Scafetta, which are based on a specific set of natural climatic oscillations believed to be astronomically induced plus a significantly reduced anthropogenic contribution, agree far better with the latest observations.”
This reference is provided to show a different interpretation for the AGW signal shown early in your referenced paper:
” When we take these into consideration, what we are left with from the apparent hiatus is not inconsistent with the understanding of human influence on global climate. In fact, it increases the confidence in the dominant role of humans in long-term warming.”
I don’t remember seeing any reference supporting this claim, “dominant role of humans” in the paper.
Menzie this article is very informative regarding the current commenting strings re: climate: http://joannenova.com.au/2017/10/matt-ridley-never-experienced-anything-like-this-the-climate-debate-blackening/
A pull quote: ” In a normal scientific debate, there would be a normal distribution of opinions — with most minds walking the middle ground where Matt is. It’s only tribal politics and rampant bullying that can keep opinions split in a U-shape distribution with most “players” either completely for or completely against an idea. And this is what Ridley is experiencing.
One of those groups must be wrong. Perhaps both. But the U-shape polarized opinion state takes a lot of effort to maintain. There is high-speed-spin, and buckets of money required to centrifuge the minds out of the middle.
Skeptics are not the ones fighting to silence voices.”
There is seldom science discussed but the spin and emotion associated with each view. Most of the actual evidence is on the skeptics’ side, models running hot, model projections not confirming, hiatus, Arctic Sea Ice not following the narrative and the over reliance on individual weather events, El Ninos and storms. When presented with this evidence most of this denial, spin, and name calling begins.