The Bureau of Economic Analysis announced today that U.S. real GDP grew at a 3.0% annual rate in the third quarter. That is close to the long-term historical average of 3.1%, and better than the 2.1% we’ve seen on average since the Great Recession ended in 2009.
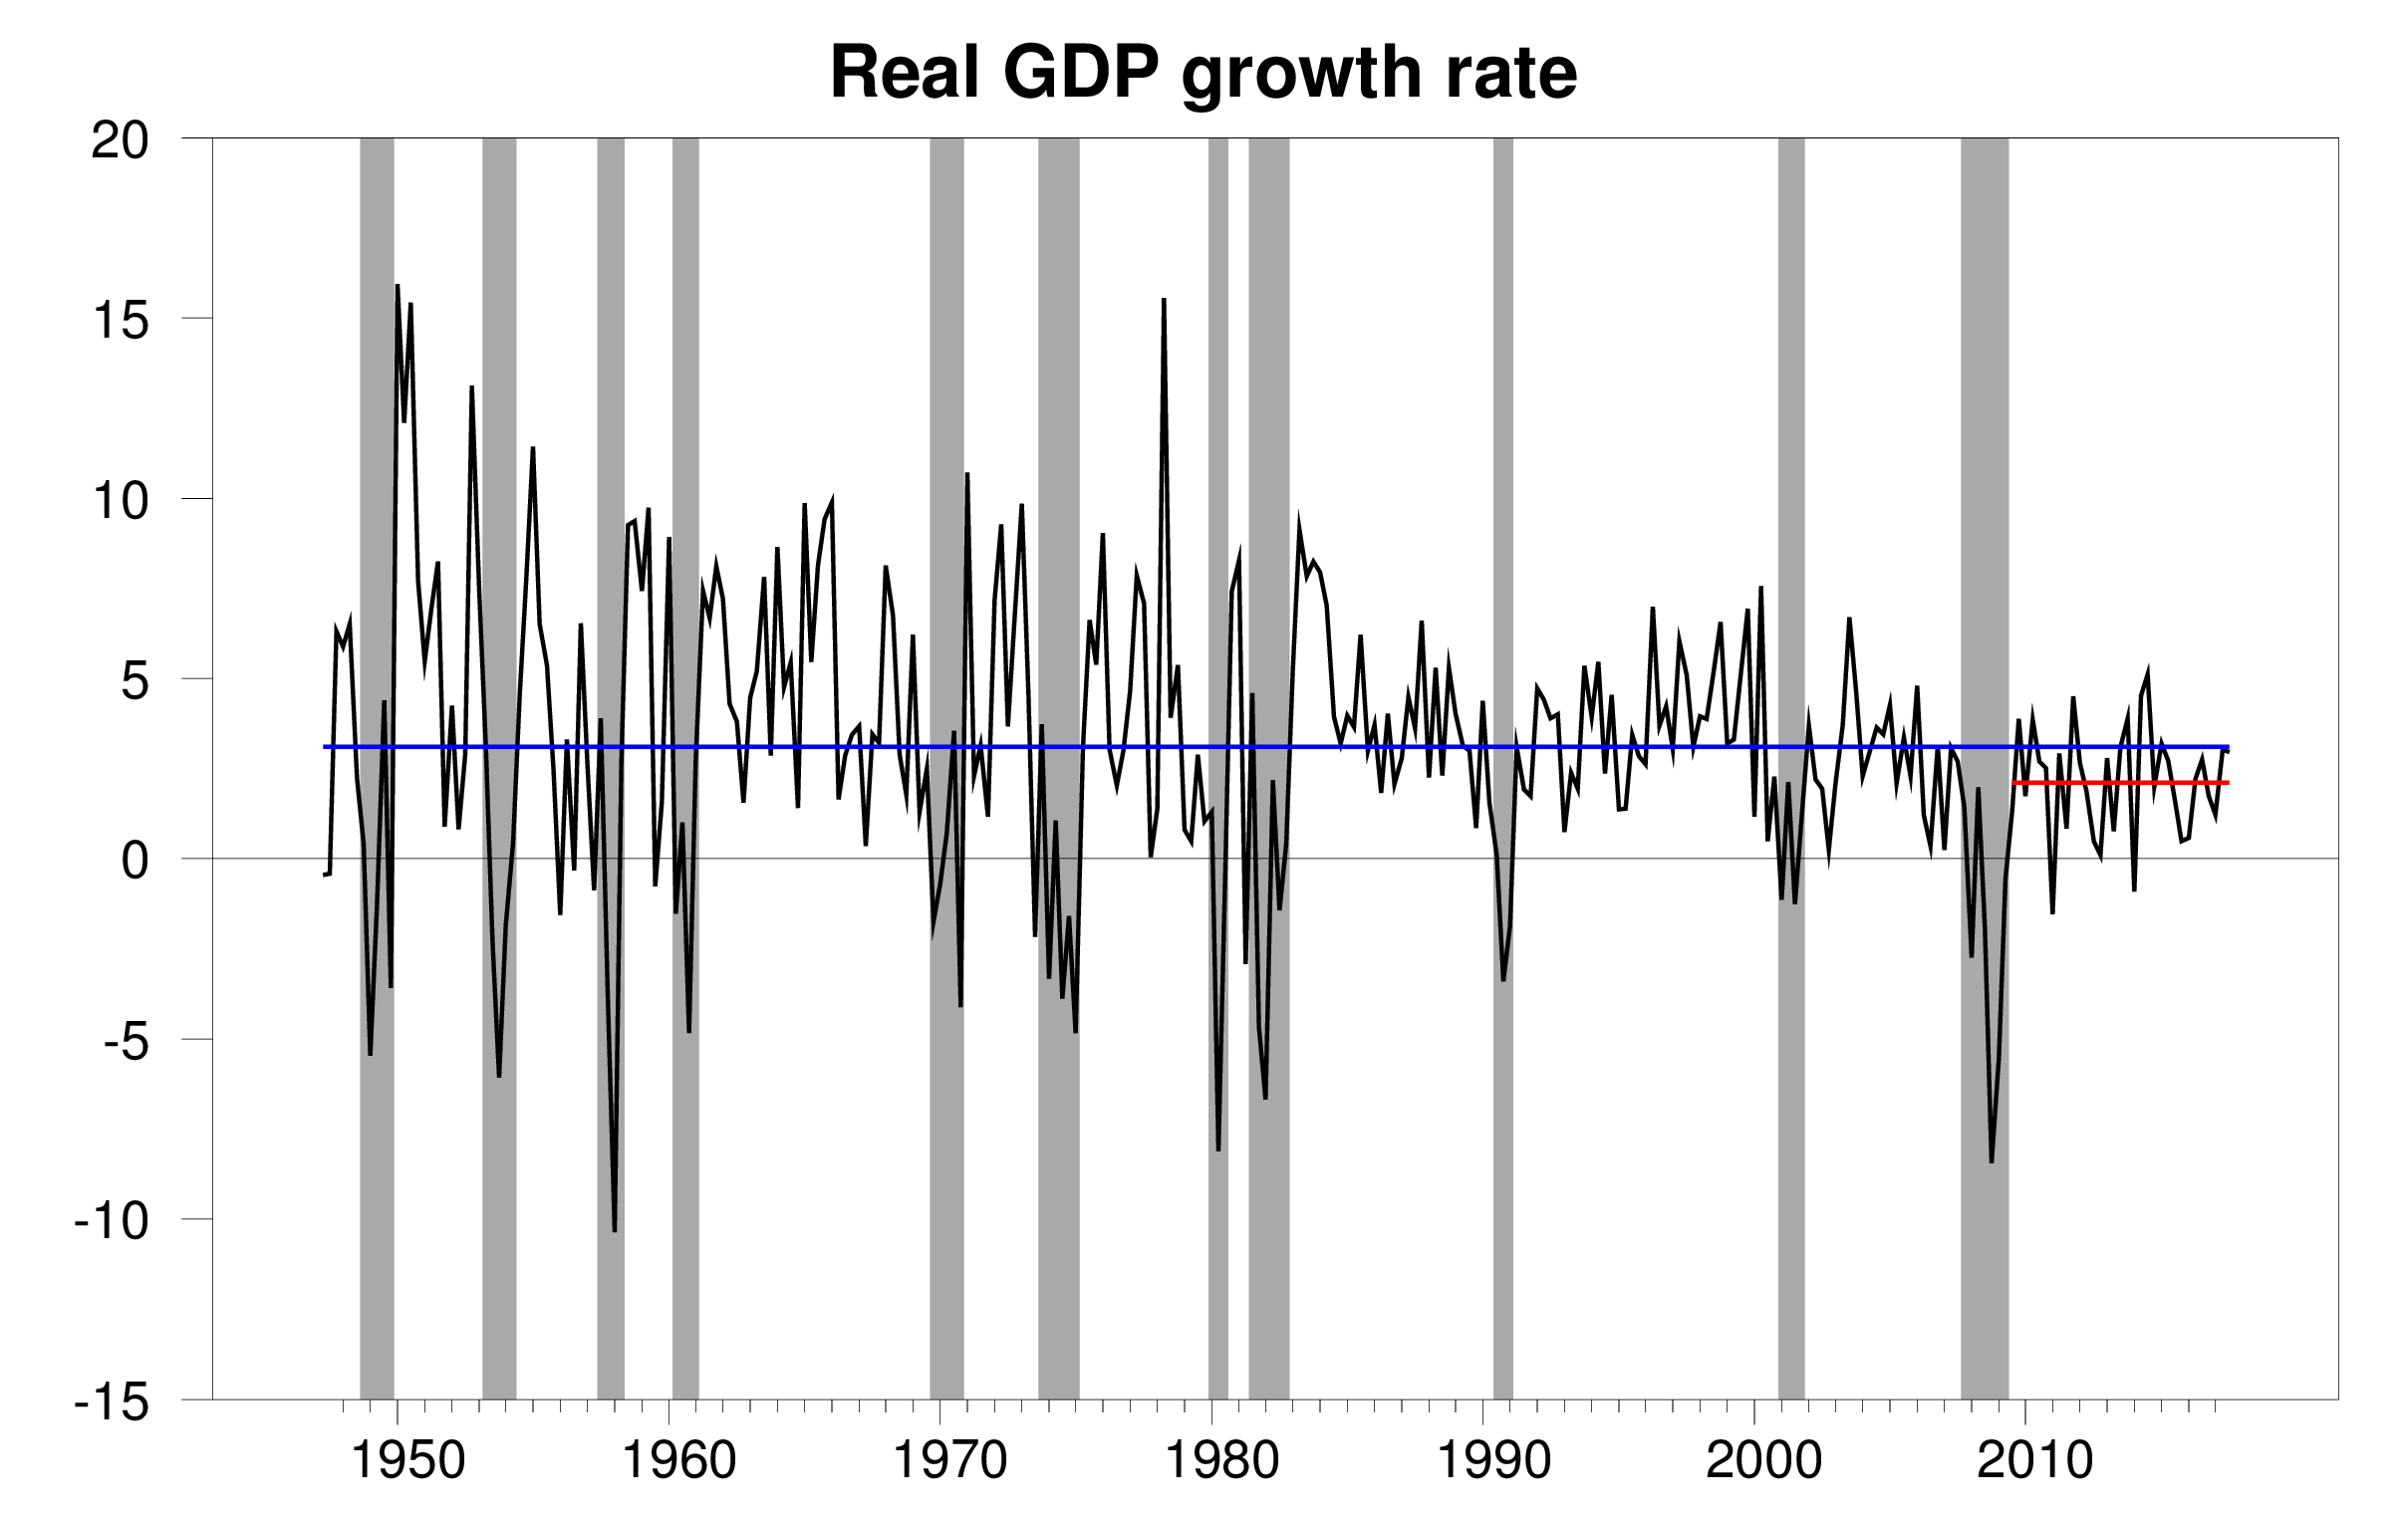
Real GDP growth at an annual rate, 1947:Q2-2017:Q3, with the 1947-2017 historical average (3.1%) in blue and post-Great-Recession average (2.1%) in red.
Solid growth over the last two quarters has brought our Econbrowser Recession Indicator Index down to 3.3%. The U.S. remains clearly in the expansion phase of the business cycle.
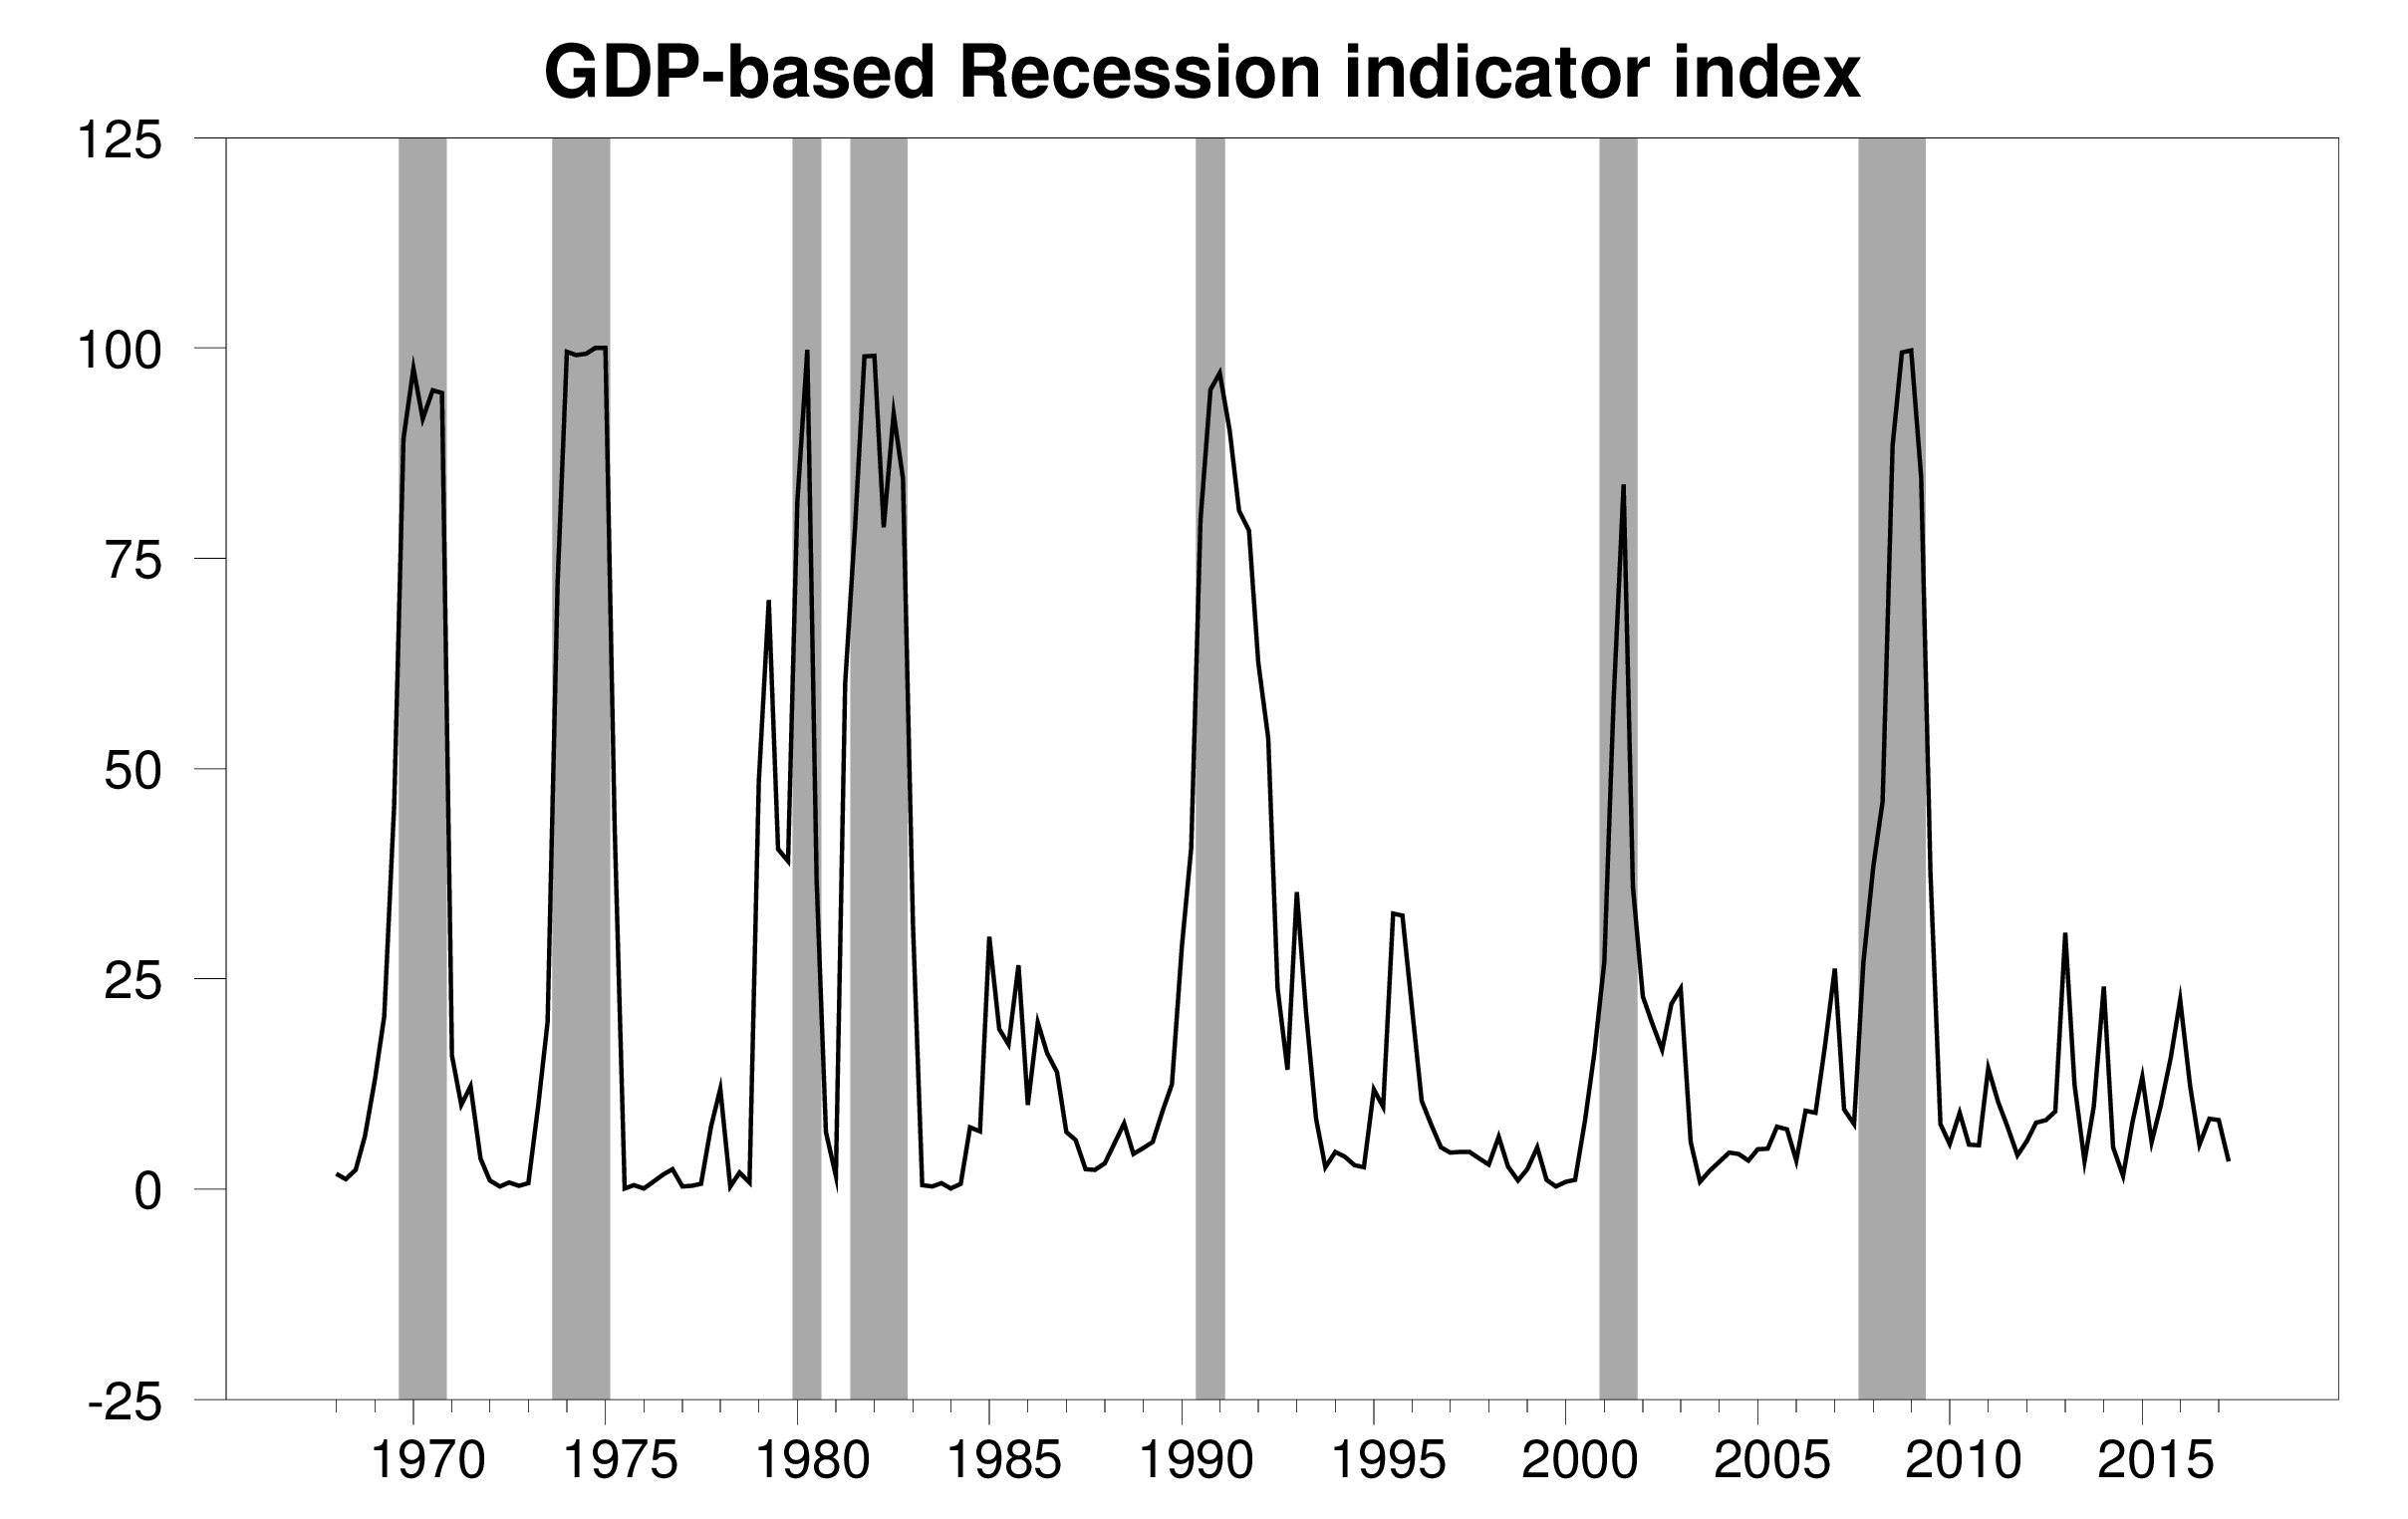
GDP-based recession indicator index. The plotted value for each date is based solely on information as it would have been publicly available and reported as of one quarter after the indicated date, with 2017:Q2 the last date shown on the graph. Shaded regions represent the NBER’s dates for recessions, which dates were not used in any way in constructing the index, and which were sometimes not reported until two years after the date.
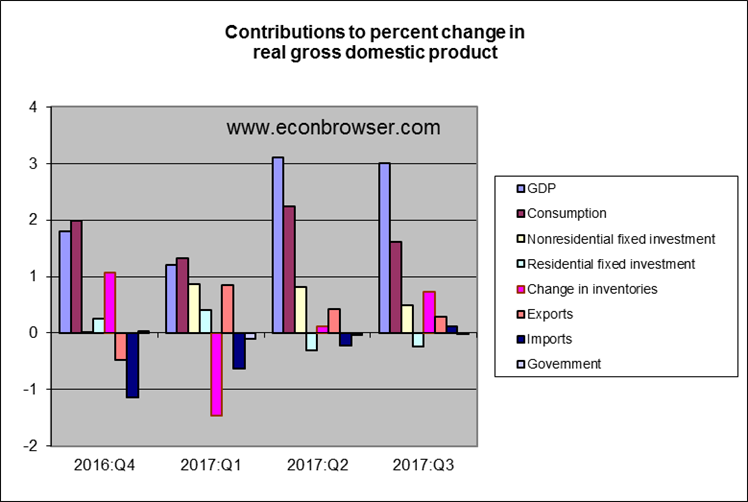
About a fourth of the growth in GDP came from inventory accumulation, with real final sales only up 2.3% at an annual rate. Inventory estimates are subject to significant revision and gains there should not be expected to be repeated. Nonresidential fixed investment continues to help, with 3/4 of the 2017:Q3 growth in nonresidential fixed investment coming from purchases of new equipment. Housing still isn’t making a positive contribution.
Consumption is weak and RI is negative. Any Keynesian would tell you this is problematic and a Minsky moment is still on the table.
Of course supply siders are cheering the inventory increase, but demand drives the economy.
Good news from private sector demand but BEA is noting nondefense Federal purchases and state/local purchases fell. I’m of the belief that we are not yet at full employment so it is not the time for austerity (or interest rate increases).
Professor Hamilton,
Trying to duplicate your regime probabilities output (as a learning experience), my regime 1 coefficient is 0.985031 and regime 2 is -0.358415. My resultant smoothed probability of regime 2 shows 3.335% or 3.4% rounded. Does this seem like a difference caused by different software (just asking to see if I am on the right track)? It took quite a few tries to get the software to find the negative coefficient.
Meant to say 3.35% rounded to 3.4%. Getting old and blind.
AS Your numbers are correct (as fixed in your update). Looks like I rounded 0.0335 down to 0.033 instead of up to 0.034. You’re right that if I’d calculated this to 5 digits I would have seen it was (very slightly) better to round up.
Thank you for your response!
Thanks for the updates.
Maybe I’m grabbing the wrong numbers but I am confused by the historical growth rate of 3.1%… how did you calculate it?
The economy expanded at a 3.11% average annual rate in 1946-2016.
It averaged 2.13% in 2009-2016, in spite of tremendous stimulus spending and an explosion in federal debt. It would’ve been even worse, except trade deficits narrowed, which added to GDP, and we had the fracking boom in the private sector, which also addded to GDP. Basically, the federal government spent trillions of extra dollars for a depression. The small and slow temporary tax cuts and enormous help from the Fed offset some of the failure. The spending multiplier was less than unity. We’re now in a weak position to deal with the next recession.
We need big permanent tax cuts, massive deregulation, and a smaller government to get the economy back on track.
Per capita real GDP remains well below a long run trend. Chart:
https://www.advisorperspectives.com/dshort/updates/2017/10/27/q3-real-gdp-per-capita-2-34-versus-the-2-99-headline-real-gdp
Robert Barro predicted in 2010 the stimulus plan would be a failure. He called it “garbage” and “the worst since the 1930s.”
UCLA Anderson forecast – U.S. economy falls short of true recovery – June 2013
“U.S. real GDP is now 15.4 percent below the normal 3 percent trend. To get back to that 3 percent trend, we would need 4 percent growth for 15 years, 5 percent growth for eight years, or 6 percent growth for five years, not the disappointing twos and threes we have been racking up recently, which are moving us farther from trend, not closer to it. It’s not a recovery. It’s not even normal growth. It’s bad.”
Peak Trader has finally decided to cite an actual economist and not some Forbes pretender. Of course the reason Barro made this prediction is that he is the architect of Barro-Ricardian equivalence. Peak Trader also omits the comments from economists who note that Barro has misapplied his own proposition. BTW Barro also predicted that the Reagan tax cuts would not lead to a rise in consumption (a prediction that both undercuts Peak’s spin and one that was quite off).
I do wish Peak would actually try to understand what he is posting here.
Pgl, your response to the Forbes article completely ignored the economics and the “actual” economists in the article. You have a most shallow view of economics. Barro was very favorable towards Reagan’s economic policies – big tax cuts lead to stronger growth and smaller budget deficits. So, consumption rises.
Also, I stated before, because of large trade deficits in the 2000s, where consumers bought foreign goods and foreigners bought U.S. Treasury bonds, a large tax cut was needed to refund consumers and allow the spending to go on.
PeakTrader Paul Krugman also predicted the stimulus plan would be a flop, albeit for completely different reasons. The stimulus was large enough to stave off catastrophe, but not large enough to “pluck” the economy back to trend growth. And in July of 2011 Barro predicted that Quantitative Easing would lead to runaway inflation. That was more than six years ago and we’re still waiting.
http://www.telegraph.co.uk/finance/economics/8618623/Fiscal-stimulus-doesnt-work-claims-Harvard-economics-professor-Robert-Barro.html
2slugbaits, many economists were too optimistic.
Unfortunately, economic policies continued to stunt growth and keep inflation low.
rtd: 0.031 is 4 times the average change in the natural logarithm of real GDP from 1947:Q2 through 2017:Q2. 0.021 is the average over 2009:Q3 to 2017:Q2. Spreadsheet with these calcs can be found at http://econweb.ucsd.edu/~jhamilto/gdplev.xls
In 2009, the 1930s called and asked for their economy back. Obama said sure and gave us average annual growth in real gdp of 1.4%. They called Trump too. Fortunately, he said no.
Nothing to get excited about … yet. If we see three quarters at 3%+, then we can talk breakout. More than likely, this is just a little noise.
PeakTrader
many economists were too optimistic.
Offhand I can’t think of “many” economists who were overly optimistic about the Obama stimulus. No doubt there were plenty of politicians who were overly optimistic, but politicians are dumb asses so I discount pretty much everything they say.
Unfortunately, economic policies continued to stunt growth and keep inflation low.
This is a bizarre comment. The very economists you seem to agree with were also the very same economists who worried about inflation heating up and proposed policies that would keep inflation low. You complain that the Obama stimulus package wasn’t robust enough while simultaneously complaining about the large deficits during the Great Recession. That’s just weird. And then to gild the lily of weirdness, you seem perfectly fine with Trump’s $1.5T in tax cuts that will further increase the debt. I think you need to explain yourself, and linking to some braindead Forbes article hardly counts as a reasoned argument.
2slugbaits, typically, after a severe recession, stronger growth is expected to close the output gap, initially, particularly given monetary and fiscal policies, along with TARP, although there could be subpar growth thereafter.
I’ve been for a middle class tax cut. Also, tax reform is needed to simplify the tax code.
And, there’s no contradiction. I stated back then, there should be a $700 billion tax cut ($5,000 per worker) with a boost in unemployment benefits (rather than extensions). I think, that would’ve been a much more effective stimulus. And, some deregulation, rather than more regulation, was needed. Stronger growth would’ve raised the inflation rate and reduced budget deficits.
PeakTrader I’m stunned that you still don’t see how you are contradicting yourself. On the one hand you’re perfectly comfortable with massive tax cuts that would create equally massive deficits; and then in practically the same breath you bemoan huge deficits. On the one hand you cite Taylor and Barro, and then turn right around and call for more inflation. You’re all over the ballpark.
BTW, I have no idea how you came to the conclusion that a $700B tax cut would represent $5K per worker. I hope you’re smart enough to know that you cannot take $700B and simply divide by the total number of workers. You do know that, right?
As to increasing unemployment benefits, this effectively raises what economists call the efficiency wage and there might be good reasons for doing so when the economy is at full employment; but it makes almost no sense if you’re trying to reduce unemployment during a deep recession. The smart play would be to throw money at projects via increased government spending. Cutting taxes is a pretty ineffective way to stimulate aggregate demand.
As to deregulation, I think you need to be more specific. Some industries clearly need more regulation, not less. And the kinds of regulation that people usually cite as choking economic growth are primarily at the state and local level, not the federal level.
2slugbaits, obviously, you don’t see the connection that a big tax cut would’ve closed the output gap faster leading to more tax revenue and less spending on the unemployed, which would be more inflationary, than the less than 2% inflation rate.
There are ways to rebate or refund $5,000 to each worker quickly and that money would be used to strengthen household balance sheets and raise monthly discretionary income. Each individual would use that money the best way they see fit rather than much of it being squandered on slow moving and inefficient government projects.
Moreover, a boost in unemployment benefits would also jolt the economy into stronger growth. People tend to wait till their unemployment benefits are about to expire before starting a new job.
Only a stronger economy can absorb more regulations. If you want more regulations, then you want more than 2% annual growth.
Furthermore, a big tax cut and a boost in unemployment benefits would’ve also strengthened the banking sector.
JDH While most of the comments here have focused on the words ” economic growth continues”, I don’t think enough attention is paid to the leading adjective “steady”. Looking at your graph the most striking result is not the difference between the red and blue lines, but the difference in volatility between the pre and post Great Recession periods. “Steady” indeed. I’m wondering if the economy might need the occasional large positive shock that overshoots the equilibrium path. The post-Great Recession growth path suggests a strategy of returning to a long run trend from below.
Housing is the key.
Wonder, when housing makes a positive contribution …
Bill says it will (sometime), but when …
Am i correct in believing the 3.1% is an annualized rate. Why not quote the annual rate which I think is 2.3%?
Also is this the first estimate which has m more assumptions in than I have had hot dinners. Why not wait for the second estimate like we do down under?
you yanks do strange things
not trampis: The quarterly growth in GDP quoted at an annual rate is essentially 4 times the quarterly growth in GDP quoted at a quarterly rate. A graph of the series at a quarterly rate would look exactly like the first figure quoted above (with the scale on the vertical axis just divided by 4), and the recession indicator would be numerically identical whether one multiplies the quarterly rate by 4 or not.
It is simply a matter of convention that Europe tends to report the growth at a quarterly rate and the U.S. at an annual rate. Which you do matters zero for anything.
You seem to be raising the question of whether the year-over-year change is a more useful number than the quarter-over-quarter change. There are advantages and disadvantages of both. The year-over-year helps average out noise and gives a longer run picture. The quarter-over-quarter change emphasizes the most recent developments.
Thanks Jim, Any reason why the US is an outlier ( pun intended) in these matters? I would have thought that noise would make annualised numbers if not useless less than useful. .Is a true growth figure for the US Economy 3% or 2.3%. I know which one I would be using and I wouls ignore the first estimate as well.
This first estimate of GDP used to be held internally and nothing was released until the second estimate.
But the first estimate was widely leaked so all of wall street knew what the first, unpublished, estimate was.
They decided they could not stop the leaks, so they stated releasing the estimate as official data.
Back in January Menzie Chinn said he thought growth in the 3.5-4% range was “unlikely”. I wonder if he is having second thoughts now.
Mate an annualised rate of 3% is not quite useless but nearly so. The annual rate is 2.3%.
no-one but no-one anywhere else looks at annualised data for GDP.
The USA is again unique in this.