Plotting nominal dollar value of inward FDI understates the collapse in inflows. Here is the ratio to GDP, and — considering how FDI covaries with the stock market’s level — the real S&P 500 (As I recall, working on this topic during the dot.com boom, the dollar’s strength was the other important factor — but that hasn’t changed much over the last three years.)
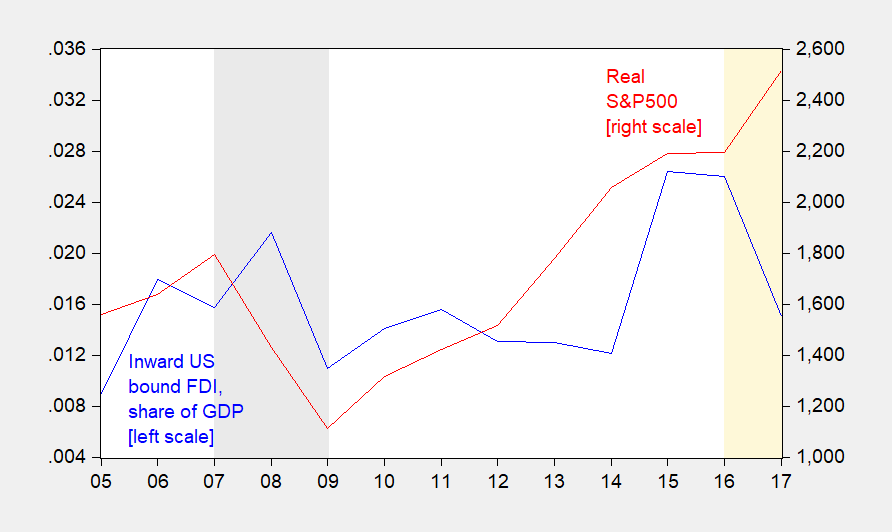
Figure 1: Inward US bound FDI as a ratio to nominal US GDP (blue, left scale), and real S&P 500 (red, right scale). NBER defined recession dates shaded gray. Trump administration denoted by orange shading. Deflation using CPI. Source: OECD, BEA 2017Q3 advance via FRED, Robert Shiller, NBER, and author’s calculations.
Note that given the correlation between stock prices and FDI, I would’ve expected higher levels of inflows. If you are wondering why, remember that for the US, greenfield FDI is a small share of total.
It’s been observed that world, OECD, as well as US, inflows have all declined, to varying degrees. The US is itself a large share of world FDI inflows. Moreover, just because it’s happening worldwide doesn’t mean the US isn’t the source of the shock. As I documented in my article in the Nikkei newspaper, global economic policy uncertainty has been (apparently) driven by US trade policy uncertainty.
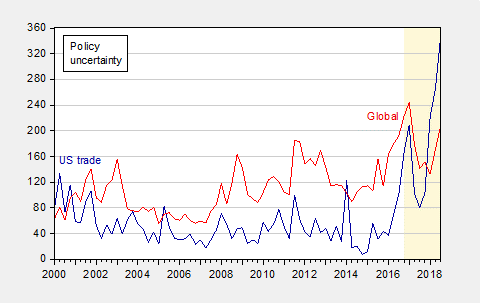
Figure 2: US trade policy uncertainty index (blue, left scale), and global economic policy uncertainty index (red, right scale). Shaded area denote post-election period. Source: Baker, Bloom and Davis, at policyuncertainty.com.
I didn’t do any fancy econometrics, but I’m willing to bet US trade policy uncertainty Granger causes global over the last decade.
Nice. An attempt at modeling aka an explanation.
Yesterday PeakWhatever decided to tell us FDI was up under Trump. OK – he is known to lie a lot. Barkley began this pointing out of the real data which led PeakWhatever to insult Barkley childishly. PeakWhatever also criticized us for having no explanation. #1 – it is important to get the facts right first which PeakWhatever did not do. #2 – PeakWhatever’s confusion of facts v. explanations notwithstanding – what theory has he put forward? You got it – NONE!
We have one attempt at explanation now. I wonder Peaky will be ‘rebut’ with – WHATEVER!
Pgl, you’re a liar and an idiot (from your busy track record). Below is what I actually said:
Trump deserves credit attracting foreign businesses and keeping American businesses in the U.S. by reducing the corporate tax rate, repatriation tax, other business taxes, and regulations.
The article I posted shows the Trump pro-business policies will increase FDI, all else equal.
Maybe, you believe pro-business policies aren’t good for business.
I cited Germany as a proxy to support what I said:
https://www.google.com/amp/s/global.handelsblatt.com/companies/us-german-business-ties-strong-in-spite-of-trump-938193/amp
I’m the liar? Facts are lies in Trump world I guess. BTW – why do you always have to Google to find something else for you to misrepresent?
The 2nd sentence of Peaky’s Googled citation is perfect:
“Tariffs and Twitter tantrums have done little to dent the healthy business relations between the United States and Germany.”
Notice how Peaky goes off on tantrums whenever confronted with facts that undermine his incessant spin as in
“Trump deserves credit attracting foreign businesses and keeping American businesses in the U.S. by reducing the corporate tax rate, repatriation tax, other business taxes, and regulations.”
Yep – even after Menzie and others have shown that overall FDI has declined, he still tries to tell us that it has risen. Doubling down on clear lies is the order of the day. Can’t wait for Peaky’s next temper tantrum!
Good Lord – the incompetence of PeakTemperTantrum is staggering. It took me seconds to find this historical chart of German FDI into the US (2000-2017):
https://www.statista.com/statistics/188889/foreign-direct-investment-from-germany-in-the-united-states-since-1990/
Yes from this one single nation, FDI rose a wee bit in 2017. It rose a lot under Obama. So maybe it was Obama’s policies that increased German FDI into the US. Then again we saw a surge in overall FDI in 2015 and 2016 before it retreated in 2017.
Then again – I am making the sin of reporting facts. Like I said – cannot wait for Peaky’s next temper tantrum!
Professor Chinn,
1. It looks like there may be a missing axis set of values on your policy uncertainty chart.
2. Looking at the web page “policy uncertainty .com”, did you choose the Excel spreadsheet column “L” for the US Category “Trade Policy”? Using column “L” and the Global “GEPU_Current” spreadsheet, I seem to show a chart a bit different from yours. I assume you are correct and that I am looking at the wrong data.
Thanks
AS: 1. Both series are on left axis. 2. The trade policy uncertainty index is quarterly average of monthly data, and could’ve been revised since I downloaded it. The Global index might differ from what you have as I used market GDP weights (I think).
Thanks.
“I didn’t do any fancy econometrics, but I’m willing to bet US trade policy uncertainty Granger causes global over the last decade.”
Would the analysis be a simple VAR with monthly data from 2008 to the present or is something more complicated required to test Granger Causation running from US trade policy uncertainty to Global economic uncertainty?
https://www.youtube.com/watch?v=Iyr74Rs6BWU
Could China’s pullback on investment in USA Treasuries and commodities have much to do with this?? I mean as a percentage of the overall FDI pullback?? Accepting and bearing in mind those are retaliatory measures to Trump’s drawing the first blood on free trade, I’m just wondering what ratio that would be in the total of the FDI drop of the last year—or 18 months or so.
I very much wish I could add a “supplemental hypothesis” or “minor sub-plot” to Professor Chinn’s Policy Uncertainty Granger causes “informal” explanation. But it appears on this subject (as on many others) my brain power is limited.
Menzie
Is it possible that much of the effect shown by your graphs is actually a measure of the effect of reinvested profits into the US by the holders of FDI. That those who hold investments in the US have percentage of in mind as to the total amount they wish to invest annually. And since corporate profits were so weak around the years of 2015 and 2016, that they had to use their own foreign resources to maintain there investment goals, thus showing a high foreign input. But as profits again became a reality, realized profits became, again, a major source of investment, meaning a need for less foreign money.
Ed
“Is it possible that much of the effect shown by your graphs is actually a measure of the effect of reinvested profits into the US by the holders of FDI. ”
Can we be clear what you are referring to? If you are saying a lot of past earnings that were sourced abroad have been “repatriated” in the form of dividends to shareholders but not invested in new capital, that is a yuuge part of what is going on. Of course the Republicans told us that these funds would be invested in new capital. They lied about the 2005 repatriation holiday. They lied about this tax break too.
Ed’s statement here makes little sense:
“as profits again became a reality, realized profits became, again, a major source of investment, meaning a need for less foreign money.”
I’ve been trying to put a logical context around this bizarre statement and here is the best I could do to unpack Ed’s gibberish. The argument we got last year for the tax cut was that it would lead to both more foreign direct investment (it failed there) and more domestic investment. I guess Ed does not know but higher profits does not equate to more investment. But maybe here is one channel. The tax cuts for the rich will be eventually offset by tax increases for the rest of us and as rich people who live mainly off of after-tax profits have more of the pie, they will consume more. That would lower national savings and investment but of course wage earners will have less so they will consume less. Plus the Republicans are tilting the playing field in favor of profits and against wages in a lot of other ways too.
But wait – the rich consume more and the rest of us consume less. Oh wait – there are some who think the marginal propensity to consume for rich people is less than the marginal propensity to consume for the rest of us. Now this way more profits would equate to more investment.
Is that Ed’s theory? Who knows. He has not articulated a coherent economic explanation for his usual babble.
Menzie’s graph is no doubt better as it accounts for other variables (such as GDP and the broad stock market) that this graph does not. However I still thought it was kinda fun, and a place where readers could keep track of it semi-regular. Although I say “semi-regular”, I guess that FDI data only comes out once a year?? You can play with the years on the graph using the slider under the graph. It has dropped dramatically and really looks QUITE strange, as Menzie says with the GDP quoted numbers so high (maybe “high” is my contextualization of BEA’s GDP quote and not Menzie’s) and the market generally up. Imagine if the equities market takes a dramatic drop—>>then what does that FDI graph look like a year from now?? I venture to say it would look horrid if equities take a tumble. And stocks can hit EVERYTHING, because people look at their 401k etc, and really pull back on consumption habits. Then you got retailers shitting their pants Christmas 2019. Well I guess everybody gets the idea.
https://data.worldbank.org/indicator/BX.KLT.DINV.CD.WD?end=2017&locations=US&start=2008&view=chart
Moses,
I looked at your linked chart and plotted a trend line since 1998 (20 years) and 2017 is pretty much “normal”. There were three “blips”… 1999-2000, 2006-2008, and 2015-2016. There is not much direct relationship between FDI and annual change in S&P500 for those periods. https://www.macrotrends.net/2526/sp-500-historical-annual-returns (Menzie’s earlier assertion).
This seems to be one of those situations that relate nicely to this: http://www.anvari.org/fortune/Quotations_-_Random/468_quote-48-for-every-complex-question-there-is-a-simple-answer-and-its-wrong.html
Bruce Hall: Eurostoxx 50 up in 2017 vs. 2015/16; UK stock market, Japan stock market all up in 2017 vs. 2015/16. Given results in Baker, Foley and Wurgler (Review of Financial Studies, 2009), ungated version, and experience during the 2000’s (when there was an FDI inflow boom as European stock markets contemporaneously boomed with US), we should’ve seen a big inflow in 2017. We didn’t. So my advice to you: (1) look at longer samples (2) refer to academic literature (3) drop your ideological blinders. I doubt this will convince you, so I’ll run some regressions when I have time, to show you.
Menzie, my response was to the data at the link supplied by Moses. I compared the last three spikes in FDI with the S&P500 returns and found a generally inverse relationship. There may well be an overall positive correlation between markets and FDI, but it doesn’t seem to hold for the spikes which seem to be anomalies. So, if 2015-16 spike was an anomaly, perhaps a better comparison would be 2014 to 2017 which shows an increase.
If shown the S&P500 annual returns (re: Moses) versus the FDI for the 20 years 1998-2017 here: https://www.dropbox.com/s/sgh79eog8chs8ut/FDI%20versus%20Stock%20Market.pdf?dl=0
I’d be interested to hear read your explanation for the three spikes in FDI which pop from a long term trend line (not linear; use Moses’ link for 1970-2017). A regression analysis is not an explanation.
Menzie, in case there I any confusion about what I meant with the term “spikes”: https://www.dropbox.com/s/e1q2fw3826ofyam/Foreign%20Direct%20Investment.pdf?dl=0
THANKS for the Wurgler paper on FDI flows Menzie, you know the research papers is like 25% why I read this blog and enjoy it so much. I don’t pretend to always grasp all of it/them, but I do feel it progresses my knowledge and learning.
The flow data for FDI by nation can be found here:
https://www.bea.gov/international/di1fdibal
If one checks, this figure is way down overall from 2016 to 2017. It is also down when we look at some of our major trading partners including Canada or Europe. It is even lower when one looks at flow data from Germany.
PeakLiar is trying to tell us it is up on a worldwide basis and he is trying to claim that Germany is one example. I get he is too stupid to cite real world data so he just takes the lies from Fox and Friends as gospel.
Off Topic but just a reminder to check the CBOT price for Nov 2018 soybeans. Looks like my guess from last summer of $8.95/bushel will slightly overshoot the final November price. What price was Farmer CoRev predicting???
I think it was the same price Kudlow predicted for oil after the invasion of Iraq. Oh wait – Kudlow told us oil would be $12 per barrel of oil whereas CoRev was forecasting $12 per bushel for soybeans. Of course CoRev will counter with some lecture to us that a barrel is not a bushel. DUH!
October illegal immigration numbers:
Apprehensions at the US southwest border for October came in at 50,975, up 23% over the previous month and a whopping 19,400 (+38%) over our mid-year projection.
We had stated in our earlier reports that illegal immigration could go a lot higher, to 45,000-65,000 per month, and at 51,000, the October data falls right into that range. October apprehensions reached the highest level since 2007, which is significant because it suggests a return to pre-recession levels, which were much, much higher than recent numbers.
Our November forecast for southwest border apprehensions for full year 2018 now stands at 465,000, an 85% gain over the 251,000 booked in 2017. In October 2017, we forecast apprehensions to double in 2018, and we were not far off.
Our initial forecast for 2019 sees border apprehensions rising another 30% to just over 600,000 next year.
https://www.princetonpolicy.com/ppa-blog/2018/11/14/october-illegal-immigration-soaring-but-not-nielsens-fault
And this relates to FDI? Hey Steve – I’m still not reading your blog. Thanks for the reminder that i made a good decision!
If our forecast holds, illegal immigration will be higher next year than during any year of the Obama administration. I thought some readers (obviously not you) would find that interesting.
Further, illegal immigration has just taken off since July. What happened then? Remittances to Mexico in real terms regained their 2007 peak (eleven years later — now that’s a depression, not a recession!). Thus, we have a linkage between economic cycles — one which did not end in Q2 2009, but for migrants, in Q2 2018 — and border security and the undocumented population, which has probably continued to fall, at least for Mexicans, into the first half of 2018.
It’s not all soybeans. There’s other stuff happening as well.
just curious steven, what justification are you using for your predictions? is it based on a model, or intuition? also, you need to be sure your measure of apprehensions is accounting for the fact that trump is extremely focused on increasing that number. if you try to correlate apprehensions to actual numbers of immigrants entering the country, that relationship probably breaks down in the past couple of years.
Baffs –
The 2018 predictions:
The data strongly suggests that migrants crossed the border in advance of Trump being elected, and then deferred once he took office. My first forecast was around April, I think, and you could see that crossings were bottoming there — so I straight-lined those (seasonally adjusted) back to ‘normal’ levels, adding back net deferrals and assuming some growth for a robust US economy. This latter assumption failed until July, but boy, have things taken off since then. In any event, my forecast was a little heavy for 2018 — I forecast a doubling and the actual is likely up only 85% — but considering that I’m the only one making such a forecast — I’ll bank it as a win. It was directionally correct.
The 2019 forecast was geared around assumption that the Great Recession (the China Depression) ending only in summer 2018 for migrants. We can see this through remittances and also through population estimates, in part through some back and forth with Pew. This suggests that migrants wages remained below the Relocation Wage really from 2008 until 2018. Thus, there was really no great incentive to come across the border until a few months ago. With the GR (CR) now over, I reckoned that remittances suggested that the realized wage was above the Relocation Wage and that this would bring in migrants roughly at the pace seen in the 2005-2008 period, which amounts to around 600,000 per year. Supporting this was the October data which came in at 51,000, that is, a bit higher than the 50,000 I was otherwise thinking. So figure around 600,000 and then allocate that seasonally.
That’s the methodology: A lot of triangulation leaning pretty heavily on very recent data and some assumed underlying logic. That’s why I called it an ‘initial forecast’ for 2019. It’s a hair better than ‘speculative’, but you might not want to put your whole reputation behind it. At the same time, assuming the economy holds together, I think it reasonably likely that 2019 will see the highest illegal immigration since before Obama took office.