Laurent Ferrara asks what’s the probability of a US recession in 12 months if one augments an utterly standard 10yr-3mo term structure model with US economic policy uncertainty (EPU) as measured by Baker, Bloom and Davis…
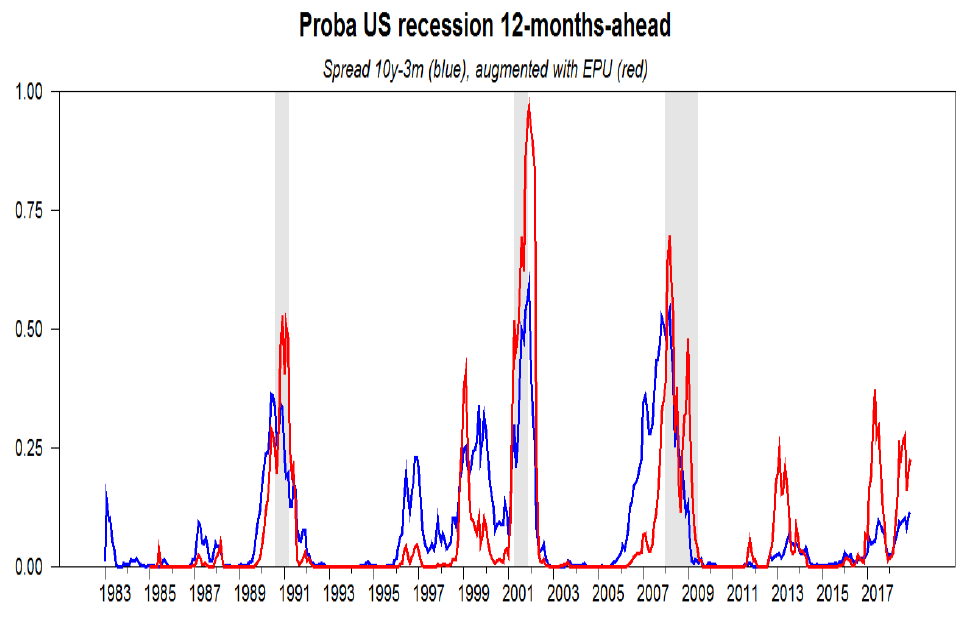
The answer is kinda scary. False positives more likely, but currently higher probability of recession than implied by standard term spread (10yr-3mo) model.
I keep going back to Lael Brainard’s comments on this (as Menzie did I think a full year before me, although I was not “piggybacking” or coat-tailing Menzie on this specific item believe it or not). I’ve jumped on board many of Menzie’s thought trains proudly on many things, but this one I had on my own reading Brainard’s comments in Bloomberg, essentially jumping on board her thought train. I think it makes the narrowing of the gap between the two rates (and even a “mild” inversion) less bothersome. Is it still a concern?? Yes, obviously it still is. But I don’t think it’s quite the alarm bell that it would normally be. That’s coming from someone who at least on some levels is hoping for a recession right now, because if it accelerates Orange Excrement’s exit from the White House, I’m all for it.
It would be other more “common sense” or more surface observations that bother me— masochistic trade policy, government shutdown, and the percentage of unemployed workers not accounted for in the official rate as measured by BLS.
Truly truly….. frightening times…..
https://www.youtube.com/watch?v=yv0friRfSaM
Menzie,
Can you please host a direct link to the note or paper with this analysis by Laurent Ferrara. I failed to find it online…
Thanks,
Pawel
It was in an email I think Menzie is basically saying, although the data is probably findable. I just got up from a nap, and have an errand I need to run. I may see if I can snag it later for you. But he got it in an email I think.
@ Pawel
Maybe you already know this, but here is the EPU data:
http://www.policyuncertainty.com
And the 10y-3m spread is publicly available many places, then you basically overlay the data. Maybe there is some other math there to make the data, I’m not certain the right terminology but “relatable” to each other numbers wise?? Because you have your left and right margin scales that are based on different units. Maybe the stats software does that like “R” or something. Anyways…..
I’m extremely sad to say @2slugbaits can probably explain that much better than I just did.
Thanks! I know the data sources, just thought that this chart was from some research note or something. I asked the author on twitter and it was just a one-off estimation based on M. Chinn idea. Thanks anyway for your help!
Does not appear to be particularly useful. Either it coincides too closely to the actual recession itself or the augmented model forecasts lag the basic model forecasts.
The question is: are the forecasts of value to those seeking to bet serious resources or just those betting match sticks and ice cream cones?
I would expect EPU by itself to forecast/coincide with slower growth including recessions. Then again is it slower growth per se or slower growth relative to previously expected growth? That raises what are likely difficult intractable measurement challenges.
Looks like we have a recession every 8 – 10 years. So regardless of red and blue and a bunch of false positives, we are due.
@ Bob Flood
It’s hard to argue with the accuracy of your statement, or say that it isn’t factual. But at the same time, I really hate those kind of statements. It reminds me of the arguments for “the natural rate of unemployment” that really kinda gripes my ass. If we take this line of thought, it makes us accept that things are “just as they are” that “it is what it is”, when we should be asking “How do we change that cycle before it reoccurs??” Equity ratio monitoring and requirements at banks, the Federal Reserve performing its regulatory functions in a punitive way, CEOs being punished for bad behavior and getting significant prison time. The SEC and CFTC getting more resources and manpower to perform its functions. More and higher reporting mandates for derivatives clearing houses. The eliminations of ARMs mortgages at banks (which rarely rarely work out for the loan consumer).
We shrug our shoulders because the TBTF banks and “the important people” get bailed out after they step on the neck of the little guy laying on the ground. No one cares about the thousands of people who lost their jobs, lost their home etc due to the larger players paying Russian roulette with savings and checking deposits. When the mortgage cramdowns were postulated, we had the false pretext of “contract law”. Nobody gave a flying crap about “contract law” when taking someone’s home away ILLEGALLY on robo-signing on residential house mortgages—no Republicans cared about that. Nobody gave a crap about “contract law” when Wells Fargo was creating fictional accounts to generate customer fees and service charges for doing nothing. This shit of the little guy getting deep fried every 8–15 years and we all just go “it is what it is” is getting really old.
I do not know what the significance of this is, and I have seen only scattered commentary on it, not to mention that it looks like it may be about to disappear, but we have had for some time a weird non-monotonicity of the US Treasury yield curve that has risen then fallen then risen again, with these twists and turns happeneing between the three month and ten year time horizons, so their difference has not captured it. I show below some yields for both 1/15 and 1/18
3 mo. 1yr 2 yr 3 yr 5 yr 10 yr
1/15/19 2.45 2.57 2.53 2.51 2.53 2.70
1/18/19 2.41 2.60 2.62 2.60 2.62 2.79.
Curiously, when we have seen negative nominal rates, we have also seen such non-monotonicities, which I have commented on here previously, although in those times it was around the 2 year time horizon where one saw the lowest rates, so the curve falling from 3 mo. to 2 yrs. and then rising. This is more like the opposite of that roughly. I have seen no clear explanation of either pattern, and I certainly do not know what this recent one portends, although, again, it may be about to disappear with the yield curve returning more or less to normal, if still somewhat flatter than usual..
I performed the estimation myself. It looks like a quite a nice tool to track the odds of a recession. Tweet about it here: https://twitter.com/p_skrzypczynski/status/1087706187729117184?s=21
Pavel Skrzypczynski: Think one needs to check receiver operating characteristic for this predictor, before going further.
I just emailed you my findings on the ROC for this model. Hope you find it intersting.