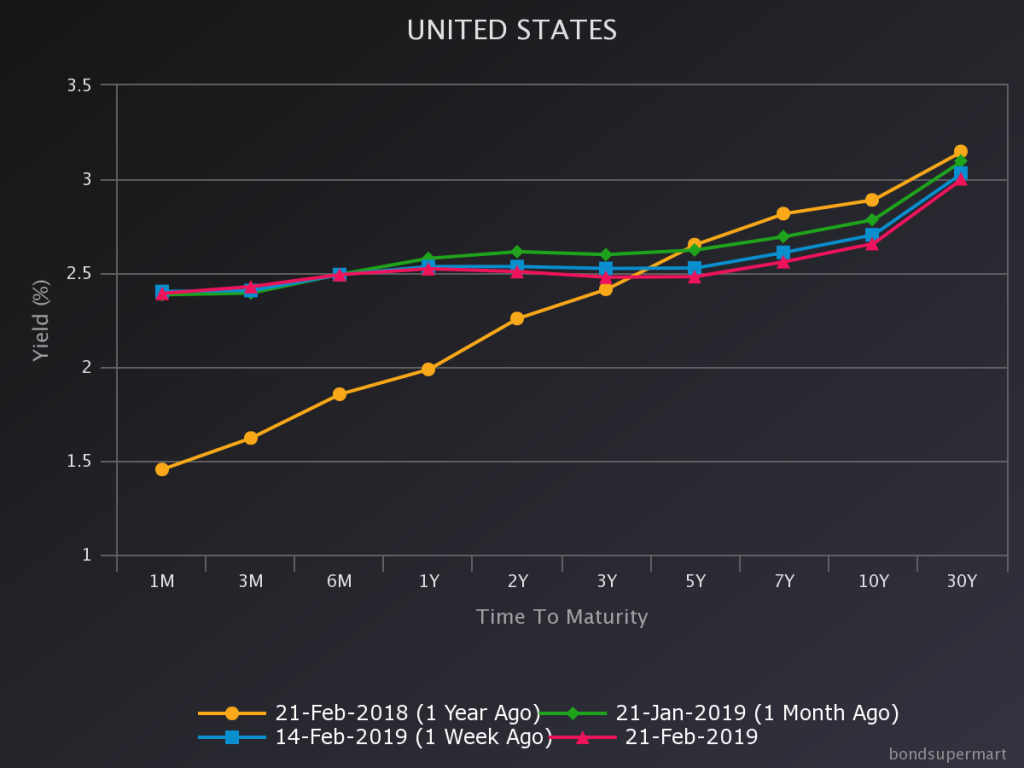
Part of the yield curve is already inverted.
Notice that inversion occurs at the 2-3 year maturities; the key 10yr-3mo spread continues to decline, while the 10yr-2yr spread has stalled.
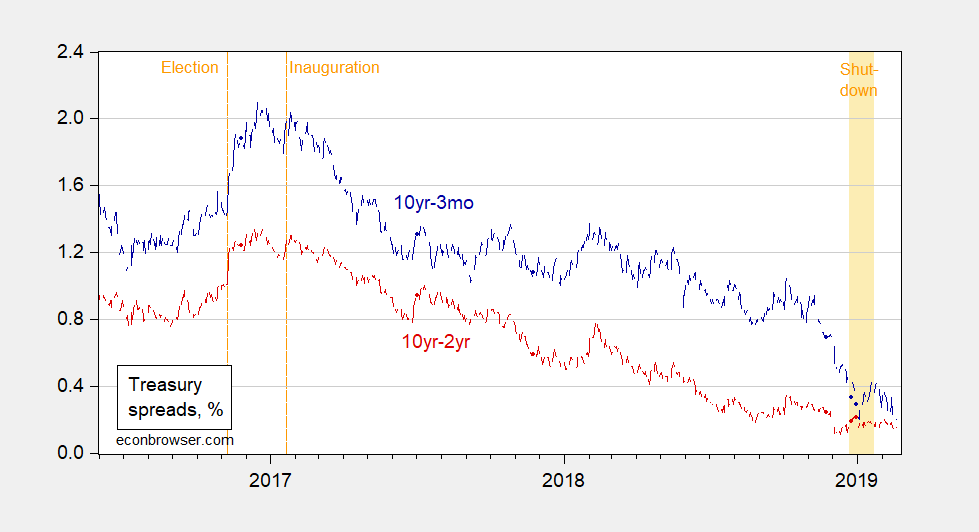
The inversion at the 2-3 year maturities suggests lower short rates in the near future.
For whatever it’s worth I am still in Brainard’s camp on the narrowing of the spread or the inversion not being as concerning as it used to be. It is other market barometers and policies that worry me. In other words I still think we are in store for bad times, but if it was just the inversion in isolation, that inversion wouldn’t really bother me as much as in other past times. That being said, I thought this was an interesting post over on ZH:
https://www.zerohedge.com/news/2019-02-20/yesterdays-perfect-recession-warnings-may-be-failing-you
but i don’t think you really ever get an inversion in isolation? long rates don’t simply drop on their own. something should be driving them down. or have we had instances of a drop without correlation with other economic events? as you indicate, it is really an AND not an OR condition, we just have to know what conditions besides the inversion are important.
@ baffling
I don’t think we are really disagreeing here. But you could hypothetically have a small spread or an actual inversion, where other factors are less severe or less omnipresent. We’re kind of splitting hairs here. But in essence what I am trying to say is, the inversion in the current climate wouldn’t necessarily be an alarm bell for me on a for certain recession. Mainly I guess,because we are near to the “ZLB”, to say it in away I don’t have to spend 40 minutes on a blog comment to say it more clearly. That’s my subjective opinion.
I may not be expressing myself very well, but I like to think Menzie is kinda getting what I am saying. Miss Brainard or Menzie could no doubt say it much more intelligently than me. That is they could say what I am trying to say, even though Menzie may not necessarily agree with me on that.
@ baffling
It’s pages 9–11 that you wanna pay attention to, ok?? That is basically what I am trying to say and not doing a good job of it.
https://www.federalreserve.gov/newsevents/speech/files/brainard20180912a.pdf
thanks for the link. it seems the reliability of the inversion argument is rather sensitive to the magnitude of the long term rates to begin with. as you say, when the magnitude is small, then it is easier to get an inversion that may not indicate what a typical inversion with 6% long term rates would imply. reading the braindard comments, she seems to indicate the “term premium” is what disappears, along most longer terms, during these low rate cycles. i was going to comment on this a few days ago, but wasn’t quite sure how to frame it in economics terms. but as an investor, the lack of a term premium makes complete sense to me. with long term rates as low as they are (under 3%), it is really hard to commit any money to a duration longer than 5 years. my guess is outside of some institutional investors (pensions) and sovereign wealth funds, there are few “investors” putting any money into long term bonds at the current rate. There is probably a great big disconnect between what it would take an investor to buy in, and what the government is willing to yield on the long term bonds. Outside of the institutions and sovereign funds, volume is probably very low with no demand. most investors believe they will have more options available to them above 3% in 5 years time, so a 30 year bond is a losing proposition both on current yield as well as drop in value as rates rise in the future, as assumed. there seems to be a lower bound in long term rates, below which we get a failure to lift using traditional monetary and fiscal policy. long term rates probably cannot gradually climb out of their hole, but will need a discontinuous jump in order to finally attract investor dollars-at much higher yields than we currently see. inversions along with low long term rates may not be too reliable after all. i think those that are calling the bond market a huge bubble are viewing it this way-there is a large rise in yields necessary in order to make bonds look attractive again. and few investors want to buy until we see those large rises occur. ironically it may take the pain of the fed driving up short term rates to eventually push long term rates up to an attractive level-but how do we avoid a recession in the process?
This reminds me of what we saw in early 2006 so I started thinking about Greenspan’s bond conundrum and found this:
A New Conundrum in the Bond Market? by Michael D. Bauer:
https://www.frbsf.org/economic-research/files/el2017-34.pdf
“When the Federal Reserve raises short-term interest rates, the rates on longer-term Treasuries are generally expected to rise. However, even though the Fed has raised short-term interest rates three times since December 2016 and started reducing its asset holdings, Treasury yields have dropped instead. This decoupling of short-term and long-term rates is reminiscent of the “Greenspan conundrum” of 2004–05. This time, however, evidence suggests compelling explanations—a lower “normal” interest rate, the risk of persistently low inflation, and fiscal and geopolitical uncertainty—may account for the yield curve flattening.
Between June 2004 and December 2005, the Federal Open Market Committee (FOMC) substantially tightened monetary policy by increasing the federal funds rate from 1% to 4.25%. Over this same period, long-term Treasury yields, which typically move in the same direction as short-term rates, did not follow suit and instead declined. This behavior of Treasury yields puzzled most observers, including the Fed Chair Alan Greenspan, who famously termed it a “conundrum.” Recently, the FOMC has been raising the federal funds rate target, though less frequently and starting from a lower level compared with the 2004–05 period. Since December 2016, the target range has been adjusted three times by a total of 0.75%. In addition, the FOMC began reducing the sizable holdings of Treasury and mortgage-backed securities (MBS) that the Fed had accumulated through its large-scale asset purchase programs between 2009 and 2014.
During such an episode of ongoing monetary policy tightening, long-term Treasury yields would usually be expected to rise. Since December 2016, however, they have not only not risen, but instead have fallen quite noticeably, to the surprise of professional forecasters. As a result, the yield curve has flattened over this period, as shown in Figure 1. Just like in 2004–05, shortterm and long-term yields appear to have decoupled. Is there a new conundrum in the bond market? Or are there plausible explanations for this seemingly puzzling behavior of the yield curve?”
JMO, but it’s all about using credit to invest.
If the cost of money today (current 3-month T-bill rate) is lower than the expected long-run return (10-year Treasury yield), there is incentive for investors to borrow and incentive for banks to lend. The economic expansion is funded this way, it’s normal.
At an inversion, however, there is no incentive to borrow or lend, clearly a hostile credit/economic condition, and recession ensues.
As I say, JMO.
DEEP. Can you offer us a textbook and some supplemental materials for this?? The social sciences community hasn’t been this rocked since Barkley Junior stated that data shown to be uniformly distributed is actually a “skewed” distribution. We await your updates on this revolutionary idea.
About a month ago I posted on this on Econospeak at econospeak.BlogSpot.com/2019/01/weirdly-nonmonotonic-yield-curves.html or https://econospeak.bogspot.com/2019/01/weirdly-nonmonotonic-yield-curves.html or throw in a www. As it is, I and pgl also have posted and commented on this in the past several times. Frankly, I think there is a paper here, although I have been unable write it.
So the oddity is that the non-monotonicity occurs in the mid-range of the curve, currently apparently in the one year to five year zone is where the yield curve dcelines, otherwise rising. I am mystified by this and wonder if Menzie has an idea or knows of any actual literature on this. Maybe we can write that paper.
Let me note that previous and some current examples of this have tended to be in nations with negative nominal interest rates. In older posts I have made on this I noted that often the absolute minimum interest rate often seemed to be at about the two year or sometimes three year time horizon. Note that in these cases that minimum was (or is) below the rate at the very shortest time horizon, the one usually targeted by the relevant central bank. I suppose an explanation, not all that academic, is that in those cases there is sever downward market pressure on interest rates that is stronger than the central bank pressure on the overall yield curve, but central banks usually can control those super short term rates so one sees that rate above some of a slightly longer time horizon, and in the longer tern the usual risk of inflation-etc stuff kicks in and we see rates higher again. Why that minimum would or does seem to hit atound 2=3 years remains at least to me a mystery.
As it is, this is a different situation. It is not one of negative nominal rates, some distance from that. This inversion section seems to include that 2-3 year xone, but at least now is stretching out a bit further, while not being al that dramatic. I am even more mystified by this particular phenomenon. I await any sort of semi-reasonable interpretation.
Sorry about the darned link. https://econospeak.blogspot.com/2019/01/weirdly-nonmonotonic-yield-curves.html . Again, while I have seen nobody making the argument I did that possibly explains h ow in a world of negstive nominal interest rates one might see rates initially dcline from the shortest time horizons to something like 2-3 years and then turn around and rise, I really have no obvious explanation for these weirder yield curves that rise, decline, and then rise again.
Anybody? Really.
Barkley Rosser: This Reuters article speculates.
If I were a purist about the expectations hypothesis of the term structure (EHTS), I would say it means that market expects Fed funds/3 mo T-bills at the horizon of 1-2 years from now to be *extremely* low, i.e., reacting to a recession, and normalizing soon thereafter. (In other words, I think the market expects we will be in a recession in 2020.)
Hmmm, Menzie. That is quite reasonable. I am not sure it is actually what is going on, but thanks.
@ Barkley Junior
It’s not a “skewed” distribution, so you can cross that off the list of possibilities. Just thought I would save you some time there Junior.
“Still, in December 2005, for instance, a comparable inversion at the front of the curve was followed shortly afterward by an inversion between 2- and 10-year yields. The Great Recession began in December 2007. That pattern was also evident in late 1988 in advance of the 1990 recession. Ahead of the 2001 recession, the entire curve dropped into inversion in sync in February 2000.”
A 2- year lead? I’m still trying to figure out the economic logic of all of this?
EDZ9 now at 2.63%
EDZ0 now at 2.45%
(adjusted rates)
So there is a bit of an ease priced into the euro$ market. There has been for some time, in fact.
So, yeah, the curve is also pricing in a Fed ease, because arbitrage.
From our “good friends” over at ZH. I still think aside from the political agenda ZH does have some informative posts. At least while Bloomberg chases off readers with paywalls:
https://www.zerohedge.com/news/2019-02-25/intraday-inversion-5y-treasury-prices-lower-yield-2y-auction-hours-earlier
Here’s another “goody” from the ZH candy store.
And I rip-off a portion here verbatim:
“……the internals showed a continuation of the troubling trend where foreigners continue to shirk away from purchasing US paper at auction, which should the trend accelerate could pose a problem to the US Treasury which hopes to issue a net $1.1 trillion in new paper this year to fund a fiscal program whose tail wind benefit to the US economy has now come and gone.”
Can anyone tell Uncle Moses what time stamp the tailwind came and went??—-‘cuz I missed the whole damned thing.
https://www.zerohedge.com/news/2019-02-25/foreign-buyers-tumble-2y-treasury-auction