I have no idea if they’re a particularly good predictor of recessions, but January sales have fallen 40% relative to a year previous…
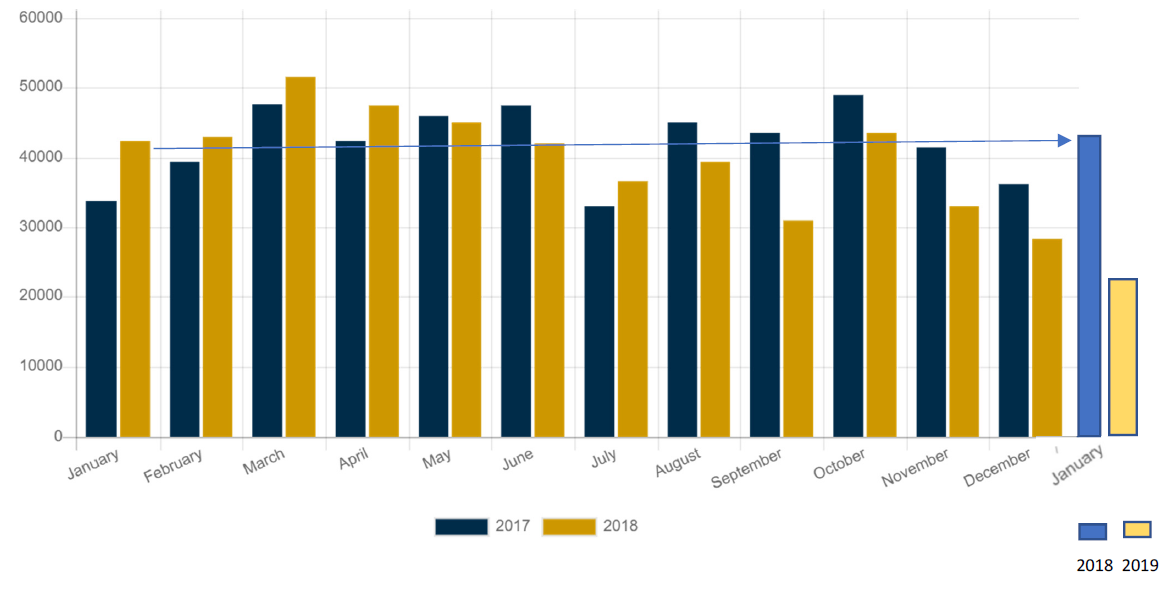
Figure 1: Total recreational vehicle shipments for 2017 (dark blue) and 2018 (brown), and 2018 (light blue) vs 2019 (tan). Source: RVIA, and author’s calculations.
A longer time series suggests a slowdown at a minimum.
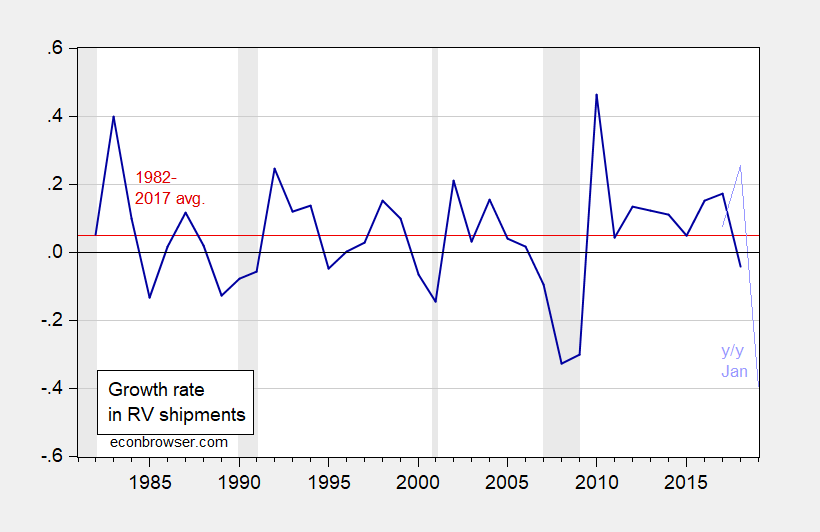
Figure 2: Year on year growth in total recreational vehicle shipments (dark blue), 1982-2017 average (red line), and January 12 month growth (light blue). NBER defined recession dates shaded gray. Source: RVIA, and author’s calculations.
Using the methodology outlined in this post, one can estimate the probability of a recession in 2019: 16%. Using data updated to end-2018 (rather than October 2018), the probability of recession is now higher by 5 percentage points.
The 16% probability is less than the 20% probability the model implies for 2001, and the same as the probability estimated for 1996 (a year that NBER did not declare a recession).
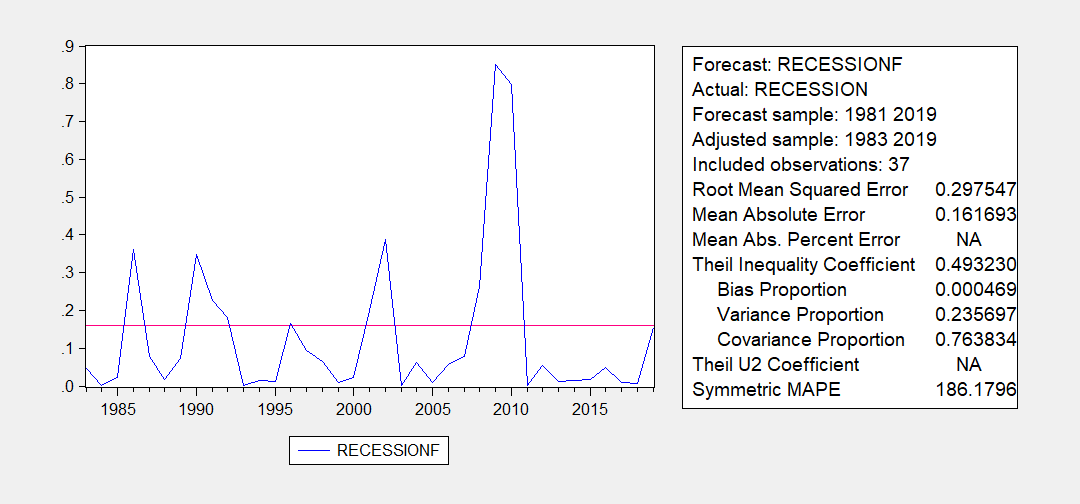
Figure 3: Recession probability from probit using lagged rv shipments growth rate. Red line at 16%. Source: Author’s calculations.
I don’t know if those are reliable indicator, whether leading or lagging. RV sales certainly are the kind of thing that would drop when nobody has any money to spend. Some of the things I think about aren’t based upon statistical analysis, but are based upon decades of observations.
1. Credit card applications. When you are buried in junk mail from everyone and his brother who want to loan you money, the end of a recovery is approaching. That’s been going on for about a year now, although it’s begun to abate a little.
2. Offers to buy the house start to taper off. That means the market is cooling and we are going to see a downturn in construction and real estate.
3. Building permit applications. It hasn’t happened like 2006, but it’s slowing. Permit applications tapered then and the fell off the edge of the earth.
None of these things are any more or less likely to be indicators of a coming recession than RV Sales, but they all make sense and are worth noting, at least to an untrained outhouse economist like I am.
When I tried to get these rail numbers up on FRED, I can get the page (and the actual light blue background of the graph) but it won’t show the graph line itself. I’ve had this problem before with FRED and I can’t figure out what the deal is. But maybe FRED gets the numbers from BTS anyway??—similar to how FRED gets some numbers from BLS?? If anyone has theories why I can get the site to upload but can’t get the graph lines, please advise me. I think it must be on my end—like with that Deutsch research site that was put up here some months back
Anyways. I do think these RV numbers are interesting (I suspect one of my Dad’s unfulfilled dreams was to travel around in an RV in his golden years, so because of my Dad, I find the topic fascinating). And I’m glad Menzie puts them up and I hope Menzie continues to do that if he finds them relevant ( I think they are relevant to a degree and worthy). That being said…. I put more weight on rail traffic. (using the 5 year numbers is the best time horizon gauge in my subjective opinion)
https://www.transtats.bts.gov/osea/seasonaladjustment/?PageVar=RAIL_FRT_CARLOADS
I also put some weight in (what I used to ignorantly/dumbly call “gypsum board”, I must have drank some of “Princeton”Kopits protein powder malt the day I absorbed that lexicon) corrugated paper board. Now, to me, this is confusing because it seems (to my eyes) to tell a different story than the rail traffic tells.
https://fred.stlouisfed.org/series/PCU32221132221102
I look at the 5 year numbers on both of these indicators, because 5 years is recent enough to be relevant to who the President/Congress is in the “current context” and yet long enough to pick up legitimate patterns in the data.
If Menzie has any thoughts on the possible fallacies of these two indicators, or if anyone else does (and I’m being genuine/non-sarcastic here) I would love to hear them.
Rail isn’t the way a whole lot of boxes get used now. Think about how many boxes Amazon uses, and how few of those boxes go on railcars. I’m amazed at the amount of cardboard that ends up in the recycle bin after I buy anything from Amazon or anybody else. It mostly goes by truck or air.
You are largely correct, but that’s all the more reason they would be both good indicators to look at, if they mirrored each other it would ruin some of the point. Actually when I look at the corrugated paper graph near recession periods you’re not really seeing a drop off (which would have been my intuitive guess, and obviously would have been a wrong guess) but it does seem to “level off” or how to say, “hold altitude”, for lack of a better way to say it. It’s in one of those “holding patterns” in recent months. So…. hard to draw strong conclusions there.
Bill McBride puts up rail stats in graph form on occasion. You might ask him how he gets his data. DiveHike……..
I’ve been watching the sacks of rice at Costco. When they’re gone, sell everything!
https://en.m.wikipedia.org/wiki/2008_global_rice_crisis
Heh, interesting. We’re supposed to get a Costco here very soon (after some local consumers pining for years for us to get one). No joke, I will be watching that one. Just to entertain myself if nothing else.
Consistent with these RV shipment numbers, several U.S. and Canadian manufacturers have shut down in the last several months. And the seasonal lead times in the small custom-build RV manufacturing shops are not lengthening. If demand were healthy, at this time of the year those wait times should be seasonally growing. I suspect those guys are beginning to see holes in their production schedules, and may be laying employees off, or at least not hiring, but there is no way of being sure about that.
That may be further down in the RV weeds than anyone wants to go.
Hehehehe, Friend, when it comes to looking for a reliable indicator for recessions or economic downturns, there is no limit to “how far down in the weeds” traders and investors (and arguably technocrats) will go. They will not only go to the bottom of the weeds, they will dig up however many dead bodies are necessary, and no matter if it brings a resurgence of the bubonic plague, they will dig:
https://goo.gl/images/aWDgdX
My father was born before and lived through the Great Depression, and was roughly age 9 when the Dust Bowl hit the state of Iowa. You would guess correctly if you guessed that when I left any unused light switch on in our house I F’ing heard about it from my father. And if we were eating in a cafeteria, my Dad made clear we weren’t going back home until I finished the food on my plate and he made it clear I should feel utter shame for leaving two bites on my plate. People don’t forget those things when they live through them. and 2007-2008 was a damned Windsor family picnic compared to the 1930s. They will look in those weeds.
My late wife had Vacationaire as a client back in the day. It shut down after the Loma Prieta quake. Seems they rented space to the tomato packers and large cans, drums, fell down taking part of the assembly building down. Stay Away!!! The Big One Is Coming Soon!!!
This link presents annual RV shipments and the revenue they generated from 1981 to 2018. Shipments are rather volatile over time and 2017 was a boom year:
https://www.rvia.org/historical-rv-data
An update – February 2019 shipments were also weaker than the year before:
https://www.rvia.org/news-insights/rv-shipments-february-2019
Of course we were coming off an all time high in terms of revenues from RV sales.
Forbes during the end of 2017 featured this story about the RV boom:
https://www.forbes.com/sites/dalebuss/2017/12/29/rv-sales-boom-is-fueled-by-millennials-as-they-blast-past-visions-of-cousin-eddie/#3e7928d2e5e1
I’m wondering when they will follow this up with a story about the recent RV bust!
Winnebago was doing very well until last year with record sales and profits and a sky high stock price but of late its stock price has retreated:
https://finance.yahoo.com/quote/wgo
I remember the good ol’ days, when you had to hike over to the local college library and pull out the Valueline Investment Survey to find these stats (if no one had the one copy already pulled out from the reference section). We also had to climb straight up a 10 mile canyon crevice in the snow to get to elementary school, getting high on sulfur dioxide burning at the nearby landfill while climbing near a small pack of hungry puma cats…….. and manually shave our faces while dodging the puma cats, and damn it, we LIKED it!!!!
The latest news on Winnebago:
https://www.businessinsider.com/winnebago-earnings-revenue-q2-stock-price-2019-3
Sales fell but earnings beat Wall Street expectations. Even in this somewhat slumping market, this company is doing OK.
So what’s up with respect to the European RV market?
https://seekingalpha.com/article/4231914-thor-industries-volatile-interesting-case
“In September 2018, Thor Industries entered into an agreement to acquire Erwin Hymer Group (“EHG”). The combination creates the world’s largest global RV manufacturer with the number one market share in North America and Europe. The size of the RV market in Europe is more than €6bn. EHG is one of the largest manufacturers of motorhomes and caravans in Europe.”
Thor turns out to be the #1 RV manufacturer in North America with over $8 billion in sales last year. This story notes that the entire European market is slightly less than Thor’s North American sales but EHG is the largest European RV maker.
https://www.rvia.org/business-indicators