Yesterday’s employment release indicated a deceleration in nonfarm payroll (NFP) employment growth. Data from other sources suggests that the deceleration over the last year is more marked than indicated by the establishment survey.
First, consider the deceleration relative to 2017-18 (stochastic) trend, in Figure 1.
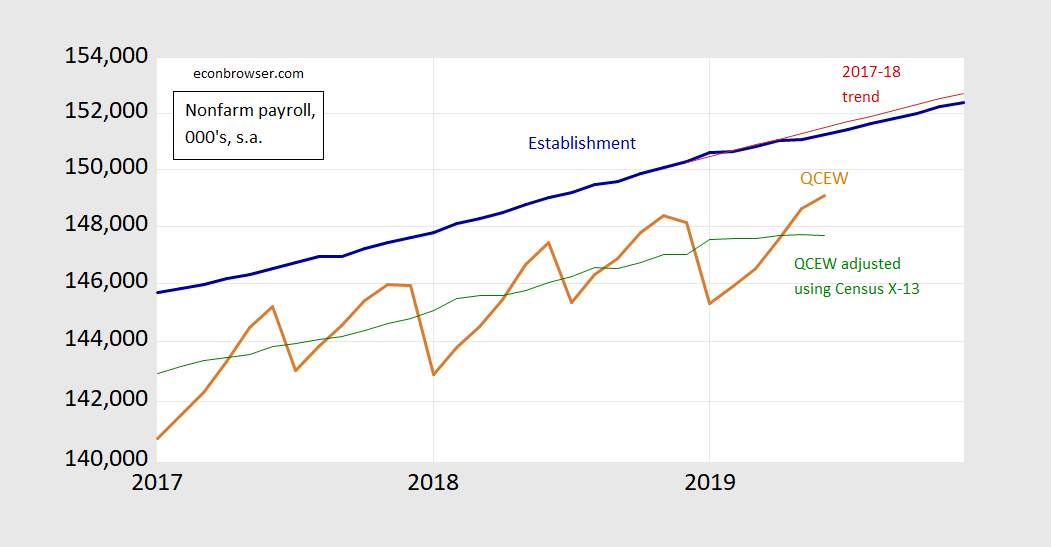
Figure 1: Nonfarm payroll employment (bold blue), stochastic trend for NFP over 2017-18 (red line), Quarterly Census of Employment and Wages (QCEW) (bold brown), and QCEW adjusted using Census X-13/log transform w/Census X-11 ARIMA (green). Source: BLS via FRED, BLS and author’s calculations. Data [xls]
Notice that total employment growth as measured by the Quarterly Census of Employment and Wages (QCEW) has decelerated, but more markedly than the establishment survey measure. This is hard to see due to the seasonality in the series. Applying the Census X-13 seasonal adjustment procedure on the log transformed QCEW series confirms the deceleration.
Given that the QCEW data will be used to benchmark revise the establishment series come February, it’s of interest to consider what these QCEW data will imply. I use a regression of the establishment series on the seasonally adjusted QCEW data 2001-2019M06 to obtain an fitted establishment series. (The fit is unsurprisingly very good, adj. R-squared at 0.999, SER at 0.0015.)
The establishment, fitted, and forecasted establishment series are shown in Figure 2. The implied establishment series deviates strongly starting in 2019M01, and the forecast (based on an ARIMA(1,1,1) continues to do so. (The ARIMA regression adj. R-squared is 0.42, SER = 0.0015.)

Figure 2: Nonfarm payroll employment (bold blue), stochastic trend for NFP over 2017-18 (red line), August 2019 preliminary benchmark revision for March 2019 NFP (dark blue square), implied NFP using Quarterly Census of Employment and Wages (QCEW) (bold green), and forecasted QCEW implied NFP using ARIMA(1,1,1) (bold brown), with 90% forecast interval (gray lines). Source: BLS via FRED, BLS and author’s calculations. Data [xls]
Interestingly, the preliminary benchmark revision released in August 2019 for March 2019 levels matches almost exactly the implied value I obtain. The preliminary benchmark is not the last word, of course. However, the negative half million revision is larger in absolute value than typical, according to Oxford Economics’ Gregory Daco.
I know some observers will note that civilian employment from the household survey indicates nearly double the growth rate of that from the establishment (2% vs. 1.1%, m/m annualized, in log terms). However, y/y, household lags at 1.25% vs. 1.39%. In addition, as Furman notes, it’s the household series is almost irrelevant for inferring high frequency movements in the labor market.
What does this imply for business cycle indicators, particularly those followed by the NBER’s Business Cycle Dating Committee? The conventional indicators are shown in Figure 3. The alternative nonfarm payroll employment indicator is shown in Figure 4.
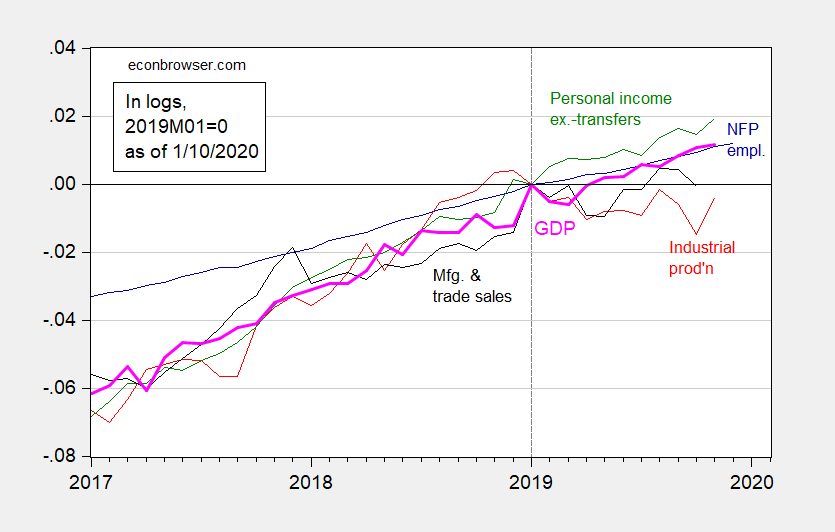
Figure 3: Nonfarm payroll employment (blue), industrial production (red), personal income excluding transfers in Ch.2012$ (green), manufacturing and trade sales in Ch.2012$ (black), and monthly GDP in Ch.2012$ (pink), all log normalized to 2019M01=0. Source: BLS, Federal Reserve, BEA, via FRED, Macroeconomic Advisers (12/30 release), and author’s calculations. Data [xls]
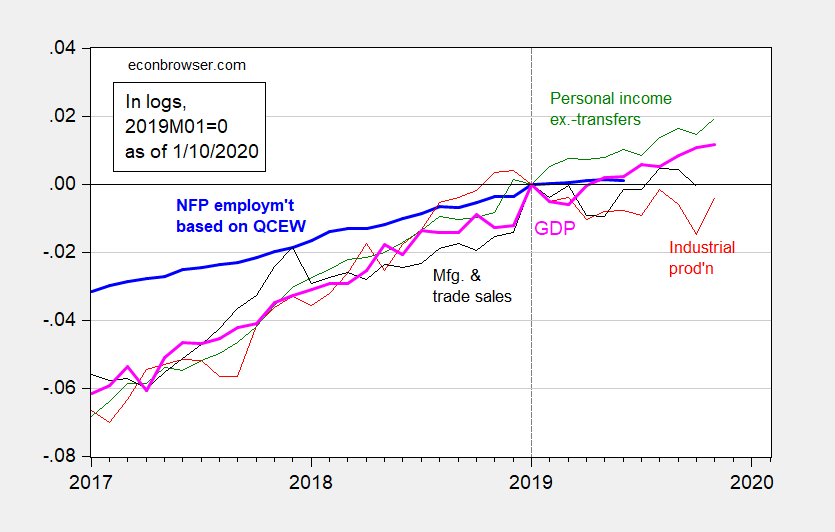
Figure 4: Nonfarm payroll employment implied by Quarterly Census of Employment and Wages (light blue), industrial production (red), personal income excluding transfers in Ch.2012$ (green), manufacturing and trade sales in Ch.2012$ (black), and monthly GDP in Ch.2012$ (pink), all log normalized to 2019M01=0. Source: BLS, Federal Reserve, BEA, via FRED, Macroeconomic Advisers (12/30 release), and author’s calculations. Data [xls]
The employment series now seems more in line with monthly GDP, industrial production and manufacturing and trade sales, at least through 2019M06. Note that even then, the 3 month change in employment so measured has not gone negative as of 2019M06, as one would expect in a recession.
All data in used in this post: Data [xls]
Update, 1/12:
Here are the establishment, preliminary benchmark, and QCEW total on a year-on-year basis.
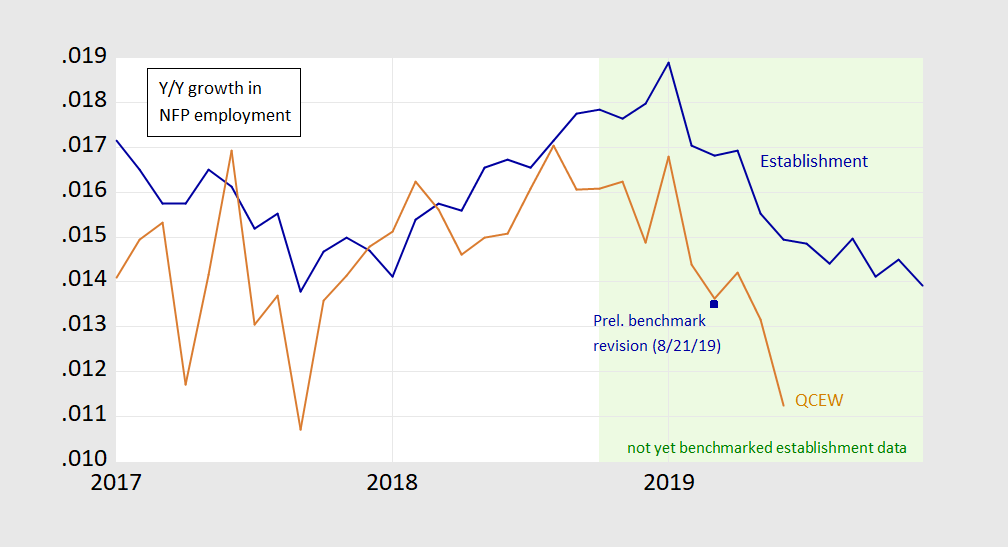
Figure 5: Year-on-year growth rate of nonfarm payroll employment from establishment survey (blue), from preliminary benchmark revision (blue square), and from Quarterly Census of Employment and Wages (brown), all calculated as twelve month log differences. Light green shading denotes period where CES data not yet benchmarked.
“I know some observers will note that civilian employment from the household survey indicates nearly double the growth rate of that from the establishment (2% vs. 1.1%, m/m annualized, in log terms). However, y/y, household lags at 1.25% vs. 1.39%. ”
The household survey shows more noise than the payroll survey on a month to month basis so it is always good to compare the two over a long period of time. And indeed over the last year, the payroll survey’s increase is indeed a bit higher than what is reported by the payroll survey. But this never stopped Lawrence Kudlow from using the number that gives his political masters want they want to hear.
One reason I look at the household survey figures is that it is these that are used to produce the vaunted unemployment rate as well as the more important employment to population ratio. The latter seems to be stuck at 61.0%.
If we want kalecki macro management
If we want a perpetual push to criticality
employment growth
We’ll need much better now casting data streams
Let’s get serious about macro
employment performance
Pretend job markets operate without a safety net
And without household savings
and without intra household redistribution
And burden sharing
Oh gee – more Paine babbling. Give it a rest dude.
Calculated Risk is thinking along these lines, too, floating the possibility of data revisions causing a month of negative non-farm payroll numbers for 2019.
https://www.calculatedriskblog.com/2020/01/the-record-job-streak-few-comments.html
2007 saw downward revisions causing a couple of negative NFP numbers.
“This graph shows the monthly change in payroll jobs, ex-Census (meaning the impact of the decennial Census temporary hires and layoffs is removed – mostly in 2010 – to show the underlying payroll changes).”
Bill McBride is properly noting that some of the recent employment increases are coming from new hires for the Census crowd. These hires are of course only temporary.
The economy is in recession. Refer to the ISM monthly figures since August 2019 and the fact the BLS will wipe away 25 % of job growth in 2018. it was no accident that the Fed cut rates 3 times in 2019 and injected untold Billions to re-start QE
If you compare the Y/Y Change in payroll and household measures of employment the household data appears to lead the payroll data.
The payroll data has troubles capturing changes at small and new firms and actually does not try. Rather it uses a model to estimate it.
But there are reasons to think the household data can pick up trend changes faster than the payroll data. In larger firms information and decisions to change employment have to move up or down through several levels of management. But smaller firms do not have those layers of management and so can move quicker in reactions to market changes.
Interestingly, on a y/y basis the household data reported weaker employment growth all through 2019.
My take is that household surveys tend to lead a bit more. If the household survey is higher, then employment growth is accelerating. If it’s lower, then it’s diminishing. There’s still a lot of noise, so that’s not a hard and fast rule.
“There’s still a lot of noise, so that’s not a hard and fast rule.”
Well said but there is one hard and fast rule. Kudlow will always cherry pick which survey gives Trump the higher increase to report.’
I don’t know if it was well said or waffiling on my part. I have learned enough about how to do real economics to say “on the other hand” a lot. I still think that we are in for a serious, noticeable slowdown in the coming months. There are signs of acceleration now, but overall, I expect the negative to outweigh the positive by enough that it will be notable. I’m not Kudlow, but I’m also non-technical in opinion forming analysis.