The Bureau of Economic Analysis announced today that seasonally adjusted U.S. real GDP grew at a 4.0% annual rate in the fourth quarter. That’s well above the 3.1% average growth that the U.S. experienced over 1947-2019, and follows a 28.8% logarithmic annual growth rate seen in Q3.
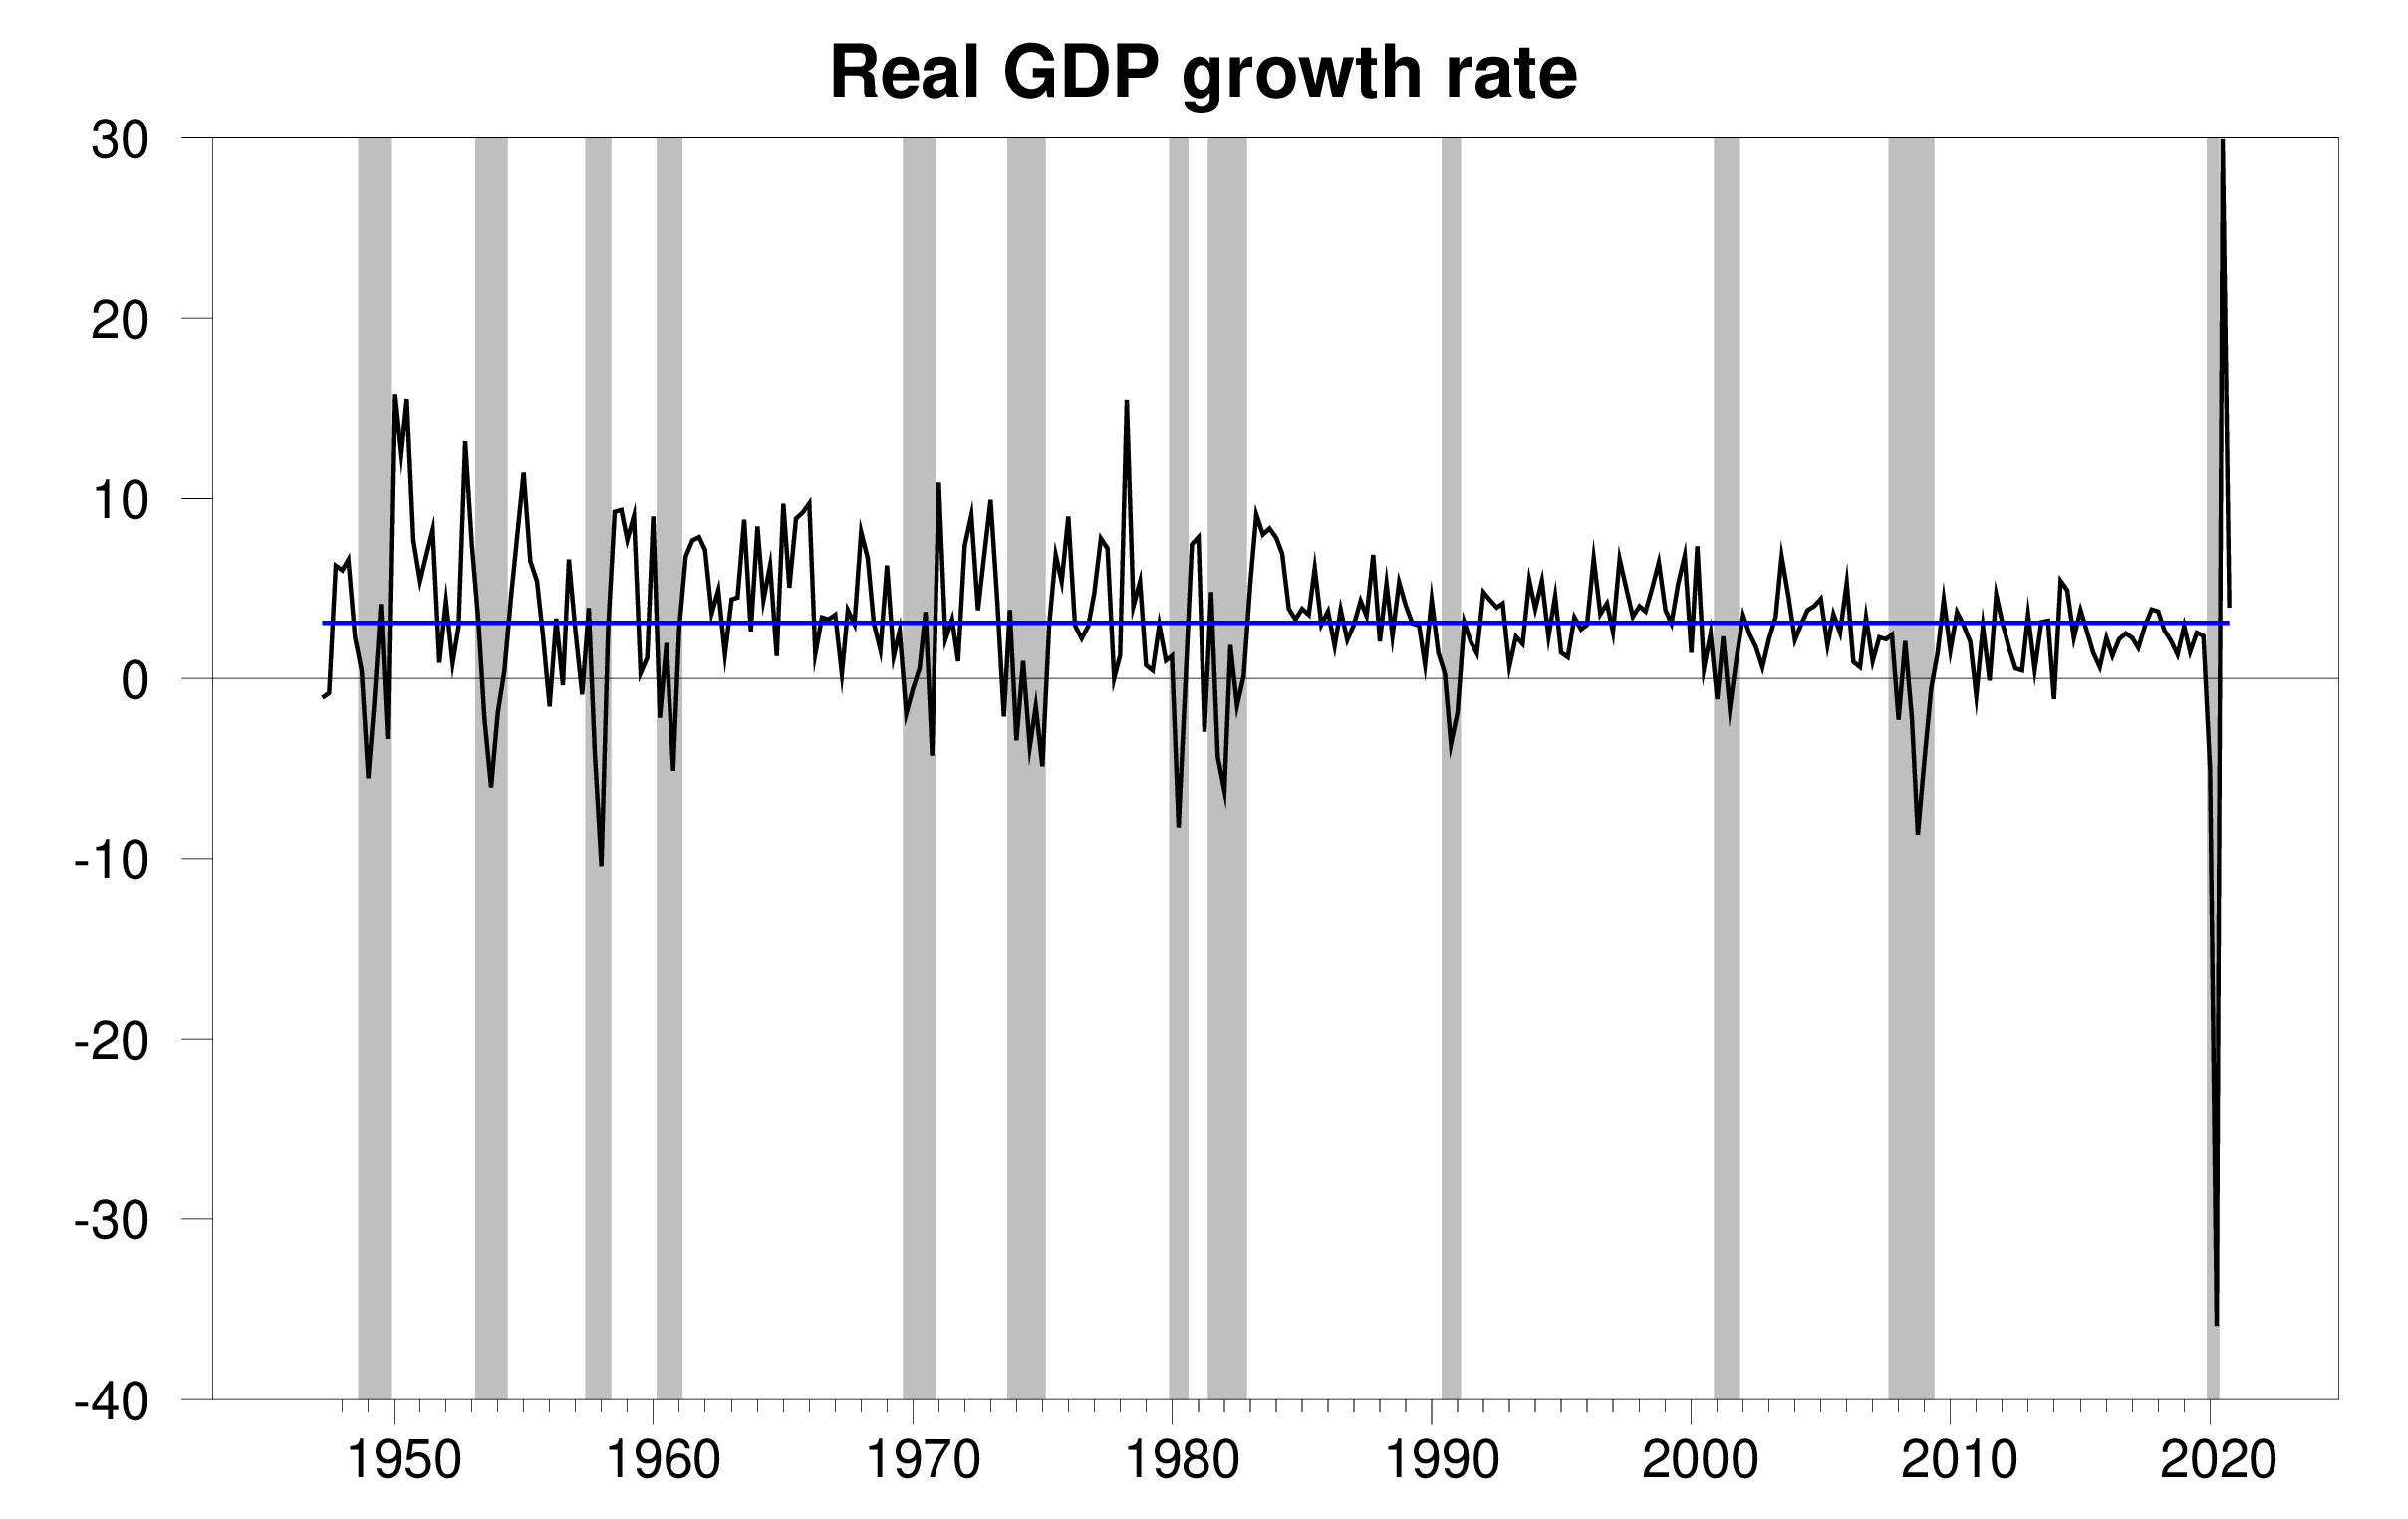
Real GDP growth at an annual rate, 1947:Q2-2020:Q4, with the 1947-2019 historical average (3.1%) in blue. Calculated as 400 times the difference in the natural log of GDP from the previous quarter.
These numbers bring the Econbrowser recession indicator index down to 0.0% for Q3. As we’ve done every quarter for the last 15 years, the number posted today (0.0%) is an assessment of the situation of the economy in the previous quarter (namely 2020:Q3). According to our algorithm, there is zero probability that the Q3 observation of +28.8% could be viewed as continuation of the recession that began at the start of 2020; the recession is unambiguously over. For this reason, in the figures I report from now on I will end the shaded region for this recession with the 2020:Q2 observation. The Business Cycle Dating Committee of the National Bureau of Economic Research has not yet made that call, though I believe they eventually will. If there is a downturn in 2021, the mechanical algorithm that we have been using for 15 years would label it as a separate recession.

GDP-based recession indicator index. The plotted value for each date is based solely on the GDP numbers that were publicly available as of one quarter after the indicated date, with 2020:Q3 the last date shown on the graph. With the exception of the the end of the 2020 recession, shaded regions represent the NBER’s dates for recessions, which dates were not used in any way in constructing the index. The indicated end to the 2020 recession comes from the algorithm described in Chauvet and Hamilton (2005).
None of this should be taken to suggest that the economy has fully recovered from events of 2020. Economists have always followed the convention that recessions end when recovery begins (as opposed to when recovery is complete). The figure below plots the level of real GDP (again in logarithmic units) rather than the growth rate. Despite the positive growth in Q3 and Q4, the level of real GDP in 2020:Q4 was still 2.5% lower than it had been in 2019:Q4. Even if we were to continue to experience the strong 4.0% annualized growth rate of 2020:Q4 for every quarter in 2021, that would only increase the level of GDP by 1% each quarter, and wouldn’t bring us back to the 2019:Q4 level until the third quarter of 2021.

100 times the natural logarithm of the level of real GDP, 1990:Q1 to 2020:Q4, normalized at 2019:Q4 = 100. A movement on the vertical axis of 1 unit corresponds to a 1% change in the level of real GDP. The value for 2020:Q4 of 97.5 indicates that real GDP in 2020:Q4 was 2.5% below the value in 2019:Q4.
The next figure shows how the various components of GDP contributed to the annualized percentage growth rate each of the last 4 quarters. New home construction accounted for about a third of the total GDP growth in Q4. Taking the year as a whole, real residential fixed investment was 5.9% higher in 2020 than it had been in 2019, despite the dramatic recession in 2020:Q1-Q2.
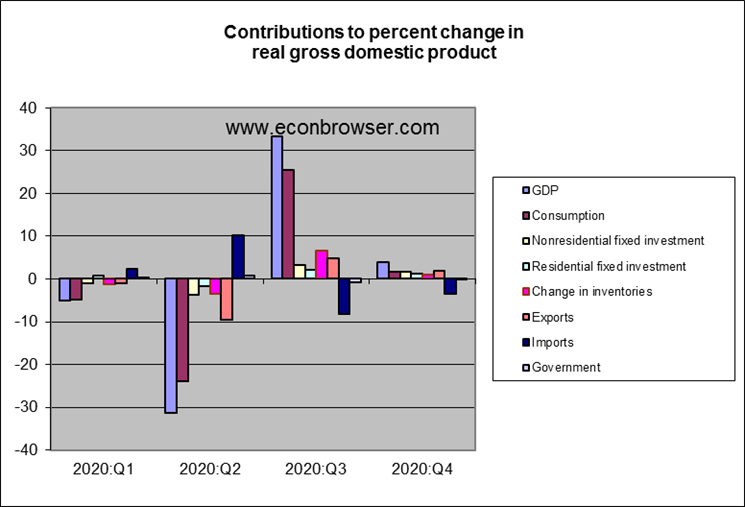
In this respect, although the recession itself was caused by unprecedented factors, the recovery at this point is looking like the recovery from other recessions, with growth in historically cyclical components like housing and autos leading the way. If these categories did no more than return to their average historical shares of GDP, that would still be a factor leading to above-average growth of GDP in 2021. And in most historical expansions, the later stages of a boom are fueled in part by above-average spending on these categories. So those gains can continue for a while yet.

Contributions to the level of GDP, 1947:Q1 to 2020:Q4. Top panel: nominal spending on motor vehicles and parts as a percentage of nominal GDP. Bottom panel: residential fixed investment as a percentage of nominal GDP. Blue lines represent historical averages. Data source: BEA Table 1.5.5.
There are thus excellent reasons to expect to see the recovery continue with above-average growth for 2021.
The recession might be over, but it has changed the relative composition between goods and services. From 2016Q1 thru 2019Q4 the consumption of goods represented an average of 21.2375% (min/max of 20.9% and 21.4%) of GDP. The services sector represented an average of 46.8% (min/max of 46.6% and 47.0%). But the 2020 numbers show a shift towards the goods sector with a mean of 22.25% (min/max of 21.1% and 23.0%). Note that the 2020 average for goods is greater than the 2016 thru 2019 maximum value. The services sector fell to an average of 45.3% (min/max of 44.8% and 46.3%). Note that the 2020 maximum value for services is lower than the 2016 thru 2019 minimum value. To no one’s surprise, there’s been a significant shift away from services and towards goods. The economy won’t be healed until people buy less physical stuff and more personal services.
“The economy won’t be healed until people buy less physical stuff and more personal services.”
Me? I need a haircut and could cut down on all that popcorn!
I need a haircut
Boy Howdy you got that right. And here I thought my hippy days were long past.
I recently got the worst haircut I can remember ever getting. My wife pointed out big holes in my hair that I cannot see. I gave the barber a big tip, too. Oh well. I kept my day job this time around.
This past year has been an oddity from my observations. It will probably look like a short sharp deep recession in time. But it has confused me.
You always strike me as a kind person with the right mindset Willie. I hope when all this is done you and your wife go out together and you get the nicest haircut you ever got in your life.
I’ve been quite happy with a Junior Soprano look for the past few years. My “stylist”—a nice young lady who indulges my requests—lengthens the cut and trims to about ten minutes max.
I bought my wife a nice present of a set regular and thinning barber scissors. She is one haircut away from getting a provisional barber’s license!
“None of this should be taken to suggest that the economy has fully recovered from events of 2020.”
I have yet to compare real GDP with CBO’s measure of real potential GDP but Kevin Drum tried his hand at measuring the output gap using trend growth putting the gap near 3.6%.
Good point about the role of real residential investment. The FED has kept long-term interest rates low and 30-year mortgage rates are incredibly low leading to a boom in housing prices.
What was the seasonally adjusted annual rate of growth as opposed to annualised rate or what you call the Year on year growth rate please.
The large output gap should see growth rates be larger than usual
“The large output gap should see growth rates be larger than usual”.
The output gap is near 3%. With potential GDP growing by 2% per year, let’s hope for a 5% growth rate for all of 2021!
Checked with FRED and CBO measure of real (2012$) potential GDP = $19330.8 billion
Real GDP = $18780.3 billion
So their measure of the output gap = 2.85%
Recession miraculously ended on January 20, 2021. Michigan and California opening up their economies as COVID-19 miraculously ends in those states. Miracles abound. The Big B has saved us!
Bruce Hall Not miracles, just restrictions. In California the Rt fell to 0.81 and the confidence interval fell below 1.00. And in Michigan the Rt fell to 0.93 and has been below 1.00 since a few days after the election. So no miracles, just policy results.
Maybe you need to SLOWLY explain to Brucie boy what Rt is. I suspect he thinks it is something to go along with his daily dose of bleach.
More like the holiday surge ended. The way both sounded happy looks bad. February is Biden’s first stats month, he needs a strong start.
Dude – Kelly Anne Conway is not writing you any more checks so you can stop embarrassing your mother.
Too Bad, there were no miracles during the Trump mal-administration which caused 400000 dead Americans, and soaring unemployment, soaring hunger, and a failed attempt at insurrection on Jan 6.
I’ll be very happy to be proved wrong on this, but I think many epidemiologists (and people familiar with logistics and distribution of things to the mass public) might view Professor Hamilton’s headline extremely naive.
https://www.nytimes.com/2021/01/28/health/covid-vaccine-novavax-south-africa.html?action=click&module=Top%20Stories&pgtype=Homepage
At this moment, I see the only savior on this, being the same savior which might have saved the U.S. Capitol from right-wing terrorists had the orange abomination not obstructed the National Guard from doing their jobs. The National Guard needs to be quickly trained and mobilized in multiple U.S. states to improve the quickness and eliminate “bottle necks” on vaccine shots. This is what the National Guard is there to do, and the quicker they are mobilized and trained on how to give vaccine shots, the quicker this ends and the more prepared the U.S. National Guard will be for the next pandemic.
In short, let’s change the National Guard’s moniker from “weekend warriors” to “saviors of America’s domestic elderly population”.
I used to get my flu shot at the army base where I worked. I can attest from personal experience that the jab from a soldier is significantly more painful than a jab from a professional nurse.
Did the flu shot given by a soldier still work for inoculation ?? And if it was a virus which had high fatality rates (and/or serious longterm lung/heart damage) for those in the range 5 years younger than you to 5 years older than you at that time would you have told them you would wait another 6 months for the shot?? Keep in mind I have said for months now that I didn’t think we’d have mass level of vaccine shots until at the earliest July–August ’21 and we had many commenters on here talking about April March which was and is laughable. You can credibly argue the lower side of that time frame if you like, but 6 months difference conditional on National Guard participation in giving the vaccine shots is not “a stretch” by any means.
from what i have seen, the national guard does not seem to be the solution. the problem is not enough people willing to jab others. the problem is that we do not have enough vaccine to jab anybody. there really does seem to be a logistics problem with getting the vaccine distributed. and it does appear that trump had absolutely no plan in place to achieve this goal. that is problem number one. problem number two is that production of the vaccines is not as robust as was promised by trump. problem number one would be even bigger if not for problem number 2. this will eventually be fixed, but it is certainly one of the drivers of frustration right now all around the country. we should have been better prepared. in houston, they have created mass vaccine sites. thousands of people register today, and by tomorrow they are getting the shot. and the process works. but then we are silent for week(s) while awaiting more vaccine. too bad trump spent months complaining about a stolen election. if he had actually worked, we would be in better shape. and his reputation would be much better than it has now become.
@ baffling
I’m not going to argue what is the biggest problem, because I don’t think any of us (“us” read as the general public) have enough of a true picture to know what is the problem. I would say it depends also on which state. But I will tell you this, in my state they say there are many vials still frozen and unused and just in my state alone there are THOUSANDS of vials both at CVS and Walgreens they are admitting have yet to be used. Is that because they are focusing on making sure they have enough for the 2nd shot?? I don’t know, but it strikes me as odd when the vast majority still haven’t gotten their first shot. I also see cars lined up for blocks back (when supposedly they all have to register for a set time before going out for the shot). That’s not a bottle neck?? Because I doubt that happened pre-2020 when people went to get their flu shot.
Moses Herzog The Operation Warp Speed (OWS) org chart is dominated by uniformed military officers who are only passing through long enough to get their tickets punched. There are four general officers sprinkled amidst an organization with fewer than one hundred individuals. That should tell you something. I know GEN Perna. He’s a smart guy but at the end of the day he is a general officer and does not understand the nitty gritty of logistics or operations research. The OWS team saw its mission as primarily one of awarding contracts and then stepping back. To the extent that they got involved in logistics planning, they tended to fall back on the military’s usual approach to managing problems; viz., they instinctively thought in terms of ranking actions according to a list of priorities. If you’re an officer in a pressing combat situation, then thinking in terms of priorities is a useful skill. But as the Army’s Industrial War College used to preach, that’s not a skill that should be carried over to long run planning in a non-combat environment. Economists are all about equalizing marginal benefits across a range of goals. The military mind is all about ranking things according to some priority scheme. And that’s why you’ve got a distribution mess with excess supplies here and shortages there. It would have helped if the OWS team and the states had done some kind of discrete event simulation planning last summer. Even if they didn’t know the number of vaccines that would be available, at least they would have had a distribution template on the shelf.
And my apologies to JDH for drifting off topic.
Moses, i agree. We do not have the bottlenecks that you see. So it is a local issue. Sometimes i forget we have the texas medical center, which is the largest cluster of medical facilities in the world. Lots of medical personnel. That is why we could probably jab 10’s of thousands per day if we had the vaccine. You are right, most of america does not have this local resource. The national guard would probably be a hindrance here, but helpful elsewhere.
https://kfor.com/news/local/arms-race-why-62000-doses-of-covid-vaccine-sit-frozen-in-oklahoma/
That’s 62,000 doses that are in the state right now. They are in the state, they aren’t waiting for the federal government to deliver them.
Hey, Moses! I’ll give you and the rest of the guys some entertainment produced by John Cullen who developed the database mapping software for Oracle that Johns Hopkins uses for tracking COVID-19. Enjoy.
PART 1: https://youtu.be/sVmNFoEjv90?t=470
PART 2: https://youtu.be/4-JpcPZRU8Y
PART 3: https://www.youtube.com/watch?v=2gJP-L3z6uY
Over 90 minutes of youtubes featuring someone accused of spreading COVID19 misinformation! Gee Bruce – your entire life is consumed with lying to people about this virus. Folks do not waste your time with this or any other intellectual garbage ala our Village Idiot Bruce Hall.
https://bringmethenews.com/minnesota-news/dr-scott-jensen-says-hes-being-investigated-by-medical-board-for-spreading-covid-19-misinformation
Bruce Hall is not being exactly honest about who this John Cullen nutcase really is. Lots of youtubes with QAnon types interviewing this clown with choice lines like this:
‘President Dumb Joe is decimating the constitution daily with his draconian Executive Orders banning words, phrases and our right to move about freely. John Cullen joins me to explore this dark path we are rapidly headed down.’
Actually even the QAnon types are not this incredibly insane. Bruce Hall – promoting the most absurd intellectual garbage ever.
Bruce, i gave up after about 5 minutes. The dude is a joke. And lets be honest. He worked at oracle 30 years ago. The system in use by jhu is not even remotely what he worked on back then. If this is where you get your sources of information, it would explain the silliness of your comments.
@ Bruce Hall
I normally like to hear people out, but I don’t want to reward that type of content by giving it increased web traffic, so I’m gonna skip that one. I suggest you avoid your usual media choices (if for no other reason than improving your mental health). Maybe you can listen to content that comes from a different world perspective than your own.
https://www.youtube.com/watch?v=LZ055ilIiN4
Latin American countries have recorded 4 of the 13 highest and 6 of the 24 highest number of coronavirus cases among all countries. Brazil, Colombia, Argentina, Mexico, Peru and Chile.
Mexico, with more than 1.8 million cases recorded, has the 4th highest number of cases among Latin American countries and the 13th highest number of cases among all countries. Peru, with more than 1 million cases, has the 5th highest number of cases among Latin American countries and the 18th highest number among all countries.
Mexico was the 4th among all countries to have recorded more than 100,000 and now more than 150,000 coronavirus deaths.
January 28, 2021
Coronavirus (Deaths per million)
US ( 1,336) *
Brazil ( 1,039)
Colombia ( 1,034)
Argentina ( 1,048)
Mexico ( 1,184)
Peru ( 1,218)
Chile ( 946)
Ecuador ( 830)
Bolivia ( 864)
Panama ( 1,193)
Costa Rica ( 508)
* Descending number of cases
ltr and Moses:
This post is about GDP.
If you want to say this post mainly addresses BEA technical definitions of what a recession is, I respect that. If you’re telling me that when this recession ends has no linkage with transmission rates, lockdowns, and a negative money multiplier (ok, lower chance if the $1400 payments come to pass) going forward, I would very respectfully argue with you on that point.
For those with a love of focusing on BEA numbers (very understandable, as it’s a great outfit/institution) you might take note that multiple of the more respected vaccines (at least 4 now, there are probably others soon to be released, I’m thinking of one from Stanford U) are having problems with efficacy rates and the new variant. Something to keep in mind when projecting February onward transmission rates and lockdowns.
https://www.nytimes.com/2021/01/29/health/covid-vaccine-johnson-and-johnson-variants.html?action=click&module=Spotlight&pgtype=Homepage
I know this is off topic but this twitter battle between Ted Cruz and AOC is a joy to watch:
https://talkingpointsmemo.com/news/ocasio-cortez-cruz-twitter-robinhood
According to https://tracktherecovery.org/ consumer spending was pretty steady in October and November but then plunged in December, then rebounded, then plunged again. Spending spiked immediately after the stimulus payments went out, but then plunged again. So how much of the level growth in October and November is masking the drop in December spending? In other words, if we estimated GDP using more granular monthly data would the Recession Index be as confident about the recession having ended in 2020Q4?
Was there data seasonally adjusted? We normally have a Christmas spike in consumer spending which could have been altered by this virus. If the seasonal adjustment factors were based on past years, the noise in the data they present may be a bit misleading.
I don’t know if their data was seasonally adjusted. It’s based on sales data by zip code. That said, it’s consistent with today’s detailed PCE data from BEA. Yesterday’s GDP report showed 2020Q4 real PCE of 13,004.7B (Table 1.1.6). And today’s monthly PCE data (Table 2.3.6U) shows the following:
Oct 2020: 13,090,804M
Nov 2020: 13,001,612M
Dec 2020: 12,921,803M
Taking the average of the three monthly estimates and you get the $13,004.7B value in the Table 1.1.6 GDP report. So it’s pretty clear that PCE peaked in the September/October timeframe and has since retreated to about where it was in August. This is consistent with the quick-and-dirty tracktherecover.org data.
Oct 2020: 13,090,804M
Nov 2020: 13,001,612M
Dec 2020: 12,921,803M
A 1.3% decline. Somehow I do not see this in the same alarming light especially given the potential measurement issues here. Maybe this decline was potential new home owners making sure they can get the down payment on the new house.
It’s not so much that the monthly PCE numbers are alarming, but rather that they suggest the recovery might have peaked towards the end of 2020Q3 and early 2020Q4. So this agrees with the algorithm in JDH’s recession index that called the end of the recession in 2020Q3. But the 2020Q4 GDP number is positive only because of the October data. Pull that October data forward by a week or so and the 2020Q4 GDP growth rate might very well have been negative. I think the concern is that we’ll fall into a double-dip recession unless there’s a strong turnaround in 2021Q1. JDH said that if there is another dip in 2021, then the NBER committee is likely to call that a second and separate recession. But the weak November and December PCE data suggests that one interpretation of the 2020Q3 would be a transient overshoot rather than anything representing a sustained recovery. If that turns out to be the case, then I would think a single prolonged recession would be a more natural interpretation rather than two separate recessions.
2slugs, this was what i was alluding to with my question below. especially if both downturns are caused by the same source. kind of a biasing problem due to the time measurements. you can run an FFT on two data sets with slightly different time measurement intervals, and get results from mildly different to substantially different for the same total interval. treating it as 2 different recessions will impact how we properly examine the effects of the recession and compare to other episodes in history. mechanical analysis has its limits i guess.
” If there is a downturn in 2021, the mechanical algorithm that we have been using for 15 years would label it as a separate recession.”
i understand the empiricism of this argument. however, is there any consideration given to the fact that if the SAME source of the recession (in our case the virus) continues to exist and overwhelm the initial response, that we would not label it as a separate recession? for example, if the most recent strains of the virus from south africa and elsewhere, do not respond well to vaccines and are more transmissible, then we could go back into signifiant shutdowns and another drop in the economy. would that still be treated as a separate recession with a very short recovery in between? is there a minimum length for a recovery?
We had a recession that began in the spring of 2001. Of course Team Bush blamed Bill Clinton for that. So yea – if the economy has a downturn in the next month or so – the partisan divide with argue to the cows came home whether it was due to Trump’s incompetence or to the fact that Biden had to wait until to January 20 to get any accurate information from the Federal government.
Professor Hamilton,
Looking at the percentage relationship of real personal consumption divided by real disposable income (FRED series PCECC96/DSPIC96), this ratio which if I am correct is the average propensity to consume was about 89% for 2019 using annual data and was about 80.7 for 2020. As we recover, should we expect the average propensity to consume to increase toward the past? I notice that from 1960 to 2020 the past low was about 84.2% for 1973 and the high was 93.2% for 2005. What should we expect as the new APC?
It seems that the House Republicans want to have a whole new set of rules. First of all if one person ask other person to wear a mask that mere request is berating the other person. And if Marjorie Taylor Greene pulls a gun on the first person – she is only defending herself and exercising her Constitutional rights. MAGA!
James Hamilton: “This post is about GDP.”
Yes, GDP, that narrow subject that economists forever obsess over even though it is of less importance to the average person than how that GDP is distributed.
This obsession about GDP reminds me of the story of the drunk looking for his car keys under the lamp post in the dark. When asked queried, he says that he lost his keys down the block but the light is much better here.
GDP is much like that. It’s easier to measure (and less troubling) than things like social welfare so that’s what economists talk about all the time.
Economists do care about the distribution of income. And if you think it is easy to measure, try working for BEA. Let’s be fair to our hosts – this was a single post and both of them have made so many more on so many different topics.
I think joseph wasn’t really making a dig at our good host Mr. Hamilton. But more a general comment that sometimes economists can give the impression (however false that impression) of being apathetic. And it does economists good to be self-aware when their comments might come across that way in dark times such as we are in now. That being said economists are not paid to give sentimental value judgements. So economists are “damned if they do and damned if they don’t”. I think most of us here perceive Professor Hamilton as a kind gentleman with empathy.
I respectfully disagree on a demarcation here based on GDP numbers, as I view we are still in the same recession, but I’m basing that mostly on my own largely “softhearted” (I believe Alan Blinder once use this term/adjective) vantage point on the matter. I think with a knowledge base multiples greater than my own, Prof Hamilton knows softhearted isn’t always the best barometer.
https://www.goodreads.com/book/show/1231649.Hard_Heads_Soft_Hearts
https://www.bloomberg.com/news/videos/2020-11-24/yellen-brings-a-strong-minded-but-soft-hearted-attitude-alan-blinder-video
Not to mention Prof Hamilton’s math skills are multiples better than my own, the damned *#$&%^@&@%*$@^##!!!!!!!! [the doofus typed, enraged with jealousy ]
It seems that certain members of Congress has joined the Trumpians calling for civil war and the overthrow of our government:
https://www.nytimes.com/2021/01/29/us/republicans-trump-capitol-riot.html
Treason used to be a felony but in Trump world it is the means to gaining high office.
Call me economically challenged, but I find it difficult to understand the logic behind determining the effective and contingent end of a recession from the moment the numbers stop declining.
Well, I do understand, if economists prefer being philosophically scholastic. Mind that isn’t necessarily a pejorative – I was immersed in Saint Thomas of Aquinas for some happy years. But still…
I do not think the most important question is the end of the recession. I think the most important questions are how many families are facing eviction and how may families are facing food shortages and what’s being done to help them.
Unfortunately, I see little reporting on this issue. And I think it is the core issue.
So, Jim, I know I am trying to cause trouble and appreciate you will not reply, although this is about GDP. So Menzie just put up figures showing GDP appearing to slightly turn down. You seem to support the idea that not only is the recession over all but officially, but indeed the prospect is that there will be no further downturns of GDP, barring a major outbreak of some Covid mutation that leads to a fresh round of lockdowns.
Assuming that Biden does manage to get some sort of reasonable stimulus through Congress and there is no major fresh outbreak of he pandemic, then it does seem likely the economy will continue to grow, as measured by the GDP. But then you are focusing on quarterly measurements so noting longer term changes, with the actual period of decline of GDP possibly not even being as long as a quarter.
So might we see what Menzie shows getting somewhat more noticeable, a brief period of actual GDP decline that does not get large enough or long enough to eventually show up as an outright quarterly decline?
Barkley Rosser My take is that Menzie is looking at the key indices used by NBER to determine when a recession begins and ends. Those indices are yielding mixed results right now. JDH’s algorithm is using GDP to estimate when the recovery begins, however tentative or incomplete that recovery might turn out. JDH is just looking for a turning point, which JDH says is consistent with the way economists actually interpret the end of a recession. The advantage of JDH’s algorithm is that you don’t have to wait for hell to freeze over before the NBER committee gets around to making a call. The downside is that you run the risk of significant data revisions that might upset the initial call.
The larger question is why should we care about what name economists assign an economic phenomenon? Presumably it’s because the name isolates some underlying dynamics that economists want to capture in their models. Those models typically view recessions and expansions as endogenous events (e.g., inventory mismatches, financial bubbles, Fed reactions to inflation, etc.) working themselves out through endogenous channels. So economists assign a “0” factor to expansions and a “1” factor when the economy is in recession. But does that make any sense when the source of the economic downturn was almost entirely an exogenous once-in-a-century (hopefully) event and the policy choices are equally exogenous? Maybe economists should redefine their ID factors; e.g., “00” for when the economy is in expansion; “10” when the economy is in recession; “01” when the economy is in the expansion phase during a pandemic” and “11” when the economy is in the recession phase of a pandemic. Or whatever. The point is that for future modeling purposes economists might not want to lump a sui generis recession in with garden variety endogenous recessions.
Hmmm, not too often I disgree with you, 2slug, but I think you are off on this one.
Looking at Jim’s post again, I do not see any use of any algorithms. He seems simply to be reporting official BEA numbers, quarterly numbers, on GDP, something he has done before I believe I think what Menzie is doing, as in a post just shortly before this one, is looking at much shorter time horizon data, monthly from various sources. It shows a one month slight downturn of GDP, even as some other variables, especially manufacturing, are going up, if more slowly than before. This was the basis of my effort to attempt to get a dustup between our two hosts, which I think both are going to go out of their ways to avoid doing.
In any case, there might well be a month here or there of GDP actually going down a bit, without that manifesting itself when we measure things quarterly. So there is no necessary contradiction, but I noticed Jim making no notice of any slight downturn. As it was he stuck to reporting strictly on the BEA quarterly data.
Barkley Rosser I should have been clearer. I was referring to the algorithm behind his second graph.
2slug,
Yes, you are right on that. Jim and Menzie’s recession index is not just a bunch of BEA official numbers.
my inclination would be to say that’s just setting us up for a covid double dip, but i see no evidence of that yet…
first quarter GDP is going to be difficult to grow, after back to back real declines in monthly PCE; can any 1st quarter month beat October PCE?
that, plus there is no more rebound bounce left in fixed investment…
the switch to extra goods consumption over services has decimated our trade balance..
that leaves just depressed inventories to carry the load for 1st quarter GDP…but they still have a lot of recovery room left; that big positive contribution to Q3 GDP was still on falling real inventories..
Monthly declines can be misleading as they were amped up by CARES, above the rate of natural spending.
however it happened, it still impacts GDP, and no one will put an asterisk on it…if our real PCE is flat in January, we will need 1% growth in real PCE in both February and March to have real first quarter PCE grow at a weak 1.4% annual rate from the 4th quarter, which just gets us a 103 basis point addition to Q1 GDP
I read the background material, good stuff. This is really logbinomial approximated well by lognormal. You are maintaining two binomials, like an optimum portfolio manager with two sectors.
I did not quite get both parts as follows:
Part one if you get a new reading you have to decide if this is a recession or expansion,, first. Then you update your two binomials appropriately, then you compute the Bayesian inference. I missed the first part, but i am sure you have it.
If you are updating your binomials such, then you are really log entropy, the productivity norm, you are minimizing redundancy. That is the Lucas criteria, though he may not be aware of that.
“my inclination would be to say that’s just setting us up for a covid double dip, but i see no evidence of that yet…”
I’ve been a devotee of the yield-curve and recession probabilities derived from it for several years now. (Calculated on a monthly basis.)
The recession probability has fallen from 100% Sept. 2019 down to its current 35.75%. However, it typically has to drop to the low single-digits before a recession is truly over.
Also typically, the yield-curve has to rise to around +275 bp or so before the credit market for investment becomes favorable (coming out of a recession). It’s only around 100bp right now.
FWIW.
Sebastian