With the upside surprise in nonfarm payroll employment, we have the following picture of economic activity.
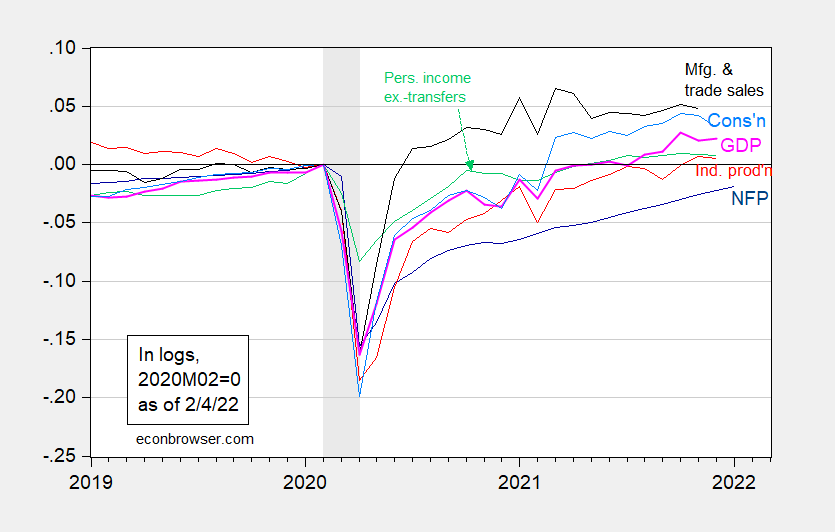
Figure 1: Nonfarm payroll employment (dark blue), industrial production (red), personal income excluding transfers in Ch.2012$ (green), manufacturing and trade sales in Ch.2012$ (black), consumption in Ch.2012$ (light blue), and monthly GDP in Ch.2012$ (pink), all log normalized to 2020M02=0. NBER defined recession dates, peak-to-trough, shaded gray. Source: BLS, Federal Reserve, BEA, via FRED, IHS Markit (nee Macroeconomic Advisers) (2/1/2022 release), NBER, and author’s calculations.
I don’t think seasonal adjustment is an issue in interpreting nonfarm payroll employment growth (see this post).
oh-oh. i do think seasonal adjustment is an issue in interpreting January’s nonfarm payroll employment growth, or at least i suspect it is…i cannot access David Goldman’s article, but based on your response, i don’t think i have the same issue…..i know very little about how seasonal adjustment is computed, but to my understanding the algorithm for seasonal adjustment takes several years of historical data and comes up with averages on how much the data should be expected to change each month, and then adjusts the current month’s data to account for that….ie, if jobs are normally expected to fall 2.5 million from December to January and they only fell by 2 million, then seasonally adjusted jobs rose 500,000…
the benchmark revision includes a once a year adjustment/re-computation of that algorithm, and in my experience, recomputation of seasonal adjustments of don’t usually result in massive changes…but when i looked at the first table one encounters in the employment situation summary ( https://www.bls.gov/news.release/empsit.nr0.htm ) i see large upward revisions to November (+398k), December (+311k) and January (+287k) payroll job increases, and big downward revisions to May (-167k), June(-405k) and July’s (-402k) payroll jobs…i’ve spent enough time with the Covid graphics to recognize those months as coinciding with the peaks and troughs of the Covid waves….so what i think has happened is that the seasonal adjustment algorithm picked up the jobs impact of the Covid ebb and flow over the past couple years and incorporated it into the new seasonal adjustments….that would mean the employment effect of last year’s January Covid peak would be impacting January’s seasonal adjustment by making it larger….that said, i’d almost have more confidence in last year’s jobs data as it was originally published than what it shows now…