Articles regarding the signals emanating yield curve appear in Reuters, CNBC, FoxBusiness, Bloomberg, CNN . Here’s a relevant picture:
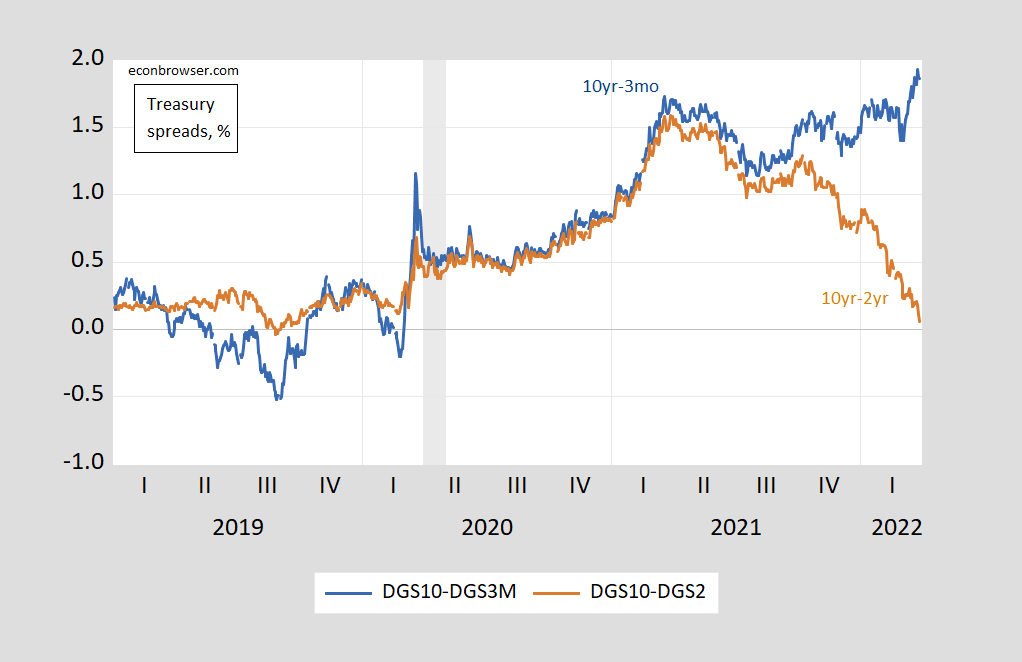
Figure 1: 10 year – 3 month Treasury spread (blue), 10 year – 2 year spread (brown), all in %. NBER defined recession dates shaded gray. Source: FRED, NBER, and author’s calculations.
The 10yr-2yr spread is approaching zero, so that segment of the yield curve would be closing in on inversion, a sometime precursor to recession.
Inspection of the yield curve today, and at several points in time, suggests that today’s inversion does not apply to a wide segment of curve.
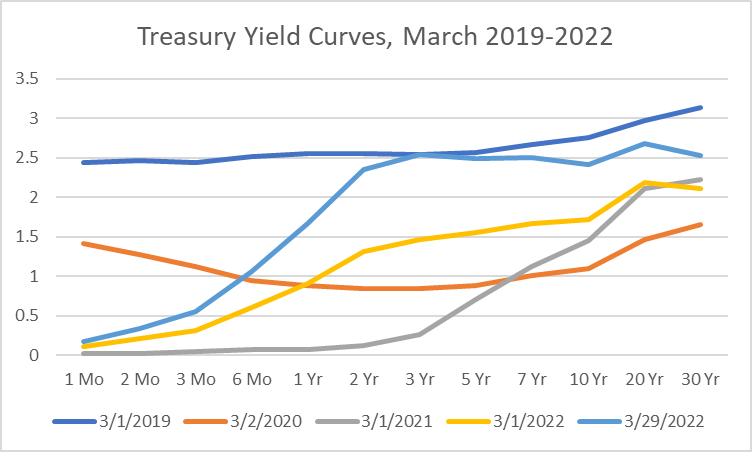
Figure 2: Yields for Treasurys at different maturities, in %. Source: Treasury.
Note that as of today, inversion is only showing up at the 10yr-3yr segment (10yr-7yr segment as of yesterday).
The rationale for inversion serving as a precursor to recession is the idea that lower expected future short rates during recessions drive lower longer maturity rates. In principle, a “cleaner” look at how expected future short rates look relative to the current short rate can be obtained by removing the term premium (presumably driven by inflation risk) for the long maturity. In Figure 3, I show the spreads adjusted by DKW estimated inflation risk premia.
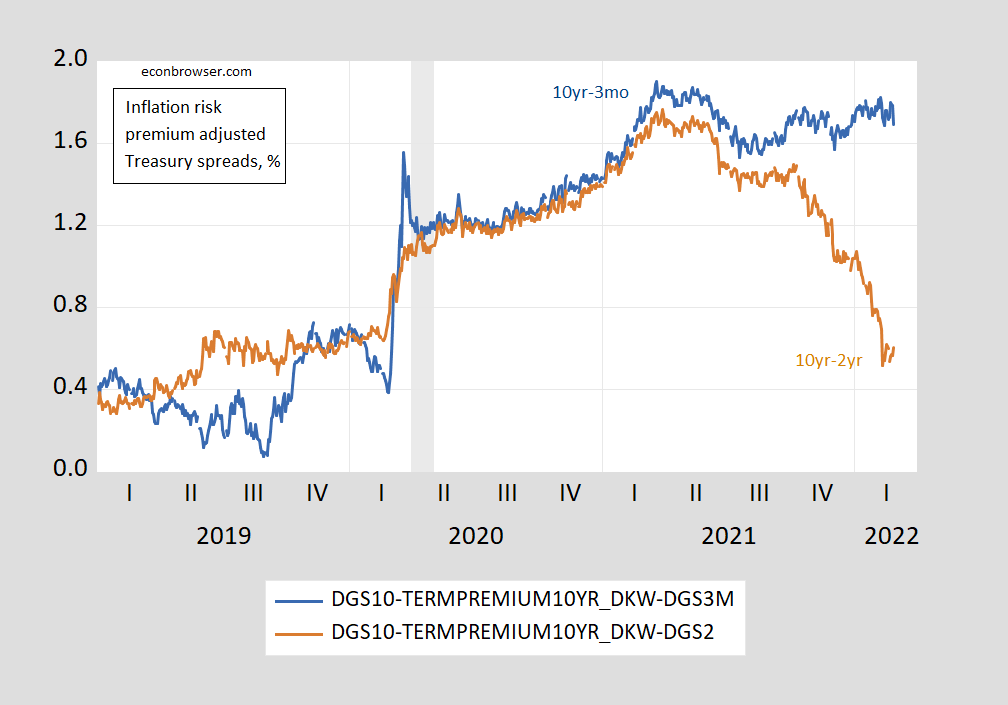
Figure 3: 10 year – 3 month Treasury spread subtracting estimated inflation risk premium (blue), 10 year – 2 year spread subtracting estimated inflation risk premium (brown), all in %. NBER defined recession dates shaded gray. Source: Treasury via FRED, NBER, KWW following DKW, and author’s calculations.
When the 10 yr-3 mo spread is purged of the term premium on the 10 year Treasury, then in principle that variable measures the expected short term interest rates over the next 10 years relative to the current 3 month yield. This is what the unadjusted and adjusted 10yr-3mo spread looks like over the past 3 decades.
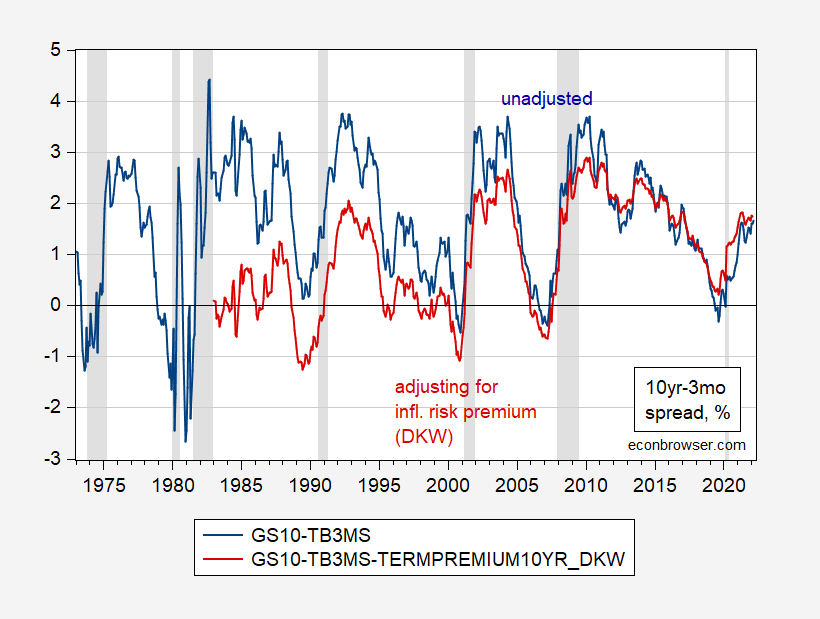
Figure 4: 10yr-3mo Treasury spread (blue), 10yr-3mo spread minus 10 year inflation risk premium (red). March observations through 3/29. NBER defined recession dates peak-to-trough shaded gray. Source: Source: Treasury via FRED, NBER, KWW following DKW, and author’s calculations.
Note deep inversions of the adjusted series typically precede recessions.
We don’t have a 2 year inflation risk premium estimate so as to be able to adjust the 10yr-2yr spread (the above calculation assumes the 3 month Treasury risk premium is nil). However, what is true is that the 10yr-2yr spread taking off the 10 year inflation risk premium had not yet inverted as of end-February (0.6 ppts adjusted vs. 0.39 ppts unadjusted).
For more on term spreads, and credit spreads, and recessions, see this post.
Inflation risk only, or geopolitical risk, macroprudendial bank regulation, etc? Anything not captured in expected cost of funding and expected inflation?
Professor Chinn,
Do you have any confidence in a probit model using the gap in GS10 and GS2 EOM data?
Using USRECM(+18mo) c gap, I seem to get a probability of recession of about 31%, but a 15% threshold shows an expectation probability valuation of 73% correct in forecasting a recession, and about 77% forecasting no recession.
From FRED, I used daily data from 1976 to 2022 edited to model end of period monthly data.
AS: My favored model uses 10yr-3mo possibly including 3mo as additional regressor, at 12 month horizon. More generally, you might find this article of interest.
Professor Chinn,
Thanks.
Since the 10yr-3mo does not seem anywhere near signaling recession, I looked at the 10yr-2yr. I notice from your recommended article, Figure 4 AUROC 1984 to 2018 seems to give a reasonable nod to the 10yr-2yr recession forecasting ability for near the 18-month timeframe, if I am reading Figure 4 correctly.
Interesting dilemma for an amateur to reconcile the results of the 10yr-3mo model with the 10yr-2yr model. Expert advise is needed.
Non-expert advice –
Give the discrepancy between 10y/2y and 10y/3m spreads substantial weight in your confidence in the forecast.
Look to other features of the business cycle to make an assessmnt of the likelihood of recession, independent of yield spreads.
@ AS
Information on the “2-10 spread” from Eric Engstrom and Steven Sharpe of the Fed:
“Ultimately, we argue there is no need to fear the 2-10 spread, or any other spread measure for that matter. At best, the predictive power of term spreads is a case of “reverse causality.” That is, term spreads predict recessions because they impound pessimistic—often accurately pessimistic—expectations that market participants have already formed about the economy, and thus an expected cessation in monetary policy tightening. Thus, term spreads could have little or no economic impact in and of themselves. Nevertheless, as FDR might have pointed out, it can only make things worse if investors not only fear the prospect of a recession, but at the same time, are spooked by that fear itself, which is mirrored in inverted term spreads.”
https://www.federalreserve.gov/econres/notes/feds-notes/dont-fear-the-yield-curve-reprise-20220325.htm
There’s also sometimes discussion about commercial banks’ ability to pay off debts based on the mix of the terms–called a “duration gap” or “mismatches”, but I don’t think you need to think about it very much in this context.
God bless
“The rationale for inversion serving as a precursor to recession is the idea that lower expected future short rates during recessions drive lower longer maturity rates. ”
In reality, aren’t the funding costs of purchasing Treasuries (i.e., repo) the real drivers of recessions?
No, rsm, they are not. Go ahead: name one recession or depression ever when they were.
As I understand it, the actual signal from yield inversion is basically based on the wisdom of the investment crowd. In this case the “crowd” is the professional bond investors, so a fairly knowledgable but far from infallible bunch of people.
The only reason to buy a 10-year bond at lower yield than you could get a on 5-year bond is that you expect that if purchasing another 5-year bond in 5 years, the yield of that second round of 5-year investment would be lower. The flatness of yields on 3-10 years would suggest that the average opinion is that it is just as likely that yields will go up as that they will go down, out in that time range. The very steep increase at 1 mo – 2 years is natural if you expect a rising interest rate within the next 2-years (investors think there will be an advantage in delaying large bond purchases another 3-12 months.