From BEA today:
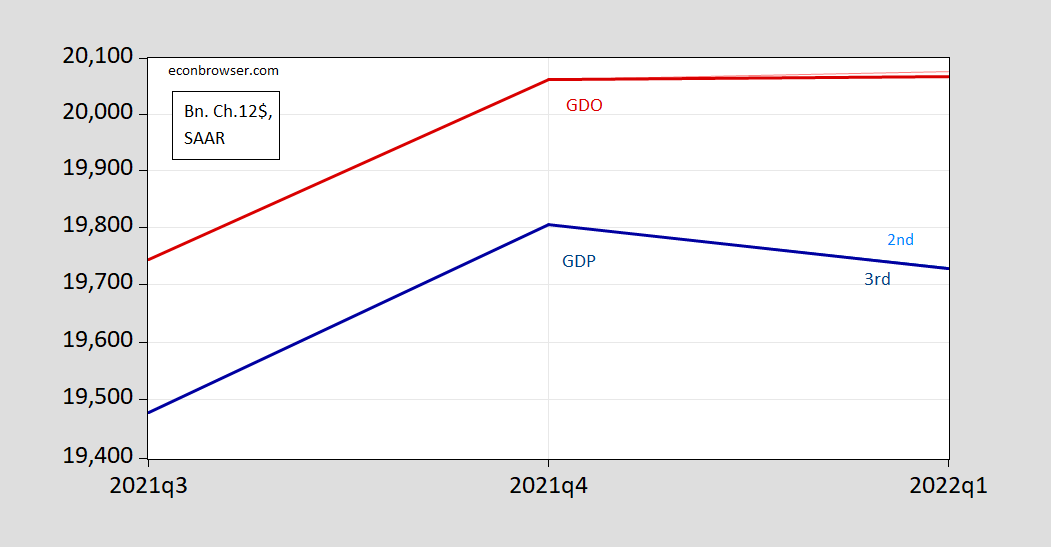
Figure 1: GDP, 3rd release (dark bold blue), 2nd release (light blue), GDO, 3rd release (dark bold red), 2nd release (light red), both in billions Ch.2012$, SAAR. GDO calculated using average of real GDP and GDI deflated using GDP deflator. Source: BEA, author’s calculations.
It’s very hard to see on this scale the impact of the revisions. Here’s the impact in annualized growth rates (log terms):

Figure 2: Quarter-on-quarter growth rate of GDP, 3rd release (dark bold blue), 2nd release (light blue), GDO, 3rd release (dark bold red), 2nd release (light red), both SAAR. GDO calculated using average of real GDP and GDI deflated using GDP deflator. Source: BEA, author’s calculations.
Gross domestic output up slightly? Princeton Steve keeps touting how it fell in Q1. Oh wait – gross domestic income rose by more than gross domestic product fell. But of course all of us who actually read the excellent posts provided here knew that already. But not Princeton Steve as apparently he only reads his own bloviating.
Really, really off topic-
I suppose everyone has already sent this, but just in case:
https://cdn.vox-cdn.com/thumbor/p9DE6RFQ18cus8xE5z84cFdI68Y=/0x0:922×642/720×0/filters:focal(0x0:922×642):format(webp):no_upscale()/cdn.vox-cdn.com/uploads/chorus_asset/file/23643887/heat_waves_download1_2021_1__1_.png
This graph shows the steady progression of increasing heat waves over the past six decades. No quibbling over end-points. Or much of anything else, if one is honest.
Check the composition of GDP for Q2, including revisions.
BEA Release Components
https://apps.bea.gov/national/pdf/revision_information/rev1_1q22_3rd.pdf
Two things you never note. GDI rose by more than GDP fell. Oh well – Dr. Chinn has noted this often. Pay attention and at least try to be honest.
Fixed investment demand was very strong. Oh well – your little housing investment collapse sort of is not there.
i already noted on an earlier thread that growth of real private inventories was revised from the previously reported $149.6 billion in 2012 dollars to growth at a $188.5 billion rate, which is a big inventory mountain for the 2nd quarter to climb….today’s income and outlays report had April PCE revised 0.8% lower, which left the PCE contribution to 2nd quarter GDP at 85 basis points (math: ((((13,950.3 + 13,895.5 ) /2) / 13,881.1 ) ^ 4 – 1) * (13,881.1 /19,727.9 ) = .00851 ) so the 2nd quarter is looking increasingly weak, and we might avoid a technical recession only by virtue of China’s covid lockdown, which took a hammer to our imports over the past two months)