Today, we are fortunate to present a guest contribution written by Arthur Stalla Bourdillon, economist at the Banque de France. The views expressed herein are those of the author and should not be attributed to the Banque de France, Eurosystem or NBER.
In a new NBER WP, Nicolas Chatelais (Banque de France), Menzie Chinn (Univ. of Wisconsin) and I use sectorally disaggregated equity variables within a factor model to predict future US economic activity.
The idea of the project originated during the Covid-crisis. At that time, aggregate equity indices disconnected from real macro-variables. As a consequence, an econometrician trying to forecast economic activity, here Industrial Production (IP) growth, with aggregate equity variables such as the market dividend yield (DY) would have obtained poor results (Figure 1).
Figure 1: S&P 500 and US Industrial Production (100 = Dec.2019)
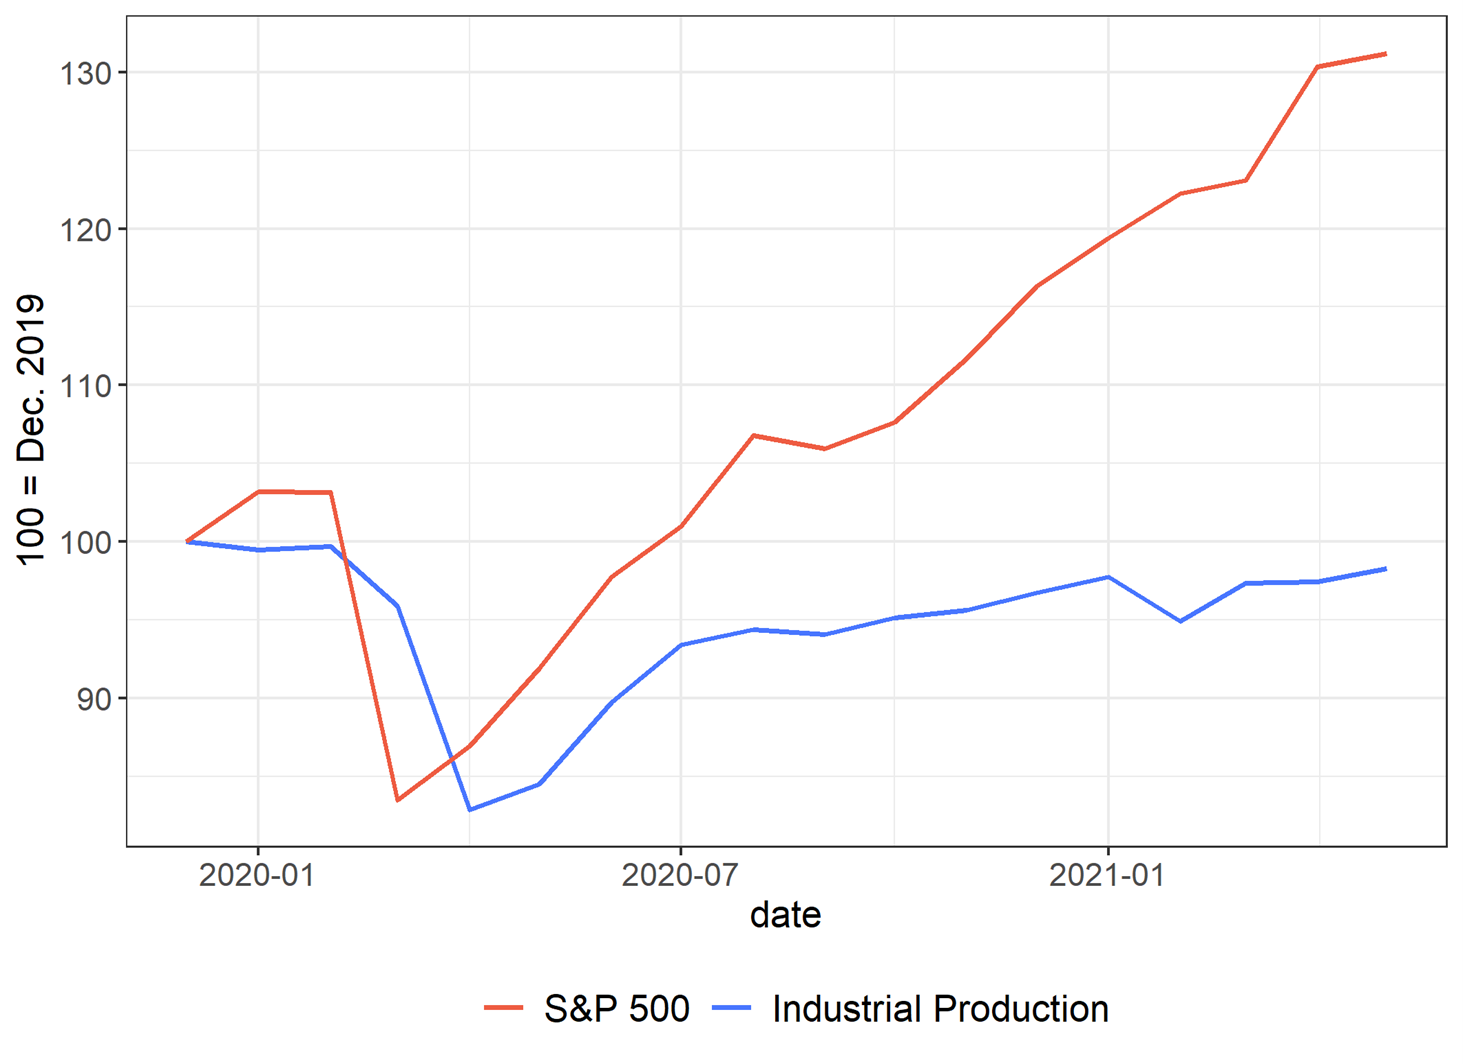
Note: The graph represents the evolution of the US Industrial Production and of the S&P 500 Index. Both indices are set to 100 in December 2019. Sources: Federal Reserve Economic Data, Refinitiv Datastream.
However, we show in the paper that relying, within a factor model, on sectoral rather than aggregate DYs sharply improves our forecasting accuracy when we compare the performance of our model against classic benchmarks (like the term spread, the lag of IP growth, or the Market DY), both in-sample, and out-of-sample (Figure 2).
Figure 2: Out-of-Sample RMSE from the different estimated models
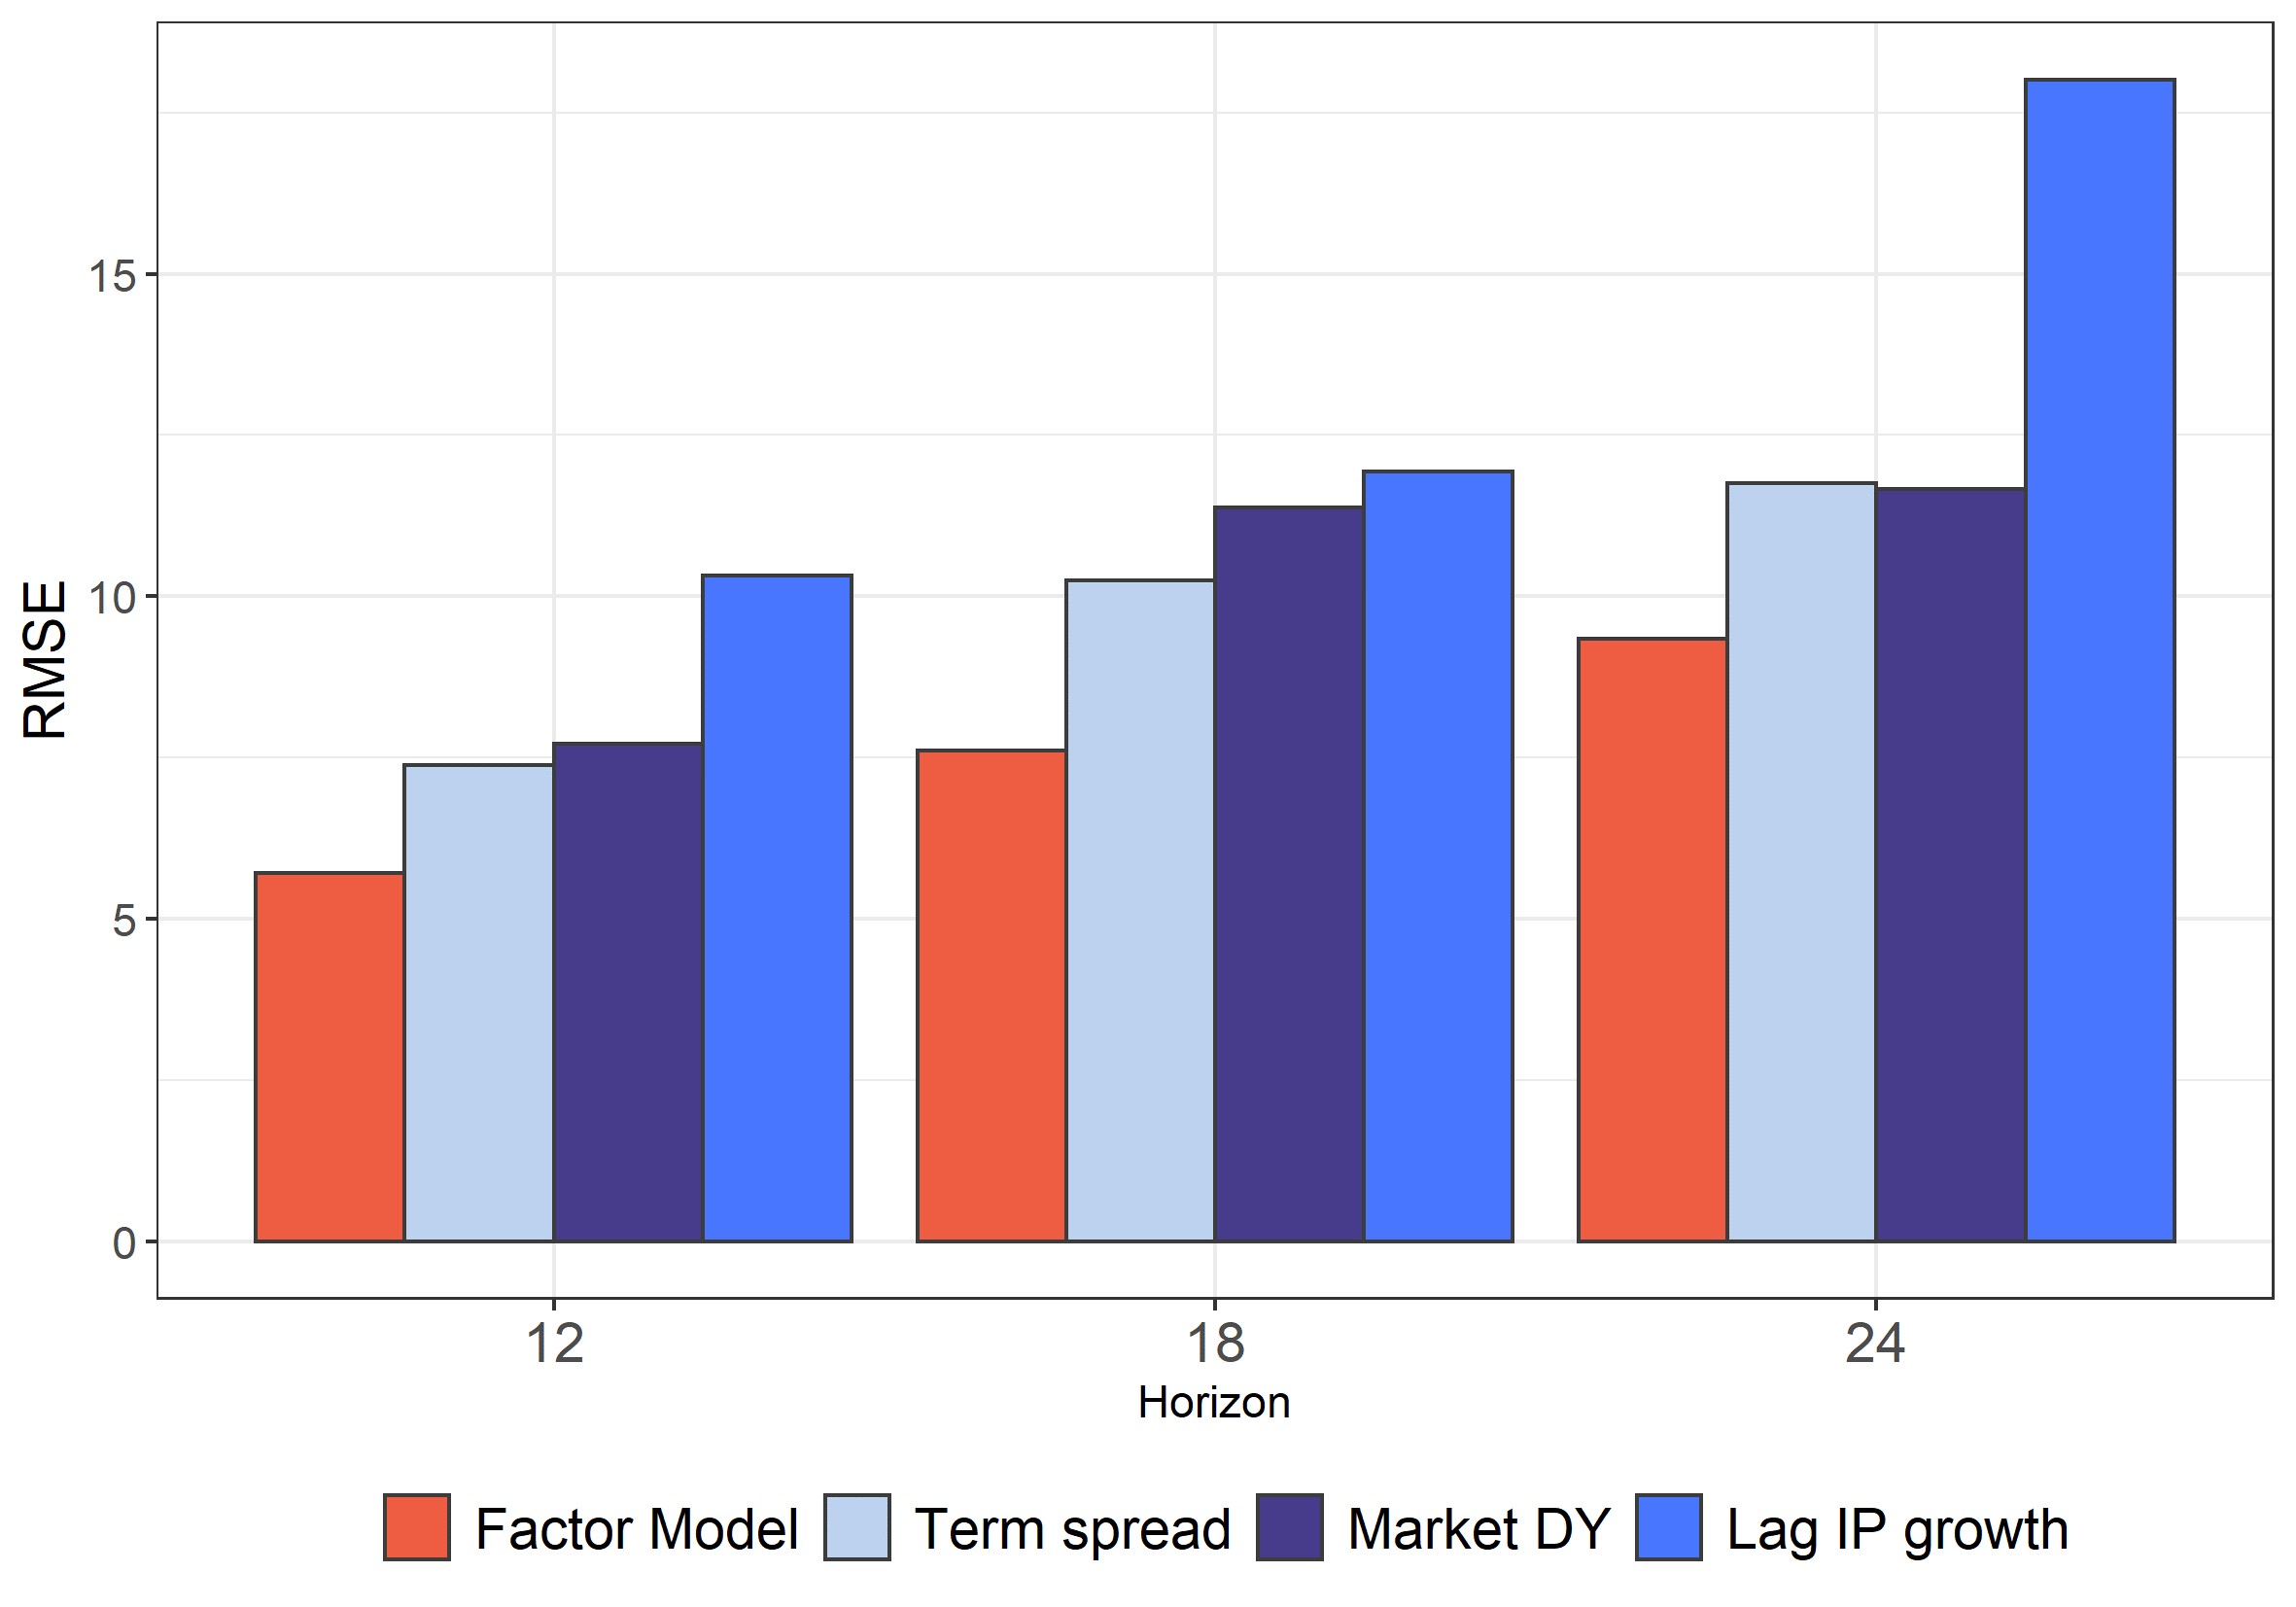
Note: On the graph are represented the Out-of-Sample RMSE of different models (the factor model or univariate regressions relying either on the aggregate DY, on the lagged IP growth or on the term spread). The predicted variable is the IP growth over 12, 18 and 24 months.
Why is it the case?
It occurs mainly because equity variables reflect not only expectations of future economic activity, but also changes in investors’ discount rates. Therefore, a regression of future IP growth on the aggregate DY is very likely misspecified. In contrast, our factor built on sectoral DYs appears to be purged from this “discount rate” component, and reflects more accurately future economic activity, compared to the raw aggregate stock market variables.
This forecasting outperformance is, intuitively, especially strong in times where discount rates are very volatile (recession, Covid-crisis) and thus obscure the signal stemming from aggregate equity indices. It therefore appears that the outperformance of our factor model is mainly concentrated in period where IP growth is already negative (Figure 3).
Figure 3: Out-of-Sample RMSE from the different estimated models, by period
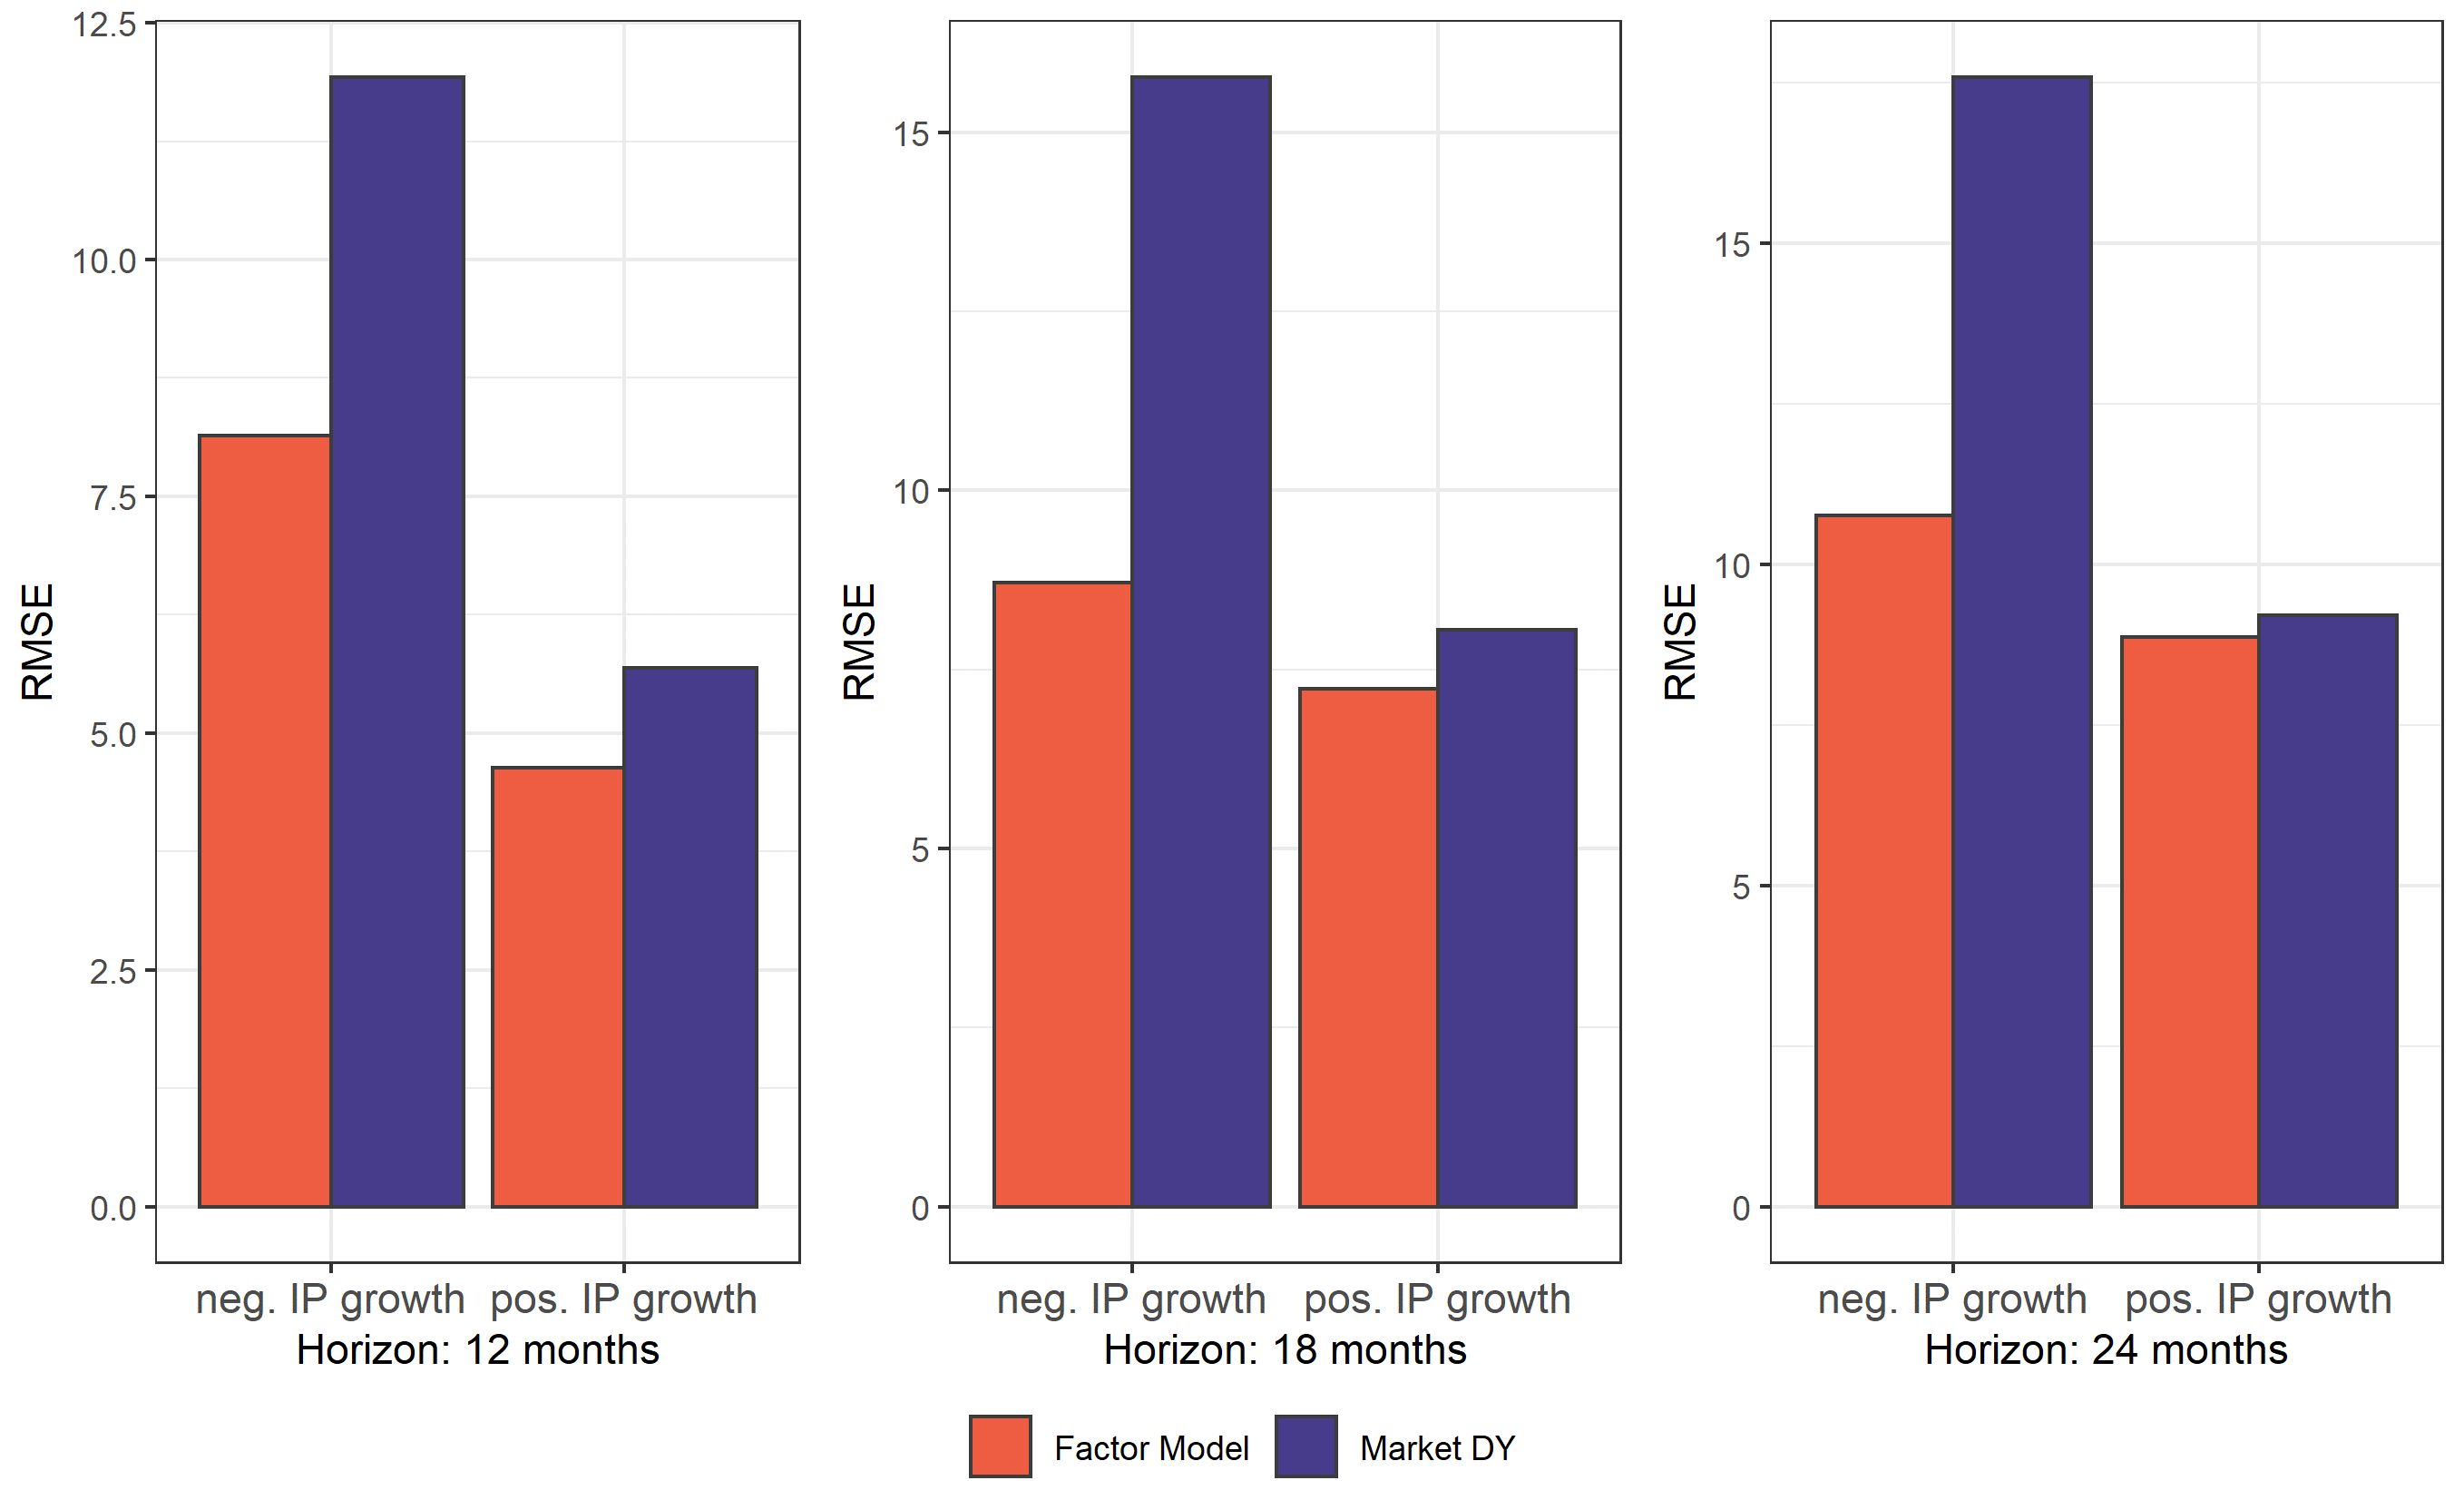
Note: On the graph are represented the Out-of-Sample RMSE of the factor model and of a univariate regressions relying on the aggregate DY. Note that we segment here our estimation according to the dates in which the forecasts are made. In other words, if we consider here a forecast horizon of 12 months, the “Negative IP growth” period refers to predictions made when the annual IP growth was negative (and not predictions made 12 months before the contraction in economic activity). The predicted variable is the IP growth over 12, 18 and 24 months.
Where do we stand at the moment in terms of recession risk? As of July 2022, the signals stemming from the different financial variables appear quite mixed. Rolling window regressions based on the term spread or on the market DY estimate that the 12-month ahead (annual) IP growth will amount to +1.1% and +2.7%, respectively. In contrast, our factor model appears more pessimistic, and forecasts a negative IP growth for next year: -2.2%.
This post written by Arthur Stalla-Bourdillon.
Uh oh. Somebody tell the Fed.
A nice contest is in place. Yield curve models don’t predict recession, but the dividend yield model does. Well, it does in the sense that a y/y decline in industrial production of any size rarely occurs outside recession. The 2014-2016 collapse in oil prices, which cut back sharply on drilling, seems to be the only exception:
https://fred.stlouisfed.org/graph/?g=TmYr
That exception suggests that focusing very heavily on energy sector data could be misleading.
I’m curious to know whether this dividend yield model and other recession models have disagreed in the past, and if so, which proved correct.
Not that you need to hear it trom me, but – Nice job.
Well of course the models disagree and the dividend yield model performed best. That’s in the text. Dope.
Still curious to see results over time.
A lot of news stories on yesterday’s Employment Report went nuts over the rise in one statistic – the unemployment rate. Alas this story started off that way:
https://www.msn.com/en-us/money/markets/yes-the-unemployment-rate-rose-here-s-why-that-s-good-news/ar-AA11p1ZQ?ocid=msedgdhp&pc=U531&cvid=849cef0ba9cc4ddf808dffebe3553e95
On Friday, the Bureau of Labor Statistics reported that the US unemployment rate had ticked up to 3.7% in August, an increase that surprised economists who had expected it to remain at July’s 3.5%. In a normal labor market, rising unemployment is a red flag. But even though today’s labor market is far from normal, last month’s rise in unemployment is actually an indication that the job market is normalizing, economists say.
Before you gag at this nonsense, the story got better:
One of the main reasons unemployment ticked higher in August was because more people were working or actively looking for work. Labor force participation rose three-tenths of a percentage point to 62.4%. While still a full percentage point lower than its pre-pandemic level in February 2020, the August jobs report offered the first glimmer of hope that there might be some relief ahead when it comes to the tight supply of workers.
One of the reasons? Dudes the employment to population ratio rose. The story eventually redeemed itself:
“In the current context where labor supply has been a key constraint… this rise in the labor force participation rate is actually very encouraging,” said Gregory Daco, chief economist at EY Parthenon. Increasing the supply of available workers is positive for the economy, even if it does increase the official jobless rate, US Secretary of Labor Marty Walsh said in an interview with CNN’s Jim Sciutto on Friday. It’s a sign that a lot more people are looking for work, which is a plus, given the extraordinary lengths to which employers are going to recruit and retain workers in a labor market with 11.2 million job openings. “If the unemployment rate goes up a little bit because of that, that’s okay. Because there are still many job openings in United States of America and we need to get more people back into work,” Walsh said, adding that he was “very encouraged” by the growth in labor force participation. Gary Burtless, labor economist at the Brookings Institution, echoed that sentiment. “That is something we’ve been worried about in this recovery — that too few people are looking for work and that’s causing a lot of labor market tightness,” he said.
Yes we need more people return to the job market so employment can keep rising without more supply constraints.
I tried to DL the paper but I got a thing that says “blocked plug in”. I think the problem is on my end and it’s gonna take me a couple days to fix it. File this under “personal problems” Does anyone remember the days when you could update software and you didn’t need 5 F’ing ID numbers to scratch the side of your nose??
Try this:
https://www.google.com/url?sa=t&source=web&rct=j&url=http://www.ssc.wisc.edu/~mchinn/CSBC_Equity_Prediction.pdf&ved=2ahUKEwiZ5r7vz_n5AhUOlGoFHWS-CroQFnoECBQQAQ&usg=AOvVaw0ayQ5azyNH18BFUmVLE8EC
That worked. Thank you very much. : )
Here is the link to the paper; there should no no problem opening it with a click:
https://www.nber.org/system/files/working_papers/w30305/w30305.pdf
The paper is excellent:
“Forecasting Real Activity using Cross-Sectoral Stock Market Information”
https://www.nber.org/system/files/working_papers/w30305/w30305.pdf
@ ltr
The problem was on my end, not the link. I appreciate your courtesy putting the link up anyway.
《It occurs mainly because equity variables reflect not only expectations of future economic activity, but also changes in investors’ discount rates.》
So, noisy psychology?