Here’s a picture of the 10yr-3mo term spread in Australia:
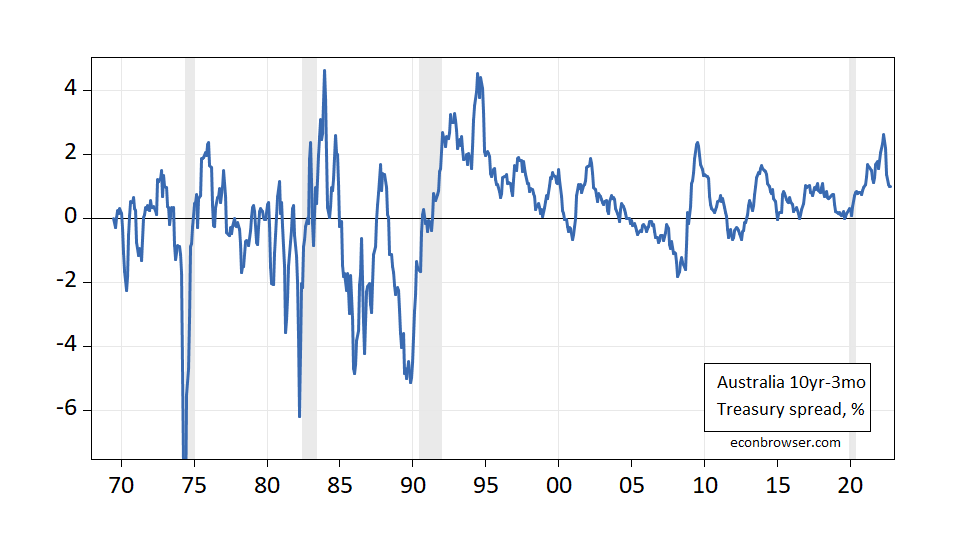
Figure 1: 10yr-3mo Australian Treasury spread, % (blue). ECRI peak-to-trough recession dates shaded gray. Source: OECD Main Economic Indicators, ECRI, and author’s calculations.
A probit model estimated over 1968-2021 yields (assumes no recession occurred as of December 2022):
Prob(recessiont+12) = -1.585 – 0.253 spreadt + ut+12
McFadden R2 = 0.13, NObs = 630. Coefficients significant at 5% msl bold. The spread is in percentage points.
While the spread is statistically significant, it would’ve completely missed the 2019-2020 recession. Indeed, this model would’ve missed the 2008 recession, even using as low as a 20% threshold. This result partly validates Not Trampis’s view; however, a rising 3 month Treasury rate doesn’t seem to predict recessions well either.
Note that Karunaratne (2002) does show the spread does predict growth and recessions well, for data through 1997. However, his definition of recession is based on the two-consecutive-quarter criterion, and so differs from the approach that uses a NBER or ECRI indicator.
The Australian yield curve as of today:
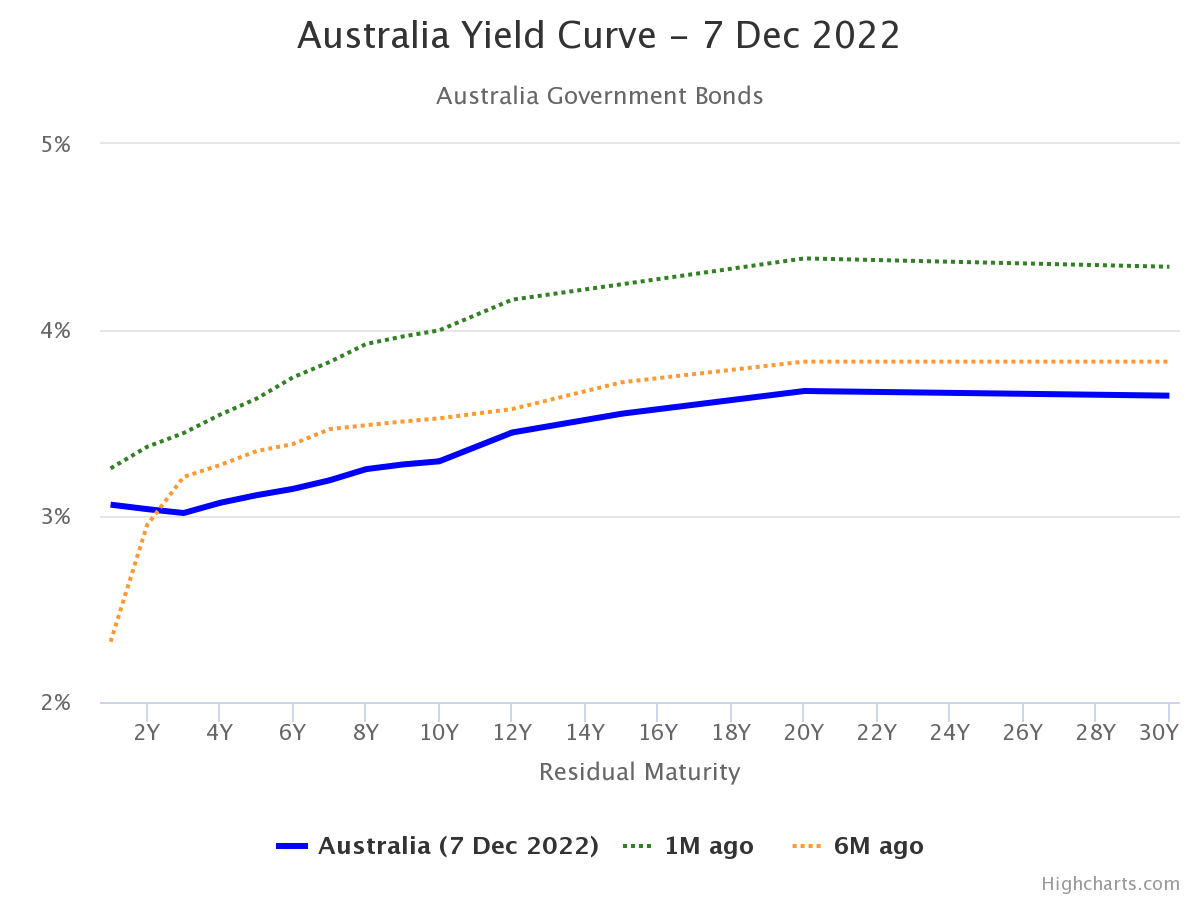
Source: worldgovernmentbonds.com.
What inversion there is is 3yr-2yr; the curve is indeed much flatter than 6 months ago.
I noted to our friend down under how the Reserve Bank of Australia has some nice reporting on government bond yields with the 2-year rate being 3.07% and the 10-year rate being 3.36%.
The Reserve Bank of New Zealand its 2-year rate is near 4.5% while its 10-year rate is 4%.
So the macroeconomic situations in the two nations in his area are a bit different.
https://fred.stlouisfed.org/graph/?g=XjCh
January 15, 2018
Short-term interest rates for Australia and New Zealand, 2007-2022
https://fred.stlouisfed.org/graph/?g=XjC8
January 30, 2018
Consumer Prices and Consumer Prices less food & energy for New Zealand and Australia, 2007-2022
(Percent change)
Hi,
Unfortunately, your Probit model is misspecified. It assumes the data are i.i.d. and this is not likely to be the case here. Hence, your standard errors are invalid and any inference you make is not appropriate.
Regards
AusEcon
https://news.cgtn.com/news/2022-12-06/Australian-central-bank-raises-rates-to-10-year-high-says-more-needed-1fxJvW40hz2/index.html
December 6, 2022
Australian central bank raises rates to 10-year high, says more needed
By Reuters
Australia’s central bank on Tuesday raised interest rates to a 10-year high and stuck with its projection that more hikes are needed, a stance taken as slightly hawkish by markets that were looking for signs of a pause in the near term.
Wrapping up its last policy meeting this year, the Reserve Bank of Australia (RBA) lifted its cash rate by 25 basis points to 3.1 percent, the eighth hike in as many months and bringing its rate increases to a hefty 300 basis points since May.
A Reuters poll of 30 economists had unanimously expected the RBA to opt for another modest 25 basis point hike, its third in a row after a succession of half-point hikes.
In a statement largely similar to others in recent months, Governor Philip Lowe said the central bank’s board expects to increase interest rates further over the period ahead, although it is not on a pre-set course.
“The size and timing of future interest rate increases will continue to be determined by the incoming data and the Board’s assessment of the outlook for inflation and the labor market.” …
This 10-year high stuff needs to be put in context:
Interest Rates: 3-Month or 90-Day Rates and Yields: Interbank Rates: Total for Australia
https://fred.stlouisfed.org/series/IR3TIB01AUM156N
Interbank rates for Australia were higher over much of this period than US rates until recently. But they were incredibly low for a while. Yea – they have increased recently but not as much as US rates.
Haha. A pretty great post with semi-complicated math, in response to a short and rather irreverent comment. This speaks highly of Menzie as a Teacher. Great post.
Great post. Love this blog.
Our host has let us know about this wonderful source of information:
http://www.worldgovernmentbonds.com/country/australia/
The Australia 10Y Government Bond has a 3.294% yield.
10 Years vs 2 Years bond spread is 25.7 bp.
If one plays around with this webcite, one can find which nations have inverted yield curves. They list New Zealand as having an inverted yield curve which is confirmed by the government bond yields reported by the Reserve Bank of New Zealand.
About Japan and relative interest rates, Japan has at least near recession since the middle to late 1990s. Paul Krugman has written frequently about Japan being in a “liquidity trap,” a condition that was not supposed to be encountered in the 1990s and beyond. Also, Japan has had a peculiar way of claiming to adopt expansionary economic policy only as Krugman and Adam Posen have written to be pretending. The peculiar-repetitive nature of Japanese economic policy, the liquidity trap, likely have made economic prediction about the economy decidedly difficult.
Adding a word:
Japan has [been] at least near recession since the middle to late 1990s….
Were you expressing some kind of not very well veiled racism here?? It’s kind of nauseating when a country smaller than you in population and geographic size wields more economic power than your home country, aye??
ltr,
This was why I was expecting the models using yield term spreads not to be able to forecast recessions in Japan, when in fact it turns out that they predict better in Japan than in other high income nations.
http://krugman.blogs.nytimes.com/2008/12/01/people-should-be-reading-adam-posen/
December 1, 2008
People Should be Reading Adam Posen
By Paul Krugman
Everyone’s looking back to the 1930s for policy guidance — and that’s a good thing. But we don’t have to go back that far to see how fiscal policy works in a liquidity trap; Japan was there only a little while ago. And Adam Posen’s book, * especially on, “Fiscal Policy Works When It Is Tried,” is must reading right now.
* http://www.petersoninstitute.org/publications/chapters_preview/35/2iie2628.pdf
September, 1998
Restoring Japan’s Economic Growth
By Adam S. Posen
http://www.petersoninstitute.org/publications/chapters_preview/35/2iie2628.pdf
September, 1998
Restoring Japan’s Economic Growth
By Adam S. Posen
Fiscal Policy Works When It Is Tried
If the current Japanese stagnation is indeed the result of insufficient aggregate demand, what should be the policy response? Fiscal stimulus would appear to be called for, especially in a period following extended over-investment that has rendered monetary policy extremely weak. Yet the statement is often made that fiscal policy has already been tried and failed in Japan. Claims are made of variously 65 to 75 trillion yen spent in total stimulus efforts since 1991, even before the currently announced package. Both the Japanese experience of the late 1970s of public spending as a ”locomotive” to little-lasting domestic benefit, and the worldwide praise for government austerity in the 1990s, have predisposed many observers to dismissing deficit spending as ineffective, if not wasteful. Could there really have been this much stimulus effort having so little effect?
The reality of Japanese fiscal policy in the 1990s is less mysterious and, ultimately, more disappointing. The actual amount injected into the economy by the Japanese government—through either public spending or tax reductions—was 23 trillion yen, about a third of the total amount announced. This limited quantity of total fiscal stimulus was disbursed in insufficiently sized and inefficiently administered doses, with the exception of the 1995 stimulus package. That package did result in solid growth in 1996, demonstrating that fiscal policy does work when it is tried. As on earlier occasions in the 1990s, however, the positive response to fiscal stimulus was undercut by fiscal contraction in 1996 and 1997. On net, the Japanese fiscal stance in the 1990s was barely expansionary, and it is the net injection of stimulus into the economy that determines the minimum result. In fact, the repeated reversals of fiscal direction and revelations of gaps between announced and implemented policies make even this near-zero net injection an overstatement….
http://krugman.blogs.nytimes.com/2009/02/25/turning-japanese/
February 25, 2009
Turning Japanese
By Paul Krugman
Adam Posen of the Peterson Institute for International Economics is the go-to guy for understanding Japan’s lost decade. From prepared testimony for a Joint Economic Committee hearing tomorrow:
“The guarantees that the US government has already extended to the banks in the last year, and the insufficient (though large) capital injections without government control or adequate conditionality also already given under the Troubled Asset Relief Program, closely mimic those given by the Japanese government in the mid-1990s to keep their major banks open without having to recognize specific failures and losses….
http://web.mit.edu/krugman/www/trioshrt.html
December, 1999
Thinking About the Liquidity Trap
By Paul Krugman
1. The liquidity trap: an IS-LM view
http://web.mit.edu/krugman/www/jpage.html
December, 1999
A Special Page on Japan
By Paul Krugman
https://www.brookings.edu/bpea-articles/its-baaack-japans-slump-and-the-return-of-the-liquidity-trap/
June, 1998
It’s Baaack! Japan’s Slump and the Return of the Liquidity Trap
By Paul Krugman
https://krugman.blogs.nytimes.com/2014/11/04/japan-on-the-brink/
November 4, 2014
Japan on the Brink
By Paul Krugman
http://web.mit.edu/krugman/www/jpage.html
December, 1999
A Special Page on Japan
By Paul Krugman
The state of Japan is a scandal, an outrage, a reproach. It is not, at least so far, a human disaster like Indonesia or Brazil. But Japan’s economic malaise is uniquely gratuitous. Sixty years after Keynes, a great nation – a country with a stable and effective government, a massive net creditor, subject to none of the constraints that lesser economies face – is operating far below its productive capacity, simply because its consumers and investors do not spend enough. That should not happen; in allowing it to happen, and to continue year after year, Japan’s economic officials have subtracted value from their nation and the world as a whole on a truly heroic scale.
The fault does not, however, lie merely with those officials. Japan has also been badly served by the economics profession, both in Japan and outside. The great majority of economists – including those who specialize in issues of economic stabilization and growth – seem oddly uninterested in Japan’s plight, as if the failure of conventional macroeconomic policy in the world’s second largest economy were a subject of merely parochial interest, with no lessons for the rest of us….
Sorry about leaving off my name on the comment; I do not know how this could have happened.
“The Special Page on Japan,” lists a remarkable series of writings on the economics of Japan by Paul Krugman. All the essays are linked and open.
https://fred.stlouisfed.org/graph/?g=UmqN
August 4, 2014
Real per capita Gross Domestic Product for China and Japan, 1992-2021
(Percent change)
https://fred.stlouisfed.org/graph/?g=UmqR
August 4, 2014
Real per capita Gross Domestic Product for China and Japan, 1992-2021
(Indexed to 1992)
https://fred.stlouisfed.org/graph/?g=XjoJ
January 30, 2018
Population Ages 15 to 64 for China, Germany, India, Japan and United States, 1992-2021
(Percent)
Funny* how ltr manipulates real GDP per capita in strange ways, but avoids presenting the unmanipulated series. Japan’s real GDP per capita is over three times that of China:
https://fred.stlouisfed.org/graph/?g=XjLF
Probably because China has devoted so many resources to enslaving Uyghers and stripping away freedom from Tibet and Hong Kong.
*”Funny” as in “funny business” or “funny money” or “funny how you try to hide the truth”. Not to mention disrespectful to readers and racist toward Japan.
I really love this comment. Sometimes I feel like you’re my brother.
Uh oh, Macroduck. Does this mean that your father’s family does not like your mother also?
New Deal Democrat has argued that income tax withholding data indicate weak employment growth in recent months, in agreement with the household employment series, and contradicting the payroll and other establishment series. That seems worth a peak at the data. Problem is, the data don’t make themselves handy to lazy people.
Income taxes withheld amount to 59% of personal income taxes as of 2021:
https://fred.stlouisfed.org/graph/?g=XjDr
Though that share has fallen overtime, the two series track pretty closely, year to year. This matters to me right now because I’m unable to find FRED data on income taxes withheld on anything but an annual basis, with nothing for 2022. I have found a monthly series for total personal taxes, so I’m going to use that to look at this year’s data; FRED is necessary if we are all going to play along.
Changes in income taxes withheld do track changes in employment pretty well, but there have been exceptions, notably 1964 and 2018:
https://fred.stlouisfed.org/graph/?g=XjCo
The same is true for personal taxes, with 1964 the only notable exception:
https://fred.stlouisfed.org/graph/?g=XjEL
So, let’s take a look at personal taxes and employment on a monthly basis to see what’s happening this year. This is monthly % changes:
https://fred.stlouisfed.org/graph/?g=XjFG
Personal taxes showing an uninterrupted rise through October, the last month for which we have data. Here are y/y % changes:
https://fred.stlouisfed.org/graph/?g=XjFG
Personal taxes were up 18.8% y/y in October. So the broad personal taxes series provides suggestive evidence of continued employment growth. It is not, however, direct evidence. That’s pretty much where we were in comparing payroll and household employment before I went to all this trouble.
If there’s a difference in implication between personal income tax withheld and personal taxes, maybe a policy change or some technical issue would explain it. Changes in income tax rates were coincident with the 1964 and 2018 misses between income taxes withheld and employment, but many other tax-rate changes did not lead to misses. I’m not aware of any tax policy changes that would mess up withholding data, but that doesn’t mean it didn’t happen.
Anybody have a handy source for income tax withholding data? I don’t do data entry.
https://www.worldometers.info/coronavirus/
December 6, 2022
Coronavirus
United States
Cases ( 100,962,660)
Deaths ( 1,107,794)
Deaths per million ( 3,309)
China
Cases ( 345,529)
Deaths ( 5,235)
Deaths per million ( 3.6)
https://www.worldometers.info/coronavirus/
December 6, 2022
Coronavirus
New York
Cases ( 6,592,452)
Deaths ( 74,391)
Deaths per million ( 3,824)
China
Cases ( 345,529)
Deaths ( 5,235)
Deaths per million ( 3.6)
More noise?
https://fred.stlouisfed.org/graph/?g=SlgT
August 4, 2014
Real per capita Gross Domestic Product for China and Japan, 1977-2021
(Percent change)
https://fred.stlouisfed.org/graph/?g=SlgV
August 4, 2014
Real per capita Gross Domestic Product for China and Japan, 1977-2021
(Indexed to 1977)
https://fred.stlouisfed.org/graph/?g=RqcN
August 4, 2014
Real per capita Gross Domestic Product for China, United States, India, Japan and Germany, 1977-2021
(Percent change)
https://fred.stlouisfed.org/graph/?g=RqcV
August 4, 2014
Real per capita Gross Domestic Product for China, United States, India, Japan and Germany, 1977-2021
(Indexed to 1977)