Quick links to a few items I found interesting.
Oil exports: Jim Brown lays out the case against allowing exports of U.S. crude oil. I reviewed the case in favor here.
VA scandal: Political Calculations has some interesting evidence on the role of budget decisions in the recent problems encountered by the Veterans Health Administration. See the Washington Post for a summary of some of the problems and the Wall Street Journal for the latest disturbing revelation.
Piketty, Piketty: I’ve explained [1], [2] why the economic theory underlying Thomas Piketty’s Capital in the Twenty-First Century is deeply flawed, with Per Krusell and Tony Smith [1], [2] making essentially the same point. Useful third-party summaries on this issue include Free Exchange and Alex Tabarrok. Brad DeLong [1], [2], continues to vigorously criticize Krusell and Smith without even mentioning or addressing the actual issue raised in their analysis. See also Rick Stryker [1], [2] for elucidation.
Labor force particpation: The always-indispensable Bill McBride makes some insightful observations about trends in labor force participation rates, noting for example that “a researcher looking at this trend in the year 2000 might have predicted the 40 to 44 year old men participation rate would about the level as today.”
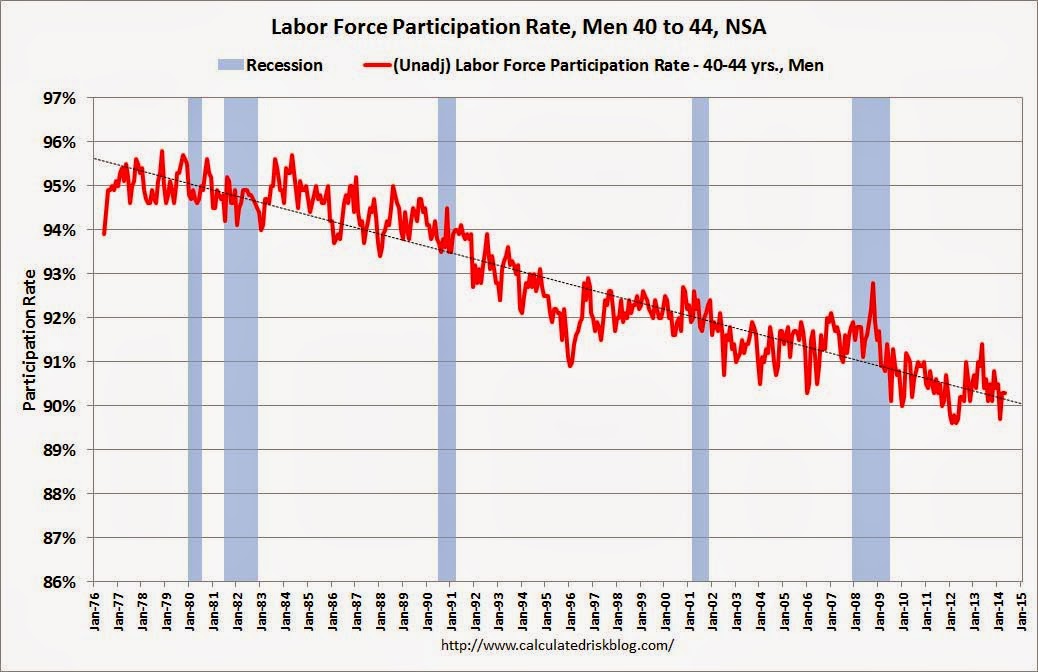
Source: Calculated Risk.
Man oh man, political calculation must really have a low opinion of his readers.
Take his data on compensation and medical expenditures over 5 years he makes so much of.
Labor compensation rises from $146 to $188– that is a 5.7% average rate of growth.
Over the same period patient care expenditure rose rose from $6,630 to $9,840 or a 9.5% average rate of growth.
So despite his trying to imply that compensation rose so fast it actually rose at barely half the rate of spending on patient care.
OK, i went back and read the entire thing and Political Calculation adjusted for productivity.
In education quality is so highly correlated with class size that lowering the class size is consider a quality improvement even though it reduces reported productivity.
Can you make the claim that lowering the ratio of health care employee to patients is not also a big improvement in quality of care?
I doubt it, so I do not think that his claiming that an improvement in the quality of health care is a bad thing and is a waste of tax payer money.
The labor force participation rate of men has been falling, since at least the 1950s:
http://research.stlouisfed.org/fred2/series/LNS11300001
The labor force participation rate of women has been rising, since at least the 1940s, and began to decline after 2000:
http://research.stlouisfed.org/fred2/series/LNS11300002
Lousy day for oil:
I don’t know what’s going on in Iraq, but I can tell you the Obama administration is way behind on the ball. If Baghdad falls, could we see a repeat of Libya? I wouldn’t be surprised, except that Iraq last month pumped at twice the rate of Libya at its peak. As Iraqi oil output goes, so goes the global economy.
US implied oil production was revised down substantially today. Not clear on the details.
Eric Cantor was blown out in a primary. As someone with deep reservations about amnesty for illegals, I can understand conservative voters’ sentiment. But as I assess the risks in Ukraine, the South China Sea, Iran and now Iraq, coupled with a stunningly passive administration in DC, chaos in the Republican Party, and disarray and isolationism in Europe…well, we have entered a very high risk environment.
Steven,
There may be a silver lining of a sort for the Iraqi Kurds: the government of Iraq could become less and less able to obstruct increase of Kurdish autonomy. What ISIS will do will have great effect on how things play out in the north of Iraq but at least the Kurds and the ISIS are both Sunni.
Kurds have their own oil and their own pipeline through Turkey for exporting it, and it’s functioning while Iraq’s northern export pipeline has been closed for weeks because of insurgent attacks. An ISIS focus on the Shiite government of Iraq gives time the Kurds could use to strengthen their own position in the north of the country. I’d love to know how this possibility is being viewed in policy circles in Turkey and Iran, with their own Kurdish populations. Well, truth to tell, I bet I do know, and so do you.
Steven,
Some scenarios to ponder . . . .
An interesting article on Saudi Arabia:
http://www.bbc.co.uk/mediacentre/worldnews/2014/our-world-saudi-secret-uprising
I think that Saudi Arabia can accurately be described as “metastable,” in that it appears to be stable, but it is inherently unstable. A good book on Saudi Arabia is “On Saudi Arabia.”
http://www.amazon.com/On-Saudi-Arabia-Religion-Lines/dp/0307473287
In any case, in 2010 Syria + Libya produced a combined 2.2 mbpd (total petroleum liquids + other liquids, EIA). The EIA shows that their 2013 fourth quarter
combined production was down to 0.4 mbpd, a decline of 82% from 2010.
In 2013, according to the EIA, combined production from Iraq + Saudi Arabia was 14.7 mbpd. In 2012, their combined net exports were 10.9 mbpd (2013 net export data not yet available).
If Iraq and Saudi Arabia were emulate the civil war related production declines that we have seen in Syria and Libya, their combined production would fall from 14.7 mbpd to about 3 mbpd, presumably eliminating their net exports.
In 2012, Global Net Exports of oil (GNE*) were 44 mbpd, and Available Net Exports (ANE, the volume of GNE available to importers other than China & India)
were 35 mbpd, versus 46 mbpd and 41 mbpd respectively in 2005.
Based on recent consumption trends, I suspect that the bulk of any disruptions to the GNE supply would be disproportionately absorbed by net importers other
than China & India:
http://i1095.photobucket.com/albums/i475/westexas/Slide14_zpsb2fe0f1a.jpg
*Combined net exports from (2005) Top 33 net oil exporters, total petroleum liquids + other liquids
Thanks, Jeffrey.
I’ve written about Saudi before, with Manifa and Red Sea exploration suggesting that onshore opportunities for the Saudis appear constrained. I think the balance of evidence is moving towards downside risks for Saudi production.
From the Kingdom’s perspective, the issue will be the same as from Exxon’s: that costs will be rising faster than revenues. In Saudi, if the Red Sea is the metric of E&P costs, then costs will be rising with dramatic speed at the marginal barrel level. Thus, the Saudi government may find itself with solid, but diminishing net revenues year after year. I would guess that sometime after 2020, the ruling family will run out of dry powder, at least enough dry powder to buy off everyone in AOPEC.
It appears that the ruling family is attempting to offset such declines with massive increases in downstream investment. I have very marked reservations about this strategy, and I think it will fail. The family should be looking to increase their political legitimacy, on the one hand, and plan more explicitly for gradual political change, on the other. Not easy to do, though (especially without a framework for an FAA).
As for China, I think policy there is very poor. On the one hand, I sympathize with China’s views on territorial splits in the South China Sea. Why should China accept the Spratly, Paracel, and Senkaku Islands as establishing international boundaries just because of the ‘century of humiliation’? In China’s place, I wouldn’t. Nevertheless, the militarization of this dispute has very real and potential costs. First, it is increasingly placing a price on China’s prosperity. It makes a more prosperous China a threat, not an opportunity, for the US. It makes the Chinese working and studying in the US a threat to US prosperity and security. And hardening attitudes will increasingly extend to public opinion, and not just the impotent Administration. China is spending its brand equity in a hurry.
And yet China may need political goodwill in the Arabian Gulf. Whose Iraqi oil exports are at risk? If Iran starts a nuclear war with, say, Saudi Arabia, whose oil will be irradiated? China has real and growing interests in the region, even as the US slips into a stupor. Nevertheless, without US cooperation, or at least acquiescence, China faces very real risks in the Persian Gulf. What attitude does China expect, not only from the US Administration, but even more importantly, from the US public? Will the US public tolerate a more active military and political presence by China in the Arabian Gulf? Or will they see it as an extension of aggressive policies in the South China Sea? Will the US be interested in propping up the Chinese economy, or wanting it to crater? China’s actions in the South China Sea suggest, alas, the latter: a poor China is a safer world for the US. I think that is a tragedy for all of us.
I can understand Chinese frustrations in the South China Sea, and I feel the US is completely clueless in the matter. Nevertheless, if I look at the big picture, Chinese actions are apt to backfire, with dire potential consequences not only for China, but for the rest of us as well.
However, let me not just criticize, but suggest alternative policy:
China should revert to a Money and Time, rather than Prompt Power, strategy. It should be prepared to purchase, not conquer, over time. The US, for its part, should have a Respect and Money strategy. Respect, for China’s power and its changed conditions over the last century. If China cannot find satisfaction by other means, it will do so by force. Money, because the US may have to write some hefty checks. Vietnam, the Philippines and Japan need to understand that the above-mentioned islands will not stand as international boundaries. A larger portion of the China Sea will have to be internationalized, and the US and China may have to write some big checks to pay off our allies. That’s the way it goes. Still much cheaper–in blood, treasure and reputation–than a pointless war.
Steven,
Excellent analysis (as usual).
Regarding Iraq, an unnamed US official was quoted on ABC this morning as saying that after reviewing the latest intelligence data on Iraq, “It makes one want to kill oneself.”
I’m reminded of the fall of Saigon in 1975, a couple of years after the US finally gave up and pulled out of Vietnam:
http://en.wikipedia.org/wiki/Fall_of_Saigon
Iran’s special forces rush in to help floundering ally
http://www.thetimes.co.uk/tto/news/world/middleeast/iraq/article4116273.ece
The US is much less reliant on oil imports than is China, and the US’ oil consumption is rather less industrial than is that of China: more than 50% of US oil consumption is personal passenger transportation. Does anyone have data on the comparable number for China?
The US could and should accelerate it’s transition away from oil, and eliminate it’s oil imports. The US would still be affected by oil shocks, but the whole world would be better off: the supply demand balance would improve, and the world economy would be less fragile.
Nick –
I think the transport number for China is something like 30%, but rising fast.
The max efficiency gain you’ll find in the data is 2.8%. That appears to be the fastest sustainable pace for the US outside a recession. For the world as a whole, that number looks something like 2.2% per annum.
S.
2.8% annual improvement in the oil:GDP ratio is highly unrealistic. The US reduced it’s ratio by an average of 2.6% per year from 1978 to 2013, without even trying. That rate rose to 3.5% from 2005-2008 because oil prices rose, but that was early in the transition; oil prices are still highly affordable; and much lower than they should be (if they included all indirect costs): consumers have very little incentive towards efficiency.
Oil prices had been low for decades before 2005 – it took more than 5 years for car companies to respond with plug-in cars. Yet the transition hasn’t sped up – why? Could it have more to do with Fox News bashing hybrids and EVs, and less to do with anything real?
Oil is still highly affordable: fuel costs represent less than the cost of depreciation for the average new car buyer. Buyers are choosing vehicles that use 10x as much fuel as the most efficient hybrid, and that cost twice as much as the least expensive (and more efficient) alternative.
Oil is priced much less than it should be: the indirect costs of pollution and supply insecurity (paid in the from of $trillions in recession losses as well as $trillions in military costs) represent a very large subsidy for oil consumers. If oil were priced properly (at least $2, and probably $4 more) consumers would have a much greater incentive – they’d actually pay attention to MPG(!).
We can’t ignore indirect, external costs, right??
2.8% as a cap is…risible. Consumers were incentivized with realistic prices, they could reduce consumption by 50% in a week with a Prius. 90%, if they bought a Volt. 100% overnight by carpooling, at no cost (don’t say that a population that mostly owns smartphones can’t carpool – look at Uber).
Incidentally, as most of the mainstream media seems to be talking about the US becoming a major net oil exporter, based on the most recent four week running average data, the US is reliant on net crude oil imports for 45% (7.1 mbpd) of the crude oil processed daily in US refineries.
I read with amusement Frank Diebold’s assessment of Piketty’s book as “neo-Marxist drivel.” Unfortunately, Diebold did not elaborate. Since the neo-Marxist aspect of Piketty’s book has not been discussed much, especially the relationship between Piketty’s “second law of capitalism” and Marx’s principle of infinite accumulation, I thought I’d fill in some details.
In “Capital in the Twenty-First Century,” Piketty advances the theory that capitalism is inherently unstable. Piketty identifies his theory with Marx’s principle of infinite accumulation. In Marx’s view, low economic growth tends to cause capital to be accumulated indefinitely, which then causes an “inegalitarian spiral.” As capital accumulates, either the return on capital drops, and capitalists engage in violent conflict with each other. Or the return on capital does not drop, and the share of national income that goes to returns on capital becomes increasingly large, producing poverty and degradation among the workers that ultimately results in political revolution. In either case, capitalism ends badly.
In the section of the book “Back to Marx and the Falling Rate of Profit,” Piketty explicitly relates his “second law” to Marx’s view, noting that as the rate of economic growth becomes small or zero, the “second law” implies that the capital to net income ratio will become unbounded, consistent with Marx’s principle of infinite accumulation. In this section of the book, Piketty claims that when the rate of economic growth is low or zero, capitalists will continue to save, either because their standard of living is already sufficient, or to increase their own power, which leads to economic and political instability. As Piketty puts it:
“Otherwise, capitalists really do dig their own graves: either they tear each other apart in a desperate attempt to combat the falling rate of profit (for instance by war over the best colonial investments as Germany and France did in the Moroccan crises of 1905 and 1911), or they force labor to accept a smaller and smaller share of national income, which ultimately leads to a proletarian revolution and general expropriation. In any event, capitalism is undermined by its internal contradictions.”
Thus, the second law is really a theory of the instability of capitalism. Piketty believes that Marx’s dire vision of the end of capitalism was not experienced only because technical progress has kept economic growth sufficiently above zero. But that doesn’t mean that there is no problem in Piketty’s view. Piketty begins part 4 of the book with the question: “Can we imagine a twenty-first century in which capitalism will be transcended in a more peaceful and more lasting way, or must we simply await the next crisis or the next war (this time truly global)?” In Piketty’s mind, the “second law” implies that capitalism will tend to produce excess concentrations of capital, which means the course of economic history will be punctuated by war and crisis. Piketty’s solution is to call for a global tax on capital to regulate capitalism.
The instability of capitalism is produced by the form of the mathematical relationship in his “second law,” which states that the ratio of capital to net income is inversely related to the growth rate of the economy, thereby producing a strong relationship between the growth rate and the rate of capital accumulation. The form of the mathematical relationship implies that as the growth rate of the economy goes to zero, the capital to net income ratio goes to infinity. Piketty argues that the mathematical relationship implied by the “second law” is a general consequence of economic theory. In his paper Capital is Back, Piketty notes that his model and the text book model both imply his second law, saying, “Both formulations are equivalent and require the same data.” Piketty goes on to note in section 3.3 that “It is worth stressing that the steady-state formula B = s/g is a pure accounting equation. By definition, it holds in the steady-state of any micro-founded model, independently of the exact nature of saving motives.” Piketty thus believes the formula K/netY = s(net)/g is a “law” since it holds in the steady state in general in microeconomic models.
However, Piketty’s conceptual mistake is to assume that if a “second law” relationship holds in a particular model, that model must necessarily imply a Marxist principle of infinite accumulation as the growth rate of the economy goes to zero. In the difference equation model that Piketty uses in his technical appendix to explain the second law, Marx’s principle of infinite accumulation does indeed hold as the growth rate of the economy goes to zero. But in the textbook model, the “second law” does not imply the principle of infinite accumulation, since as the growth rate of the economy goes to zero in that model the net saving rate also goes to zero. Piketty’s “law” is not a law at all but rather nothing more than a bizarre assumption.
The Hamilton/Krusell/Smith critique showed that the economic model underlying Piketty’s version of the “second law” is nonsense. Therefore, Piketty’s neo-Marxist theory of the instability of capitalism is nonsense and so the justification for Piketty’s global capital tax (and other taxes) evaporates.
Brilliant analysis, Rick. I’m amazed at the effort you put into this stuff.
Nice exposition from Slugs, too.
Thanks very much Steven for your kind words.
Prof.
Since about the year 2000, women 40-44 show a similar decline. Bill Mcbride in an earlier post postulated 5 possible reasons about the male side, quoted below in italics. I believe in light of reduced participation of both sexes now, his reasons should be thought about in terms of the general population.
<a "href =http://www.calculatedriskblog.com/2014/04/possible-reasons-for-decline-in-prime.html"
“1) Cultural changes. As a larger percentage of women entered the labor force (pink line in first graph), this allowed men some more options, such as: a) take some time off between jobs, b) go back to school to improve skills or be able to change careers, c) be a “Mr. Mom”. There used to be stigma for men not working – or ego problems with women being the prime “bread winner” – but over time that stigma has lessened. Even though the percentage of prime-working age women in the labor force is now declining slowly, I think the cultural changes are still the main driver for the decline in the participation rate for men.
Certainly a strong reason during the fast upswing in women participation in the past. But shouldn’t consideration of possible crowding out factor being considered for that life choice in those times, but no longer so strong in the last decade.
“2) Demographics. It is possible that the changing ethnicity of the prime working-age population is contributing to the decline in the participation rate for prime-working age men. This is unclear from the top level data (We’d need data by ethnicity, sex, and age group).
3) Underground Economy. It is also possible that the underground economy (cash economy) is growing, and some of these men are actually working “off the books” for cash.”
The most difficult to measure, but I believe the prime factor.
4) Increased benefits for disability and illness. Note: Everyone opposes fraud, but that is probably only a small problem. Overall most Americans would consider it good news that people with serious illnesses or disabilities receive benefits – even if that has contributed a little to the decline in the participation rate.
5) Inheritance and lower estate taxes. Although the impact has probably been small, the decline in the participation rate for working-age men has tracked the decline in the inheritance tax over the last 50 years. I’m guessing there are more working-age men not working today because they are living off their inheritance.”
Wrong tact to look at inheritance. The better measure is the amount of inheritance (more people in the position to leave higher amounts) available and transferred. I suspect inheritance laws have had little effect on the amounts as the amounts are derived more from a richer society in general.
Jim –
Could you comment on stagnation and growth rates? A couple of years back, the economic narrative, basically the RR story–stated that recoveries after financial crises are protracted (even though growth averaged some 7% in the decade after 1932). So, when does RR slow recovery period end? Has it ended? Some argue that it has, and certainly, the economy is levering up again.
Therefore, should we expect a recovery of more traditional growth rates? The New York Times notes that “the Labor Department concluded late last year in a report that declared slower growth “the new normal” for the American economy.” Are we now saying it wasn’t the financial crises, after all? That it was demographics? But if it was demographics, why have institutional forecasts (IMF, OECD, CBO, etc.) consistently over-predicted economic growth? Aren’t these institutions able to forecast demographic trends?
So where is the narrative now? Why did we have low growth rates in the recovery? Do they explain the current rate of growth? If not, what does? Should we expect growth to return to traditional rates? Why or why not?
Thanks, S.
http://www.nytimes.com/2014/06/12/business/economy/us-economic-recovery-looks-distant-as-growth-lingers.html?hpw&rref=business
Bill McBride points out that the downtrend of the LFPR of a prime age cohort of men has been in place far longer than is generally recognized. He chooses “men only to simplify.” Then goes on to make the point that there’s more going on with this cohort than “economic weakness.” In an earlier post he tackles the “why” – listing 5 reasons. But by “simplifying” and looking only at men, something is lost. Readers would benefit from seeing both male and female 40-44 cohorts on the same graph. Vastly different trajectories! When in 1978 the LFPR of men peaked at 95.8, women’s was 62.7. While men’s continued trending down to 92.6 by 1997, women’s rose to their peak of 80.1.
By Dec 2007, the decade-long decline for women was well established as a new trend. The extrapolation of that trend since 2007 has proven to be equally as accurate as that of men. This gives weight to McBride’s argument that there’s more going on than economic weakness. At the same time it raises two questions. Why the long downtrend for prime age men? And what was the predominate force that turned the female trend from up to down? This is the sweet spot of the distribution. So understanding what’s going on with these representative prime age cohorts of males and females may be a Rosetta stone. Almost surely there are two separate main causes here – one for men, one for women. One stretching back some decades. The other come into play on or around 1997.
I get that, JBH. But the IMF’s April 2010 world GDP forecast for the year 2013 is 1.5 percentage points–50%–too high. Are you telling me that the IMF, CBO, OECD and Fed don’t know how to do basic demographic forecasting and incorporate that into their analyses? It doesn’t get much more predictable than demographics.
But I feel that the narrative keeps shifting. First it’s R&R. Financial crisis, yada yada. So is that explanation true, or still true? When did it stop being true? What is the related litmus test(s)?
Then we have Sadowski and Sumner saying, Oh, the ECB raised interest rates by 0.5% (!)–can you imagine!–and it plunged the Euro zone into an 18 month recession. Really? How robust is this ‘hair trigger’ theory? Does a half percent move always crush economies into a long, long recession? Or only at some fulcrum point? What is that fulcrum point? How do we know it when it happens? Are we there today, or is now past?
And then we have Menzie with something-ary fiscal contraction. So are we still contracting? (I think so.) And yet Lagarde has had to fall on her sword wrt to the UK economy. So how’s that explanation holding up? When we stop contracting (and we will somewhere along the line), will growth rebound? Is that the theory? Why then are guys like Larry Summers so negative on long term growth?
And now we now seem to be moving on to demographics. People are saying, oh gosh, look at those boomers retiring. OK, so we didn’t know that four years ago? This is a surprise? Once again we’re trotting out an explanation ex-post and saying, Oh, gee, see, we should have seen it all along. Damn tootin’! If you can’t forecast demographics, then you’re absolutely, totally worthless as an analyst. Everything else is harder to forecast than that.
So, I see these different memes appearing and then slithering away to explain current growth rates. I see very little rigor in analyzing them one by one, and then making real forecasts other than that Larry Summers feels negative about the future.
So, we have had three or four different explanations for weak economic growth, both in the US and globally:
– financial and fiscal crisis
– fiscal contraction
– too tight monetary policy
– demographics
How are these hypotheses holding up?
Steven,
My post was meant to be standalone, not a reply to yours. Sorry for the confusion. But while I’m at it, let me respond to your post above mine.
RR published their findings before 2008. As this recovery is the poorest on record – aided by historic monetary and fiscal stimulus to boot – the post-crisis weight of evidence is even more on their side. Predictive ability (or its lack) is the way scientific method confirms a theory (or eventually erodes its validity). The heart of RR’s theory is that for financial crisis episodes where gross debt as a percent of GDP rises above 90%, subsequent GDP growth will be degraded. Debt held by the public as a percent of GDP in 1929 was a modest 14.9%, rising to 44.0% in 1934, then falling to 42.8% by 1938. The ’29 to ’38 average was 34%. Using data from Historical Statistics since Colonial Times, the slender debt holdings of the government put the average gross debt ratio around 37%. Federal debt did not constrain growth during the Depression. In fact, it was below the optimal level consistent with optimal GDP growth.
The gross debt burden today is above 90%. When, you ask, does the RR slow recovery end. Answer, not until the debt ratio has gotten back to optimal. It has a long way to fall. RR do not address what optimal is. In fact, nowhere in the literature is there such an estimate. Keynes was mum on debt. My own research puts it somewhere in RR’s middle bucket – 30% to 60%. In the CBO’s 2013 Long-Term Budget Outlook, the ratio of debt held by the public falls trivially from 73% to 68% by 2018, and then rises without limit. The US is caught in a debt trap.
The Labor Department is not a reliable source of GDP forecasts. You further ask: “Are we now saying it wasn’t the financial crises, after all? That it was demographics? But if it was demographics, why have institutional forecasts (IMF, OECD, CBO, etc.) consistently over-predicted economic growth? Aren’t these institutions able to forecast demographic trends?” Here you conflate a number of things. While your back-to-back questions are not exactly a logical syllogism, they are effectively a string of non sequiturs. I’ve read enough of your posts to know you are honestly trying to understand. Not blowing smoke in a polemic way. So let me address these piece by piece.
I’ve already indicated that the RR effects of the crisis are alive and well. Hence, “That it was demographics?” does not really follow. Hence your “But if it was demographics … “ does not really follow either. So finally let’s examine the IMF, OECD, CBO consistent over-prediction. Indeed they did miss the boat on the extraordinary decline in the LFPR. That was the isolated piece I addressed in my post. But it is only a piece, and hardly the most important one. Productivity growth is. On this you might read Robert J. Gordon’s Demise of US Economic Growth articles. And take note that the overall LFPR is a function of the crisis itself. Specifically debt transmits some of its effect on growth through dampened aggregate demand, and hence into fewer job opportunities which surely affect LFPR. In youthful age cohorts, this shows up in dropping out and going back to school.
Will growth return to traditional rates? No for manifold reasons.
Plus, fiscal policy wasn’t applied properly: Europe chose austerity, and the US fiscal stimulus was greatly weakened by the long-term effort by conservatives to cripple government – in large part organized by the Koch brothers, who recognize that government is the instrument that will (or should) accelerate the demise of oil and fossil fuels.
Krugman is right; no one bothers to read the old models from the 1930s and 1940s, and as a consequence they completely misunderstand what’s going on. This whole Piketty discussion is a case in point. Look, Piketty makes it pretty clear that the second fundamental law is based on Harrod’s 1939 paper that defined the warranted growth rate. Piketty even gives us the link: http://piketty.pse.ens.fr/files/Harrod1939.pdf If you bother to read the paper you will see exactly where Piketty gets his B = s/g formula…it’s right there on page 25. Harrod also rewrites the equation putting the warranted growth rate on the left hand side. He calls this the “Fundamental Equation in its simplest form.” And yes, Fundamental Equation is a proper noun. Harrod also makes it very clear that he is talking about the incremental change in capital relative to some time period. This tracks with Piketty’s use of “net wealth.” And Harrod also identifies two kinds of capital; one kind that is a function of income and another kind that grows independent of income. Hey…sounds a lot like Piketty’s sense of net wealth including productive capital stock and unproductive capital.
Poor Rick Stryker went to a lot of bother writing out a bunch of algebra that was all well and good, but completely off topic and irrelevant. Critical to both JDH’s and Rick Stryker’s critique is the modern assumption that “savings” is the difference between gross income and consumption. So Rick Stryker starts out with savings = s*Y(t). That’s a perfectly sensible definition of savings. And calculating the savings rate as the 1 minus the average propensity to save divided by gross income is a perfectly sensible definition of the savings rate. But it’s not Piketty’s definition and so criticisms based on an erroneous definition of savings are simply a waste of everyone’s time. Piketty clearly defines the savings rate as the ratio of the change in net private wealth divided by net income. Nowhere does Piketty defined savings as some fraction of gross income, ala JDH and Rick Stryker. So let’s take an example. If gross wealth is $1000 at t(0) and $1020 at t(1), then the change in net private wealth is $20. If net income is $100, then under PIketty’s definition the savings rate would be $20/ $100 = 20%. It does not matter whether depreciation was $10, $100 or $200…all that Piketty uses is the net change regardless of how that net change came about. It could have been as a result of reinvesting savings from gross income above and beyond the amount needed to replace capital consumption. But some of the change in net wealth could have been due to appreciating capital assets (both productive and unproductive). And this is perfectly consistent with Harrod’s “fundamental” relationship. What happens if the net capital stock in t(0) is $1000 and the net capital stock in t(1) is also $1000? Then the savings rate is zero, which means “beta” will go to zero. Is this right? Yes. Why? Because with any non-zero growth rate the denominator in K/Y will increase, but K will stay fixed because there is no change. At the limit K/Y (or beta) will go to zero. So how would income rise if capital did not increase? One way would be population growth.
So why did Harrod write his famous paper. He tells us it’s because he wanted to describe how the business cycle was inherently unstable. Here’s from near the end of Harrod’s paper:
According to the dynamic theory, the tendency of a system to relapse into depression before full employment is reached in the boom suggests that its proper warranted rate exceeds its natural rate. Outside evidence includes the known decline in the growth of population, which involves a decline in the natural rate. More controversial points are the tendency of a more wealthy population to save a larger fraction of its income (high value of s involves high warranted rate), and the tendency of modern progress to depress rather than elevate the value of C (low value of C involves high warranted rate).
Gee, kinda sounds a lot like Piketty. What Piketty did was to take Harrod’s basic fundamental law describing the dynamics of the “warranted growth rate” consistent with net savings and a given capital/output ratio and then tweak it so that the K/Y (or beta) was on the LHS and “g” was on the RHS. Under Harrod’s original model we have this: g = s/(K/Y). If you redo the algebra you will find this: K/Y = s[(1/g)+1], which Piketty simplifies to K/Y = s/g. Piketty’s original contribution is that he gives “s” a novel meaning. Rather than referring to savings as a function of gross income, he really defines it in such a way that its new meaning is more along the lines of the rate at which new wealth is created relative to net income. It doesn’t have a damn thing to do with the savings rate used by JDH or Rick Stryker. And that’s why all of the criticisms about the depreciation rate are off target.
Finally, at least one of the critics cited by JDH has in fact modified his view and now says, “…Piketty’s formula K/(net Y) = (net s)/g is correct, I believe, for any fixed g.” The author quite sensible would now like to “challenge instead the assumption in Piketty that the net savings rate does not vary with g.” (source: personal discussion).
Correction: Under Harrod’s original model we have this: g = s/(K/Y).
Should be: g = [s/((K/Y)-s)]
2slugbaits,
JDH’s initial example uses the net saving rate and I have been using the net saving rate in my discussions of Piketty’s model. Piketty’s critics understand that he is using the net saving rate. I don’t think it’s worth it at this point to reply further, especially since I already replied to the very same point in a previous comment, which you are ignoring. You really should go away and try to think about this carefully, making sure that you fully understand JDH’s initial example and comments. Once you understand JDH’s example, you might want to look at my comments again. If you don’t understand JDH’s initial example, you will have no idea what I’m talking about.
On Piketty, I tried to engage Prof. DeLong on the subject, pointing specifically to Hamilton’s post. Here is the link to our conversation. At the end, he links to an online spreadsheet, which aims to show that net saving rate is not material; I couldn’t reproduce it.
https://twitter.com/delong/status/476176671754555393
Brad DeLong has just surrendered–without mentioning that’s what he’s doing–by praising Matt Rognlie’s analysis of Piketty;
http://www.mit.edu/~mrognlie/piketty_diminishing_returns.pdf
Which is pretty much what Krusell, Hamilton, Sala y Martin have been saying all along.
JDH,
There is a subtle but important difference between the point you originally made about Piketty’s second law and the analysis in Krusell and Smith. Although their analysis is quite good, I think you have the more important point.
Piketty writes his model as
K(t+1) = K(t) + s*Y(t)
Y(t+1) = (1+g)*Y(t)
where K(t) is capital or wealth, Y(t) is net income, s is the net saving rate, and g is the growth rate of net income. If Y_g(t) = gross income, then
Y(t) = Yg(t) – d*K(t) where d is the depreciation rate.
Both Piketty and Krusell and Smith consider the case when g goes to zero. But, importantly, that g is the growth rate of net income, not gross income, which implies different behavior from your example. In your example, you had Y_g0, initial gross income, equal to 100, K0, initial capital, equal to 100, d = 10%, and s = 10%, and you considered the case in which growth rate of gross income is zero. In that case, net income went to zero and the economy starved itself.
But that’s different from the case that Piketty and Krusell and Smith consider, which is the growth rate of net income going to zero. In that case, the economy does not starve itself. If the growth of net income is zero, then net income remains constant. So, at time 0, net income is 100 – .1*100 = 90. Out of that 9 is saved and added to K, making K = 109. But to keep net income constant, Y must grow from 100 to 100.9, since net income must be constant at 100.9 – .1*109 = 90. Consumption will be constant at 81, since every period, net income is 90 and .1*90 is added to capital.
So, g = 0 for net income implies that net income remains constant at 90, consumption remains constant at 81, and Y_g and K continue to grow. In the long run, their growth rate will converge to zero, and the ratio of K/Y_g = 1/d. Since consumption is constant and Y_g continues to grow, the ratio of consumption to gross income goes to zero. That’s certainly a very strange outcome, but it’s not quite as apocalyptic as the scenario you painted.
Your comment can be interpreted as realizing that their is nothing sacred about g = 0. g could be negative too. How could that happen? One way is for the growth rate of gross income to be zero. In that case, Piketty’s model would be
K(t+1) = K(t) + s*(Y_g0 – d*K(t))
Y_g0 – d*K(t+1) = (1+g)*(Y_g0 – d*K(t))
The first equation may be written
K(t+1) = (1-s*d)*K(t) + s*Y_g0
and the solution is
K(t) = [(1-s*d)^t](K0 – Y_g0/d) + Y_g0/d
Thus, as t goes to zero, K goes to Y_g0/d as in your example and net income Y_g0 – dK(t) goes to zero
So, if the growth rate of gross income is zero, that implies that the growth rate of net income is negative. What is the growth rate of net income in this case?
We can solve for g.
Y_g0 – d*K(t+1) = (1+g)*(Y_g0 – d*K(t))
Y_g0 – d(K(t) + s*(Y_g0 -dK(t)) = (1+g)*(Y_g0 – d*K(t))
Y_g0 -d*K(t) -d*s*Y_g0 +s*d^2*K(t) = Y_g0+ g*Y_g0 – d*K(t) – g*d*K(t)
s*d*(d*K(t)-Y_g0) = g*(Y_g0 -d*K(t))
Thus, g = -s*d
That’s not a surprising result given the solution to the difference equation for K(t).
Thus, I think you could restate your point as follows: if the growth rate of gross income is zero in Piketty’s model, that implies that the g, the growth rate of net income must be negative, and will equal -s*d. In that case, in long run equilibrium, net income will go to zero and the economy will starve itself. However, if g = 0, that implies that the growth rate of gross income is positive. In that case, net income and consumption is constant, and K and Y_g will grow, such that the ratio of consumption to gross income goes to zero. Eventually, K and Y_g growth will slow to zero and their ratio in the long run will go to 1/d.
Sorry, I looked further and I think the premise of my above comment is wrong. Although Piketty does seem to write the model down to mean g is the growth rate of net income in “Capital is Back,” I think he just means that net income grows at g in the long run, where g is the growth rate of gross output. I took a look at some of his other stuff and he defines g to be the labor productivity growth rate inside a production function, for example. Krusell and Smith have interpreted Piketty that way and so they also mean that g is the growth rate of gross output, since their g is inside a production function.
If Piketty had meant that g is the growth rate of net income, that would have constituted a partial defense of his identification of Marx’s principle of infinite accumulation with the second law, since he would not have been implicitly saying that the economy starves itself when g goes to zero in his discussion in the book but rather that consumption remains constant as capitalists accumulate capital. In that case, JDH’s critique would still be correct of course. But Piketty is apparently implicitly saying that the economy will starve itself as g goes to zero, since g refers to gross output.