The group is calling itself the Islamic State of Iraq and al Sham, translated as the Islamic State of Iraq and Greater Syria, or ISIS. And so it may come to be.
From Friday’s Wall Street Journal:
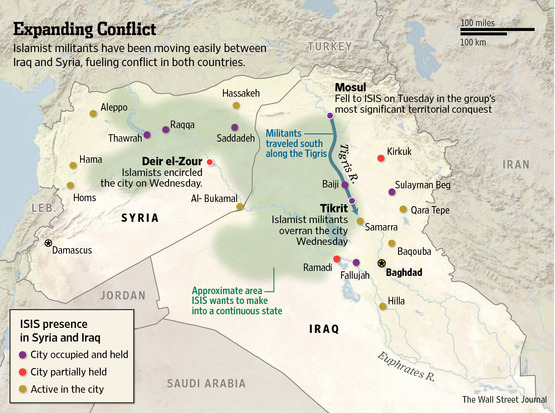
A militant Islamist group that has carved out control of a swath of Syria has moved into Iraq, conquering cities and threatening the Iraqi government the U.S. helped create and support with billions of dollars in aid and thousands of American lives.
The group– known as the Islamic State of Iraq and al Sham– isn’t a threat only to Iraq and Syria. It seeks to impose its vision of a single radical Islamist state stretching from the Mediterranean coast of Syria through modern Iraq, the region of the Islamic Caliphates established in the seventh and eighth centuries.
Source: WSJ.
Kurdish Peshmerga forces in the northeast claimed separately to have taken control of Kirkuk, center for the key oil fields in northern Iraq, and roughly dividing up the country along sectarian lines between the Kurds, Sunni, and Shia.

Source: Juan Cole.
Let’s start with the immediate implications for Iraq’s oil production. Not too long ago, Iraq was claiming that it would be producing 12 mb/d by 2017. To describe those plans as “ambitious” seems too gentle a criticism. Gross overstatement of what was feasible was a necessary consequence of a bidding procedure in which awards were based on the daily volume that a company promised to produce. Nevertheless, some analysts like Leonardo Maugeri took Iraq’s claims half-seriously (literally), assuming that Iraq would be able to achieve half of those target levels by 2020.
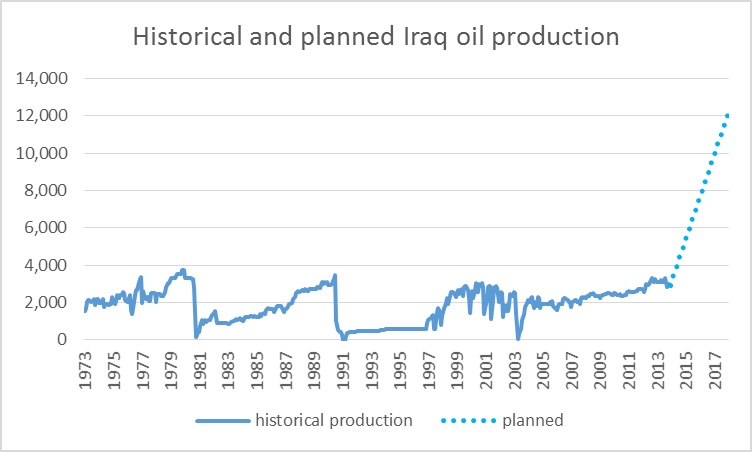
Historical Iraqi oil production in thousands of barrels per day, 1973:M1 – 2013:M12, and linear extrapolation to goal of 12 mb/d by end of 2017.
Daniel Yergin, another of the former Iraq optimists, was quoted by the New York Times as saying on Friday:
All the oil companies are on alert… They are going to worry about the security of their people and installations. Obviously, no one is going to do anything new.
| Field(s) | Plateau (mbd) | Co. | Resv (gb) | Depletion | Fee ($/b) | Links |
|---|---|---|---|---|---|---|
| Rumaila | 2.85 | BP, CNPC | 17 | 6.1% | $2.00 | 1 |
| West Qurna Ph I | 2.33 | Exxon, Shell | 8.7 | 9.8% | $1.90 | 1, 2 |
| West Qurna Ph II | 1.8 | Lukoil, Statoil | 13 | 5.1% | $1.15 | 1 |
| Majnoon | 1.8 | Shell, Petronas | 12.6 | 5.2% | $1.39 | 1, 2, 3 |
| Halfaya | 0.535 | CNPC, Total, Petronas | 4.1 | 4.8% | $1.40 | 1, 2, 3 |
| Zubair | 1.125 | ENI, Kogas, Occidental | 6.6 | 6.2% | $2.00 | 1, 2 |
| Gharaf | 0.23 | Petronas, Japex | 0.86 | 9.8% | $1.49 | 1, 2 |
| Badra | 0.17 | Gazprom, Petronas, Kogas | 0.8 | 7.8% | $5.50 | 1, 2, 3 |
| Al-Ahdab | 0.115 | CNPC | N/A | N/A | $3 | 1 |
| Qaiyarah | 0.12 | Sonangol | 0.8 | 5.5% | $5.00 | 1, 2 |
| Najmah | 0.11 | Sonangol | 0.9 | 4.5% | $6.00 | 1, 2 |
| Total | 11.185 | 65.36 |
Four years ago, Stuart Staniford tracked down the specific details (reproduced in the table above) behind the proposed increases in Iraqi production. All but 200,000 b/d of the increase was supposed to come from southern and central Iraq, away from the areas now controlled by ISIS.
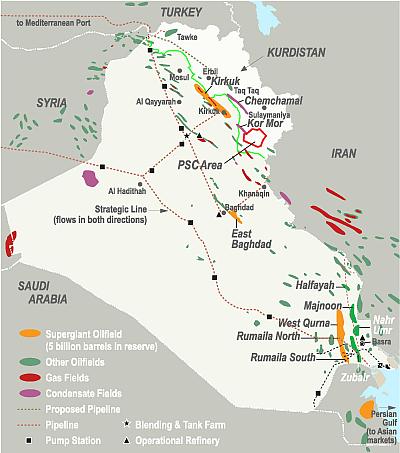
Iraq’s major oil fields. Source: Energy-pedia.

Oil fields targeted for big production increases in second auction. Source: Petroleum World.
Only 10% of Iraq’s recent oil exports went through the north, and even these had been shut down for several months before the latest developments. The main oil field in the north is the Kirkuk oil field, which appears now to be in the hands of the Kurds. The New York Times opines:
Paradoxically, the unrest may help increase exports from the oil-rich northern Iraqi region of Kurdistan. The Kurdish government has recently opened a pipeline directly linking oil fields in the enclave to Turkey, raising the possibility of substantial exports in the range of 400,000 barrels a day of Kurdish oil though Turkey.
Although the consequences for Iraqi oil production of what has happened so far appear to be minimal, all this comes at a time when the earlier and still ongoing conflicts in Libya and Syria have already disrupted nearly 2 mb/d in world oil production. If Iraq’s recent 3 mb/d was also taken out, we would be talking about a significant disruption in world oil supplies, and likely an oil price in excess of $150 a barrel.
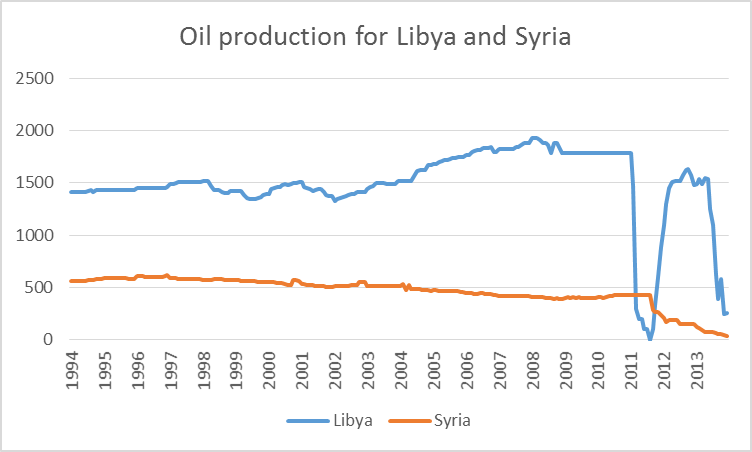
Crude oil production from Libya and Syria, 1994:M1 to 2013:M12, in thousands of barrels per day. Data source: EIA
How vulnerable would the U.S. economy be to another oil price spike? One of the mechanisms by which earlier oil shocks contributed to economic downturns was a sudden change in the composition of spending, as consumers for example stopped buying the less fuel-efficient vehicles that were historically central for North American car company profits. Sales of light trucks and SUVs manufactured in North America fell to the same numbers as cars during the Great Recession, but have since climbed back up to their pre-recession levels.
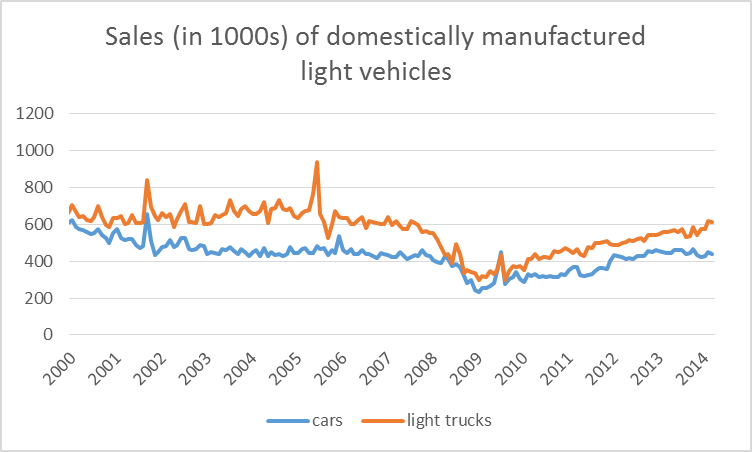
Retail sales of domestically manufactured cars and light trucks in thousands of units, seasonally adjusted.
But even so, the new vehicles people are buying today are much more fuel-efficient than the ones sold in 2006, and both the manufacturers and prospective buyers were already paying a lot of attention to fuel economy well before the latest developments. Another oil price spike in today’s environment is unlikely to have the same shock potential for the U.S. auto industry as it did the first time gasoline prices went to $4.00 a gallon.
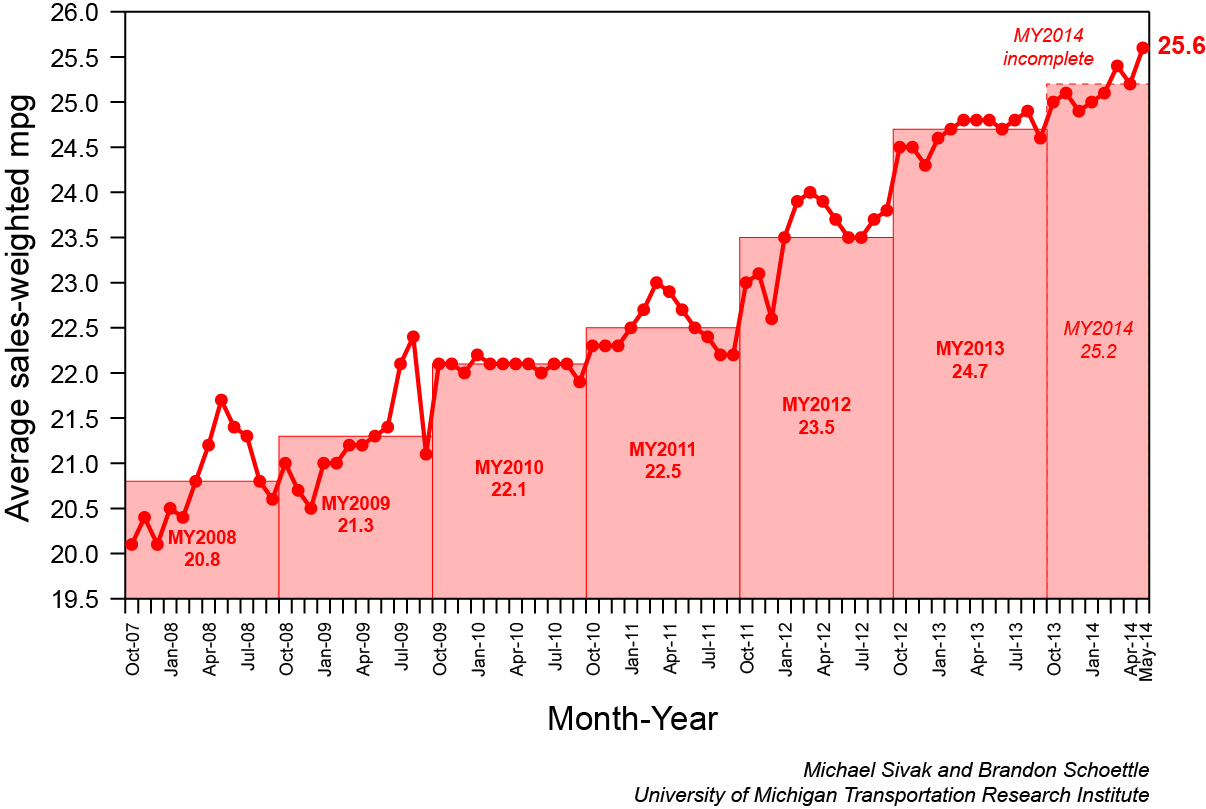
Average sales-weighted fuel-economy rating (window sticker) of purchased new vehicles. Source: University of Michigan Transportation Research Institute.
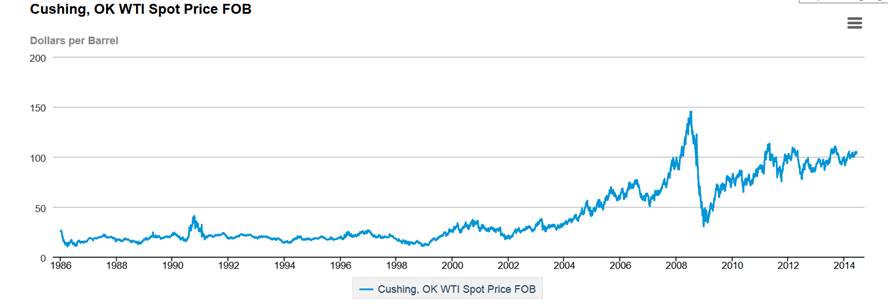
North Sea Brent crude oil closed Friday at $113/barrel and West Texas Intermediate at $107. That’s up sharply for the week, but still below the highs of $125 and $110, respectively, that we’ve seen since 2011.
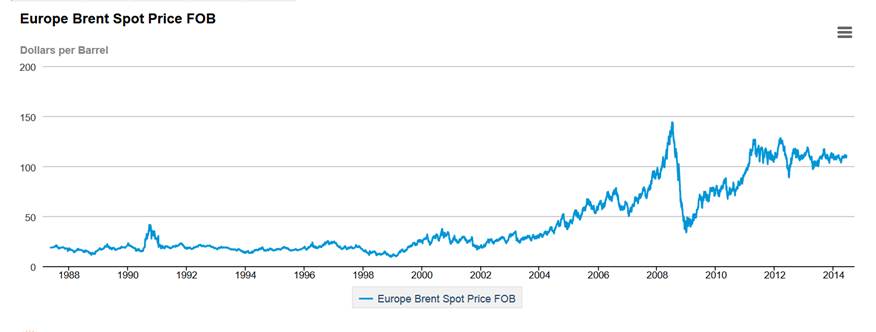
Price of Brent, dollars per barrel. Source: EIA.
The average U.S. retail price of gasoline is still 30 cents a gallon below recent highs as well. A modest move back up seems unlikely to shock consumers into different patterns of spending than they had already been planning.
|
|
| New Jersey Historical Gas Price Charts Provided by GasBuddy.com |
Energy expenditures overall are back down to about 5-1/2 percent of the average household’s budget.

Energy expenditures as a percentage of consumer spending, 1959:M1 to 2014:M4. Calculated as 100 times nominal monthly consumption expenditures on energy goods and services divided by total personal consumption expenditures. Data source: BEA Table 2.4.5U. Blue line is drawn at 6.0%.
To summarize, my view is that the U.S. economy is less vulnerable to an oil price shock than we were in 2007. Moreover what has happened on the ground so far in Iraq should not have major immediate implications for the price of oil.
But longer term, we may have just witnessed the creation of an important new power in the Middle East. Among other spoils, ISIS apparently seized $425 million from the Iraq central bank in Mosul. From ABC News:
Analysts say the financial and strategic spoils of ISIS’s capture of Mosul and Tikrit could provide a significant, nearly unstoppable boon to its Syrian arm, helping turn the tide in the months-long battle for Deir Ezzor.
So the immediate implications for the U.S. economy may turn out to be minor. After that? The world seems to be changing.
The provincial governor of Nineveh, Atheel al-Nujaifi, said that the radical Islamists had lifted additional millions from numerous banks across Mosul, as well as a “large quantity of gold bullion”….
I don’t doubt Mr al-Nujaifi was running scared, but I can’t believe he and his sidekicks were all so panic-stricken that they left a stack of gold behind. Search his 4×4.
I would suggest, that half or more of world goo production
comes from crevasse regions; which means crude pricing
can and will be wild and woolly; this despite the fact that 99%
of nations have operating governmental units.
Until world production exceeds consumption by 10%, world
economies will continue to struggle to maintain orderly growth
and increasing standard of living.
http://www.eia.gov/countries/cab.cfm?fips=sy
Iraq’s net oil exports increased from 1.35 mbpd in 2005 to 2.25 mbpd in 2012, as what I define as Global Net Exports of oil (GNE*) fell from 46 mbpd to 44 mbpd. More importantly, what I define as Available Net Exports of oil (ANE, or GNE less Chindia’s Net Imports) fell from 41 mbpd in 2005 to 35 mbpd in 2012.
As noted in other threads, given recent data, I suspect that any disruption in Iraqi net exports would disproportionately affect net oil importers other than China & India, e.g., the US:
http://i1095.photobucket.com/albums/i475/westexas/Slide14_zpsb2fe0f1a.jpg
*Some definitions:
Global Net Exports (GNE) = Combined net exports from (2005) Top 33 net oil exporters, total petroleum liquids + other liquids (EIA).
Available Net Exports (ANE) = GNE less Chindia’s Net Imports (CNI)
CNE = Cumulative Net Exports (for a given time period)
An “Interesting” What-If . . . .
ANE “Gap Chart” for 2002 to 2012, showing a decline in ANE, from 41 mbpd in 2005 to 35 mbpd in 2012:
http://i1095.photobucket.com/albums/i475/westexas/Slide04_zpsd68833b7.jpg
The following chart shows the GNE/CNI data from 2002 to 2012, with the extrapolation to the year 2030 based on the 2005 to 2012 rate of decline in the ratio:
http://i1095.photobucket.com/albums/i475/westexas/Slide1_zps9ff3e76d.jpg
At a GNE/CNI Ratio of 1.0, theoretically there would be zero Global Net Exports of oil available to importers other than China & India.
In any case, given the observed GNE/CNI decline, we can estimate** theoretical post-2005 Available CNE (Cumulative Net Exports).
Estimated Available post-2005 CNE:
(15 Gb/year X 25 years X 0.5) – 15 Gb = 173 Gb (billion barrels). This is ANE in 2005 times estimated number of years to zero ANE times 0.5 (to get area under a triangle) less 2005 ANE.
We can then estimate the rate of depletion per year in remaining Available post-2005 CNE.
2006 to 2012 ANE by year divided by estimated remaining Available post-2005 CNE (estimated simple percentage depletion by year):
2006: 14.6/173 (8.4%)
2007: 14.1/158 (8.9%)
2008: 14.2/144 (9.9%)
2009: 13.1/131 (10%)
2010: 13.2/118 (11%)
2011: 12.8/105 (12%)
2012: 12.8/92 (14%)
In other words, based on the above data, I estimate that we (theoretically) burned through, in only one year (in 2012), about 14% of the remaining cumulative supply of Global Net Exports of oil available to about 155 net oil importing countries.
**I assume a triangular shaped net export decline. This method was too optimistic for estimating post-1995 CNE for the Six major net oil exporters (excluding China) that hit or approached zero net exports from 1980 to 2010, based on 1995 to 2002 rate of decline in their combined production to consumption ratio. For more info, search for: Export Capacity Index
Much depends on how Iraqi oil production actually evolves.
In a worst case scenario, production could fall by about 3 mbpd.
Of this, the Saudis might be able to offset about half, leaving 1.5 mbpd to be offset directly by consumption declines. Pro rata, the US would have to take 300 kbpd in demand reduction as its share. That’s 1.6% of US demand. Add it to the current 1.8% pace of efficiency gain, and you’re needing to attain 3.4% efficiency gain overall. That typically doesn’t happen outside a recession.
Since 1980, there were four years when global oil consumption fell by 1.5% or more: 1981 (recession), 1982, 1983 (recession), 2008 (recession), that is, second modern oil shock and the fourth modern oil shock.
I’d add that US oil consumption as a share of GDP was 4.28% in May, pushed right up against the carrying capacity limit, just where theory says it should be.
Add it to the current 1.8% pace of efficiency gain, and you’re needing to attain 3.4% efficiency gain overall. That typically doesn’t happen outside a recession.
The US reduced it’s oil:GDP ratio by 3.5% per year from 2005 to 2008, without even trying – purely because oil prices rose.
That rate improved by 2.6% from 1978-2013 very little public policy effort (just a very timid CAFE). but oil prices are still highly affordable; and much lower than they should be (if they included all indirect costs): consumers have very little incentive towards efficiency.
Oil prices had been low for decades before 2005 – it took more than 5 years for car companies to respond with plug-in cars. Yet the transition hasn’t sped up – why? Could it have more to do with Fox News bashing hybrids and EVs, and less to do with anything real?
Oil is still highly affordable: fuel costs represent less than the cost of depreciation for the average new car buyer. Buyers are choosing vehicles that use 10x as much fuel as the most efficient hybrid, and that cost twice as much as the least expensive (and more efficient) alternative.
Oil is priced much less than it should be: the indirect costs of pollution and supply insecurity (paid in the from of $trillions in recession losses as well as $trillions in military costs) represent a very large subsidy for oil consumers. If oil were priced properly (at least $2, and probably $4 more) consumers would have a much greater incentive – they’d actually pay attention to MPG(!).
We can’t ignore indirect, external costs, right??
2.8% as a cap is…risible. If Consumers were incentivized with realistic prices, they could reduce consumption by 50% in a week with a Prius. By 90%, if they bought a Volt. By 100% overnight by carpooling, at no cost (don’t say that a population that mostly owns smartphones can’t carpool – look at Uber).
Oh, and the timing of Saudi offsets matters as well. Libyan oil production collapsed in March 2011; Saudi responded in June. Total lost liquids from OPEC reached 1.3 mbpd in March 2011. And that sent Europe into an 18 month recession (with all due respect to S & S).
If the global economy was lacking, say, 2.5 mbpd of production for three months, well, that could send the world into recession, I think.
BBC uncovers new evidence of civil unrest in Saudi Arabia:
http://www.bbc.co.uk/mediacentre/worldnews/2014/our-world-saudi-secret-uprising
My comments:
As noted in another thread, I think that Saudi Arabia can accurately be described as “Metastable,” in that it appears to be stable, but it is inherently unstable–especially as they transition from the current generation of geriatric rulers to the (much larger) next generation of princes.
In any case, based on the 2005 to 2012 rate of decline in the Saudi ECI Ratio (ratio of production to consumption), I estimate that Saudi Arabia may have already shipped (through 2012) about one-third of their post-2005 CNE (Cumulative Net Exports):
http://i1095.photobucket.com/albums/i475/westexas/Slide21_zpsd1963fe3.jpg
BP’s annual data set is out for 2013, and they show a decline in Saudi net oil exports, from 8.6 mbpd in 2012 to 8.4 mbpd in 2013, putting their ECI Ratio (Ratio of production to consumption) at about 3.7, which would be on the extrapolated ECI glideslope for Saudi Arabia:
http://i1095.photobucket.com/albums/i475/westexas/Slide10_zpse47cfe8a.jpg
(EIA data for ECI graph)
I’m estimating that the GNE/CNI Ratio for 2013 will also fall right on the extrapolated glideslope for the GNE/CNI Ratio.
The following chart shows the GNE/CNI data from 2002 to 2012, with the extrapolation to the year 2030 based on the 2005 to 2012 rate of decline in the ratio:
http://i1095.photobucket.com/albums/i475/westexas/Slide1_zps9ff3e76d.jpg
(Definitions above)
If the world economy is this dependent on the ooutput of one small country, how can we say that oil is a reliable energy source?
Clearly it’s not – it’s time we accelerated the transition to better and cheaper alternatives (primarily hybrids and EVs). Those alternatives are here – the only barriers are social and political.
NYT: US to evacuate many staff members from Baghdad Embassy:
http://www.nytimes.com/2014/06/16/world/middleeast/embassy.html?hp
I’m reminded of the last US helicopter out of Saigon, in 1975, a couple of years after the US finally gave up and pulled out of Vietnam:
http://upload.wikimedia.org/wikipedia/en/9/95/Saigon-hubert-van-es.jpg
ABC on Friday quoted an unnamed US official as saying that after reviewing the most recent intelligence data on Iraq, “It makes one want to kill oneself.”
Since the mid-2000s, we had to employ increasingly more resources to extract the same barrel of oil, which reduces living standards.
However, it likely raises U.S. GDP (through more domestic production and less imports, although the higher price slows consumption of oil and other goods).
Nonetheless, the U.S. remains in a deep, and long, depression. Final Q1 2014 real GDP growth is predicted to be revised down from -1.0%, perhaps to -2.0%.
http://www.advisorperspectives.com/dshort/updates/Real-GDP-Per-Capita.php
http://stockcharts.com/articles/tac/2014/06/sy-harding-worry-about-the-second-quarter-q1-is-history.html
Is there any reliable, independent information of where and from whom ISIS got their weapons? Was it from the US, as support to insurgents in Syria, or from the Saudis, or both?
These are groups that the Obama administration not so long ago supported in their attempt to topple the Assad government in Syria.
And Obama tried to bully Germany to support these terrorists, until even the English Parliament rejected for the first time in 200 years the war motion.
How often did we have this now, that the supported terrorists are then turning on they hapless US paymasters?
Marco,
Word is that when ISIS first organized it was being funded by the Gulf States allied with the US with money being funneled through Kuwait from Saudi Arabia and Qatar. Throught their operations in Syria they acquired weapons through their military success. They also looted banks. Most of their arms are US.
Since their invasion of Iraq they have taken significant money from banks and it is reported they are exporting oil through Turkey and using the resources to fund their army. I have not seen any evidence that the US is directly involved in arming them but rumors are that Benghazi was about running weapons to Syrian rebels so we really don’t now what is being done in the shadows.
It seems that the image of a rag-tag army is without support. This group is very sophisticated.
The Obama administation has been so adept at foreign policy in the mid-east that he is supporting ISIS in Syria and fighting them in Iraq. I do not know of any time in history with this kind of incompetence before. We have done this at different times such as backing Sadaam against Iran then fighting him later but never have we been on both sides of a conflict at the same time. It is absurd that we are fighting ourselves.
Ironically, it wasn’t all that many years ago that then Sen. Joe Biden and then Sen. John Kerry were arguing for a partitioning of Iraq into Sunni, Shiite and Kurdish regions with autonomy and oil sharing agreements. Now Sec’y Kerry is in the awkward position of having invent reasons why Iraq should remain as a unified country.
Genauer: “These are groups that the Obama administration not so long ago supported in their attempt to topple the Assad government in Syria.”
You seem to have it exactly backwards. It was Sen. John McCain who lambasted Obama for his hesitation on sending arms to Syrian radicals. McCain even went over there himself and posed with some of the terrorists he wished to support with arms. The Obama adminstration’s position was that it was unsafe giving arms to rebels of uncertain loyalty. McCain repeatedly tried to goad him into doing more, but Obama wisely refused.
Perhaps you are confusing this situation with Ronald Reagan who gave arms to the Taliban in a proxy war against the Soviets and contributed to the rise to power of Osama Bin Laden.
Joseph,
where we differ, is that the financial support,and the open show of folks like McCain (in a German context I would consider his behavior as treason) was already TOO much, because with that they got the weapons and other support from Turkey and Saudis and ….
And now you are in a situation in which your foreign minister, the Swiftboat captain, was already musing about military cooperation with Iran. Ieeeek.
At the times of Reagan, one can argue very well, that it was not yet clear that those religious fanatics will then just go on on the rampage, and that support was legitimate. In nowadays conflicts there is no doubt anymore. It is always the same.
30 years ago, when I was young and dumb, I wrote some unfair leaflets, our defense intelligence showed me, before they gave me NATO security clearance : – ).
Today I am perfectly fine with Reagan, but certainly not with Bush II and Obama, both amateurs.
Well done. I also like slug’s point.
One important thing to keep in mind as you’re looking at that top map is that the ominously big green shaded area attributed to ISIS is mostly barren formidable desert. When you get down to it what ISIS really controls in Iraq is a stretch of the Euphrates and a stretch of the Tigris, with a couple cities and several towns. ISIS seized what is really a small area where Shiite power was weak. ISIS can make some trouble for the Kurds’ hopes of developing and exporting untapped oil around Kirkuk, but I don’t see ISIS as a serious problem to the ability of the Shiites and their contractors to maintain production or develop more. In that respect ISIS may be more of a convenient excuse to abandon unrealistic targets.
Good post.
If radical Sunni separatists do take the rest of Iraq and get all the way to the Gulf, oil prices are going a lot higher. The perceived threat to Gulf oil supplies will drive the security of supply fear premium very high.
I reckon that if oil prices go above US$140/bbl, the US goes into recession. Again. Gasoline and diesel consumption remains an important chunk of firm and household budgets.
On the bright side, the current fear premium could remain in the price of oil for many months, if not years, to come.
Unless ISIS can take the oil fields, their state will be an economic basket case. Lots of luck with that. Also Slugs I remember the pictures of Bob Dole and Rumsfeld with Saddam.
The Kirkuk field is obviously the most vulnerable so that’s why they’re focusing on that area. What’s happening now is the Kurds are asserting control over it. So they’ll be getting the revenues not the central government, and that money will likely go initially to strengthening the Kurdish military.
ISIS seems more able to disrupt than actually take control of and operate Kirkuk. ISIS wouldn’t be able to use the pipeline to Ceyhan. If they took the field they would have to carry the oil out by truck. Most likely production would shut down to a minimum.
To me ISIS looks very, very far from ready to take on the Shiites on their home turf for control of the southern oil-producing regions. They are attacking Kirkuk because it’s by far more vulnerable. More likely they are trying to extort something out of the Kurds than really trying to take the field.
But ISIS also seems too effective to not be getting funded from outside. Maybe Saudi?
Guys,
As an investor specialized in overseas oil exploration companies (e.g., Colombia), I have a vested interest in the USA invading and occupying countries.
Please do not lose your enthusiasm for top-down regime change.
Remember the golden rule of American policy wisdom. If it worked during and immediately after WW II, it will also work in the early 21st century.
You can accomplish almost the same thing by sending even more money and weapons to Israel.
Besides, you really want to keep the US Federal Reserve busy papering over foreign policy ‘adventures’.
And whatever you, NEVER EVER increase excise taxes on gasoline and diesel fuel. That would be so un-American and very contrary to my interests.
Freedom! and kind regards -westslope
Westslope,
In Colombia the oil is owned by the government. How is it you are invested in Colombian oil? Are you strictly invested in “exploration” companies? I am not sure I understand.
My Colombian friends all say they would be producing twice to three times as much oil if they owned the oil and simply paid the government taxes on production. As it is the government owns the oil and simply pays a lease fee to the land owner for a small piece of land to rest the pump. There is no incentive for those in the oil industry to increase production because they are all paid a salary by the government totally independent of production. This is one reason there is limited exploration for oil in Colombia and many other countries around the world. It makes no sense to spend enormous amounts of moneyto explore only to see the government expropriate any profits.
My Columbian taxi driver says the same thing.
Jim was given an achievement award by the International Association of Energy Economists in New York this past Monday. This award recognizes an economist for outstanding contributions in the field of energy economics and is the highest award of the Association.
Congratulations, Jim!
None of this is a problem if we say it’s not a problem.
http://www.usnews.com/news/articles/2013/05/23/obama-global-war-on-terror-is-over
Gents, see charts at the links below, FYI.
We don’t know it yet because The Chair and the stock market have not told us (and didn’t tell us in 2001 and 2008, either), but the US economy hit stall speed in Q3-Q4 2013 and is likely tipping over into recession since Q1 to date. Or at least the business and household income and investment and spending components of GDP are in recession.
Untold story to date: Were it not for the oil and gas boom/bubble (now deflating?) disproportionately contributing to skewing industrial production (and the energy-related truck and rail transport sector) higher than otherwise would be the case, the economy would already be in recession as of fall 2013. That is, the oil and gas boom/bubble is occurring at the net cost to investment, production, and real after-tax profits, wages, and household income and spending.
It looks like Q2 real GDP is so far at ~1.9% annualized and 1.2% per capita, and 0.9% real final sales and 0.2% per capita.
That would put the 2- and 3-quarter annualized rate of real GDP at ~1% vs. the ~1.9% yoy rate, and ~0.3% annualized per capita. This is a characteristically recessionary cyclical rate of deceleration from a cyclical peak.
Against the ~1.6% yoy rate, real final sales per capita annualized would be 0-0.6%, which is the secular trend rate since 2000 and 2007-08, implying that we are likely at the cyclical demand constraint for growth with Peak Oil, $107-$115 oil, $4 gasoline, Boomer demographic drag effects, and the ongoing fiscal constraint.
The US economy ex oil and gas extraction is not growing, and real final sales per capita ex oil and gas cannot grow with the price of oil above $40-$50.
https://app.box.com/s/2ju4v4ppuiuclbg4g3ek
https://app.box.com/s/gw8eimmyg00tkj4gjl3g
https://app.box.com/s/b1u4tvlri34suheb4kae
https://app.box.com/s/uagkxzk62tvtluc21r3c
https://app.box.com/s/npesogbyl519q9w02wh9
https://app.box.com/s/bxkb3903behn9wayoh33
https://app.box.com/s/woucm592gcxcz9wzc797
https://app.box.com/s/3els0mwe6uxeoort9x4n
https://app.box.com/s/80glvecja474w63lsbrx
https://app.box.com/s/sh73qoy9uar2aoeoz7ur
Cheers.
cannot grow with the price of oil above $40-$50.
I seem to remember that New York City was never going to grow above a population of 1 million because there would never be room for the horses…
Nick G, you continue to ignore the evidence, which is your prerogative, of course. The Pentagon, NSA, CIA, Wall St., White House, and big integrated and services companies cannot ignore the evidence and thus do not share your penchant for wishful thinking and Tesla dreams.
Silly-Con Valley cannot solve the emerging global structural net exergetic constraints per capita, but they can distract us with novelty while devoting their money, intellect, and time to toy making and delusional projects like mining asteroids and colonies on the Moon and Mars (and a Tesla in every Mars colony pod’s garage?).
Speaking of population capacity, it has been known by the Army Corps of Engineers and Bureau of Land Management since the 1950s what the peak carrying capacity of the major metro areas of the US Southwest would be, and these areas exceeded the capacity in the 1990s to early to mid-2000s. Of course, real estate developers, hotels/resorts, lenders, and politicians ignored and suppressed the information for decades for obvious reasons and with predictable results.
If it is the case that the US Southwest is in the early stages of a multi-decade or -century mega-drought, such as those that coincided with the end of the Anasazi and Maya civilizations, it is not inconceivable that there will be a mass out-migration of population from the Southwest in the decades hence.
Moreover, if it is the case that Peak Oil is coinciding with the end of growth of real final sales per capita, it also implies an end to the auto-, oil-, debt, and suburban/exurban housing-based model of economic activity and growth. Without growth of debt and real incomes and purchasing power, there will be no growth of profits and investment, which in turn means no growth of the overall capital stock. Lacking such growth implies no net surplus of capital and exergetic flows to build out to necessary scale the so-called “renewables” infrastructure while necessarily simultaneously maintaining the fossil fuel infrastructure in the meantime.
Teslas will be perceived in hindsight as costly, impractical toys for rich boys, and mining asteroids and colonies on the Moon and Mars will remain sci-fi fantasies.
continue to ignore the evidence
I’d love to see this evidence. If you mean that oil supply is showing problems, I agree. If you mean that oil can’t be replaced, I’d love to see why. By the way, the Pentagon is a very, very big fan of the idea that oil and fossil fuels can be replaced. They’re working on solar power for soldiers, electric motors for tanks, and biofuel for planes.
Diesel subs were the first really massive electric vehicles – they’re very similar to the Chevy Volt. Nuclear subs, of course, were the very first nuclear powered transports!
known by the Army Corps of Engineers and Bureau of Land Management since the 1950s what the peak carrying capacity of the major metro areas of the US Southwest
I think you’re straying away from oil, and into water issues. OTOH, if you have links to sources, I’d be curious. I suspect you’re misreading them: large cities don’t need much water, and there are lots of ways to address residential water issues, like recycling (see Las Vegas). Agriculture is the primary “user” of water, and ag water issues don’t have much to do with urban water issues.
if it is the case that Peak Oil is coinciding with the end of growth of real final sales per capita, it also implies an end to the auto-, oil-, debt, and suburban/exurban housing-based model of economic activity and growth
Doesn’t that assume the premise? What if Peak Oil isn’t coinciding with the end of growth (which it isn’t)? And if you really meant that PO would mean the end of growth, what’s your evidence?
Teslas will be perceived in hindsight as costly, impractical
Oil alternatives are cheap! Have you priced out a Nissan Leaf, Chevy Volt or Prius C lately? Take a look at Edmunds’ 5 year cost table: these are the cheapest cars on the road! As far as Teslas go, compare a Tesla to similarly priced luxury cars: it’s much cheaper to own, overall. I hear Tesla owners talking about saving $4k per year in fuel costs – Porsches get very low MPG!
Even if oil is scarce, it’s easy to manufacture electric cars: there’s very little liquid fuel used to manufacture vehicles, not that all that much in other kinds of energy (mostly electricity, which is abundant), and electric vehicles don’t take more energy to manufacture.
See http://www.greencarcongress.com/2014/05/gm-reduced-energy-intensity-and-carbon-intensity-per-vehicle-in-2013.html
JDH: Congratulations for the reward! Well deserved. You are a class act. Thanks to Steven Kopits for sharing that information.
Ricardo: I follow ~20 private oil exploration and production companies operating in Colombia. Most are Canadian-listed. Some are London-listed. Some are dual- and quadruple-listed (Canada, Colombia, Brazil, Mexico, USA).
Even state-owned Ecopetrol trades on the NYSE and the TSX mainboard. (EC.n, ECP.to).
I can own anywhere between 1/2 dozen to a dozen Colombian-focused companies at any one time. I have an above portfolio-weight long-hold core position in dividend-paying mid-tier Pacific Rubiales Energy (PRE.to) and a small long-hold ‘interest’ position in Ecopetrol.
Your Colombian friends are mistaken, pardon the polite understatement. The big growth in nation-wide production in recent years has come from a fascinating marriage of Canadian corporate expertise and ex-pat Venezuelan upstream and mistream oil and socio-political know-how found in Pacific Rubiales Energy, one of the fastest growing mid-tier companies anywhere in the world. The largest instutional owners of PRE common shares are based in New York. Lazard and …. sorry I can’t remember off-hand.
Colombia has a history of perhaps the most secure economic property rights for foreign direct investment in all of South America. This despite the 50-year civil war with Neo-Marxist guerrillas/criminals and the prevalence of Neo-Marxist populism with such toxic elements as ‘Dependency theory’.
Look, I have a rather unique combination of skills and personal history that nobody else participating on this board has so I am loath to ‘pump’ South American oil exploration plays. That said, I would view Colombia as the best Latin American address for foreign investors followed by Peru, Chile and perhaps Guyana and Paraguay. Venezuela, Ecuador, Bolivia, Argentina, and Brazil should be absolutely avoided or investors should tread with extreme caution. Mexico is looking promising; it is still too early to say.
In passing, I should mention that experienced oil sectors investors always claim that the key is management, management and management. In that respect, Colombia is in good hands with president Juan Manuel Santos. He is a neo-liberal economist whose policies would be popular with folks in Nordic countries. I love Juan Santos and his policies, particularly his policies of inclusion.
Hope this helps.