…in Detroit
Here is striking photo of a pile of by-product of processing Canadian tar sands oil, from NY Times:
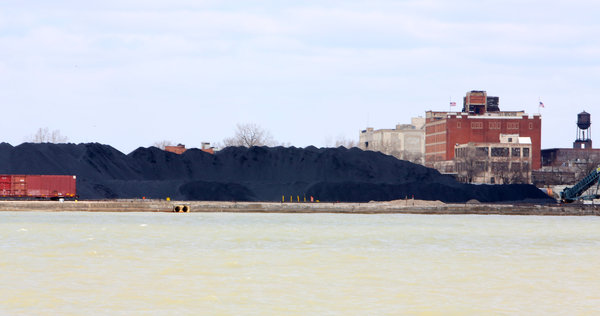
Figure 1: Petroleum coke, a waste byproduct of refining oil sands oil, is piling up along the Detroit River.
As the article notes:
Detroit’s ever-growing black mountain is the unloved, unwanted and long overlooked byproduct of Canada’s oil sands boom.
And no one knows quite what to do about it, except Koch Carbon, which owns it.
The company is controlled by Charles and David Koch…
…
Detroit’s pile will not be the only one. Canada’s efforts to sell more products derived from oil sands to the United States, which include transporting it through the proposed Keystone XL pipeline, have pulled more coking south to American refineries, creating more waste product here.
Governor Walker has written a letter to Secretary of State Kerry, urging approval of Keystone XL. In it, he writes:
Building Keystone XL pipeline is in the best interest of Wisconsinites and Americans, and I kindly ask the Department of State to complete its review quickly and grant Transcanada the Presidential Permit that is needed to start work on the pipeline.
Alberta is well on the way to accumulating this byproduct. From Robert Johnson comes this depiction.
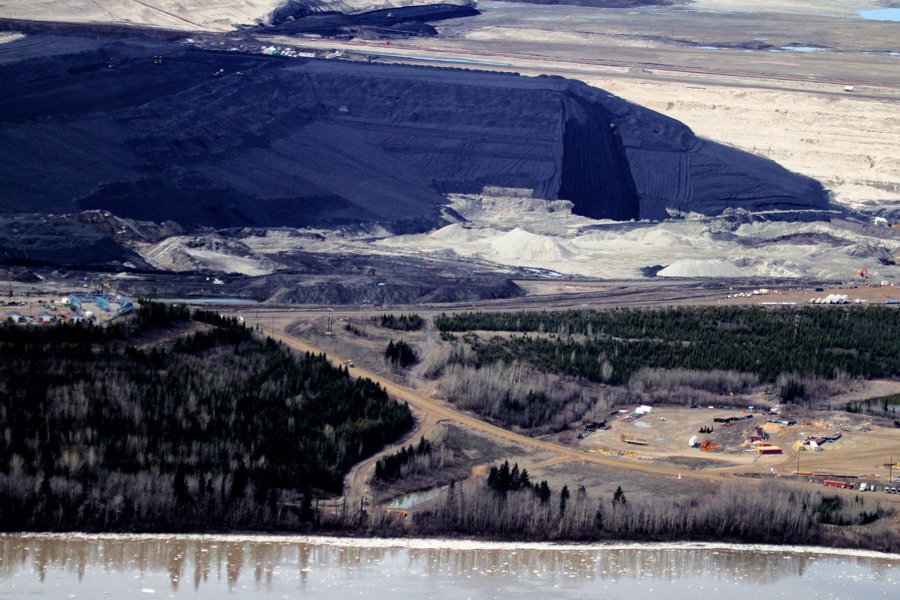
Source: Robert Johnson.
More on Keystone XL’s environmental implications here, and trade implications here.
Can we use the by-product to build roads or mix with other road building materials?
AS: No, pretty much as stated in the article, it’s too impure and wrong-sized for use in steel production, so about the only thing it can be used for is for burning as fuel; but it’s not legal [to build new plants] to burn in the US due to the high emissions. Hence, given the cost of shipping relative to price, it is pretty much stuck where it is produced. If it is produced in the US, it will likely stay where it is produced, in the absence of a some sort of subsidy or other transfer. (After all, how do you think they accumlated that pile in the second picture?).
What’s the point? Are you getting at the Koch’s? Pointing out that oil sands have an ugly by-product? Hoping to abort Keystone? All/none of the above?
Is there anything new here?
Diversion from the Obama regime’s bad press?
I think we should be told.
c thomson: The point is that there are some heretofore little-known negative externalities associated with production and transportation of tar sands oil. I have not argued for refusing permission for Keystone XL. I have stated that we should have a clear-eyed appreciation of marginal social costs as well as marginal social benefits to the United States associated with the project. I think that was clear enough to all but the most dense.
Petcoke is over 90 percent carbon and emits 5 to 10 percent more carbon dioxide (CO 2) than coal on a per-unit of energy basis when it is burned.
Of 134 operating U.S. refineries in 2012, 59 are equipped to produce petcoke including many of the largest refineries in the country. These refineries produced over 61.5 million tons of petcoke in 2011.
On a per-unit of energy basis petcoke emits 5 to 10 percent more carbon dioxide than coal.
Coke has a heating value of around 14,000 Btu/lb, versus around 12,000 Btu/lb for Appalachian coal and around 8,000 Btu for Powder River Basin (Wyoming) coal. Let’s take an average of 10,000 Btu/lb and assume coke emits 40% more CO2 per ton than standard coal, before accounting for higher CO2 per a per unit of energy basis.
Further, coke sells for about 75% of the price of steam (thermal) coal. Thus, it is properly described as a by-product, not waste product, of bitumen production.
So, how much extra CO2 is that coke throwing into the air?
Well, 61.5 million tons equals about 95 m tons of coal-equivalent CO2 emissions (61.5 x 1.4 coal energy equivalents x 1.1 emissions premium). That’s about 11% of US coal consumption.
However, coke displaces coal. So we have to net out the coal consumption that it displaced. Now, let’s assume that the lower coke price allowed us to consume more coal-equivalents that we would have been able to otherwise afford. So of that 95 m tons, 24 m tons is increased consumption. And let’s further allow the 10% increased CO2 production on the remaining share of coke consumed, which adds another 5 tons or so. In total, US coke production equals about 28 m coal ton equivalents of US consumption. This is equal to 3% of US coal consumption for 2012.
Therefore, by terminating all coke production in the US–not just from oil sands, but from heavy crudes imported from Mexico and Venezuela and heavy crude produced in California, every bit of it–we could reduce US CO2 emissions from coal by 3%.
Is this the point you were trying to make, Menzie?
Steven, Steven, Steven. Save yourself a lot of tricky math that may be above your skill level.
On a per-unit of energy basis petcoke emits 5 to 10 percent more carbon dioxide than coal.
That’s all you need to know. For every kilowatt-hour of electricity from a power plant, burning coke produces 5 to 10 percent more CO2 than burning coal. End of story. Everything else is obfuscation.
Not sure it is completely true to say that “it is pretty much stuck where it is produced”.
Large volumes of petcoke are still being sold for domestic use.
See EIA: http://www.theglobeandmail.com/report-on-business/industry-news/energy-and-resources/the-oil-sands-and-kochs-unsightly-coke-mountain/article12027761/
And exports of petcoke have been growing rapidly, doubling since 1992:
See EIA: http://www.eia.gov/dnav/pet/hist/LeafHandler.ashx?n=PET&s=MCKEXUS1&f=A
This post is meant to blast both the oil and the pipeline. But even if the pipeline is not built, trains will be used to transport this oil. Thus, if the problem really is the ugly byproduct then keep the pipeline out of the story.
Joseph, stop the name calling, obfuscation! Do you actually have a problem with Steve’s math? I believe he stopped too early in that he did not actually calculate the worst case warming impacts impacts of burning this cheap fuel source.
Here are the numbers.
Tot avg annual temp rise in ~135 years = ~.8C
Avg annual temp rise —————– = ~0.0026C
% avg of worlds yearly tot CO2 output- = ~40%
US share of yearly temp rise ——— = ~.00104C
Yearly temp inc. due to burning coke – = ~.000104C
Decadal temp inc. ——————– = ~.00104C
Century temp inc. ——————– = ~.0104C
A more rational estimate is ~50% of warming is from Green House Gases with the remainder due to natural causes. Today’s temp history shows a short term hiatus in cooling for 16+ years. Therefore the 50% number is likely more correct than not. The long term analysis of temps using ice core data shows each succeeding peak lower than the previous cooling over the past 10,000+ years.
Now the kicker, to actually get this enormous temperature increase we must believe that CO2 (not just ACO2) is 100% responsible for warming. Few scientists actually believe this. Joseph and 2slugs do, and Menzie probably does. Exaggerated and irrational fear?
George Soros,
“I admit that I have always harbored an exaggerated view of my self-importance—to put it bluntly, I fancied myself as some kind of god….”
“I carried some rather potent messianic fantasies with me from childhood, which I felt I had to control, otherwise I might end up in the loony bin.”
During an interview with “Sixty Minute’s” Steve Kroft, Soros was asked about his “best year” (Soros has repeatedly called 1944 “the best year of his life):
KROFT: My understanding is that you went out with this protector of yours who
swore that you were his adopted godson.
SOROS: Yes. Yes.
KROFT: Went out, in fact, and helped in the confiscation of property from the Jews.
SOROS: Yes. That’s right. Yes.
KROFT: I mean, that sounds like an experience that would send lots of people to the
psychiatric couch for many, many years. Was it difficult?
SOROS: Not, not at all. Not at all.
KROFT: No feeling of guilt?
SOROS: No.
Obama has recently promised 10 billion of our tax dollars to Brazil (yes, billion with a “b”), in order to give them a leg-up in expanding their offshore oil fields. Obama’s largesse towards Brazil came shortly after Soros invested heavily in Brazilian oil (Petrobras).
Kopits makes a good point.
Everything else is just knee-jerk academic liberalism. Those dear little negative externalities. My, my…what a horrid old world it is.
Why not save this one for the approval of Keystone? The mass moaning and sniveling will make a pleasing backdrop.
Steven,
Joseph has caught you in the Progressive trap. He defines a natural by-product of life as a pollutant and automatically you are condemned.
By his logic since 6 billion humans emit about 1 million tons of CO2 per day through resperation, Hitler, Stalin, and Mao eliminating about 20 million humans were the greatest environmentalists who ever lived.
John Kemp and Steven Kopits: There is, apparently, petcoke, and there is petcoke. From the NY Times article I linked to:
c thomson: A question: does every comment you make necessarily have to include the word “snivel”? Is it some sort of strange tic, or is your vocabulary so limited that you need to re-use the same words over and over?
Actually, this issue is well known and the effects studied in the government analysis of the Keystone Pipeline. There is nothing new here.
“The estimates of CO2 per unit of energy (lbs/MMBtu) used by OCI for coal and petroleum coke are 207.95 and 222.88, respectively, a 7.2% difference. But these numbers only account for the amount of CO2 released from the combustion of the two fuels; they do not include the emissions associated with the production and transportation (called ‘upstream emissions’). For coal, doing this adds 12 lbs/MMBtu. For petroleum coke, no GHG emissions need to be added since it is a by-product of the refining process and the ‘upstream emissions’ are already included in the life-cycle GHG emission estimates for oil sands crudes. (Adding them to the petroleum coke number here would be double counting.) When the adjustments are made, the difference between the two fuels declines to a trivial 1 percent. ”
http://oilsandsfactcheck.org/2013/01/18/petcoke-just-another-scapegoat/
Ricardo, there you go confusing yourself with all that mathy stuff again.
Carbon dioxide that humans exhale comes from food, which comes from plants, which comes from CO2 they remove from the atmosphere. All of the CO2 that humans exhale was taken out of the atmosphere by plants shortly before and will quickly be recaptured by plants for your next meal. There is no net change to atmospheric CO2 from human respiration.
Industrial farming and transportation of food does use a lot of fossil fuel which adds to atmospheric CO2, but breathing — no, not at all.
@Anonymous
Yes, Obama, Soros, and the Nazi Brazilian oil drillers are coming for you. Run!!!!
The snivel and the cringe are the distinguishing features of the traditional academic or East Coast liberal. Unattractive, yes, but so are the quirks of gomer Republicans.
Liberals snivel – it is just something mandatory. Look at the letters page of the NYT for examples. There is no better word and the usage is not unique to me.
I don’t get what the big deal is. It’s petcoke. It’s a byproduct of delayed coking that increases when you process a heavier crude slate. That’s largely been taken into account in all analyses of Keystone XL. You may as well argue that the tight oil coming out of North Dakota is “greener” because it has less in the way of heavy ends to be coked – it makes about as much sense, i.e. not much at all. The lifecycle emissions have already been taken into account.
I don’t work in refining (I do chemicals) but near as I can tell you coke heavy residuals if and only if there’s no market for fuel oil. I’m pretty sure some of the USGC’s refineries have visbreaker units installed that might be able to process some of the heavy ends from bitumen into HSFO 2% rather than letting it pile up.
Also worth noting that there is a lot more heavy industry likely capable of using petcoke in the USGC than where it’s being refined now.
tj and jtf: I didn’t mention the carbon emissions. I was focusing on the fact that we’d have piles of petcoke accumulating — just another example of externalities.
c thomson: Thank you. I find repetition of nonsubstantive comments along with insults befitting schoolyard taunts a common attribute of certain commenters with limited imagination.
When I was a kid we lived in Cleveland and drove back and forth to Chicago where my dads parents lived. This was in the 60s. The skies were yellow. There were giant smouldering heaps of slag and god knows what all else all along the way. Garbage blew across the roads and got stuck in the chain link fences. White houses were black with soot.
Though we could argue whether Cleveland is a better place to live now (I would argue it is) regardless, it is somewhat disconcerting to see this stuff piling up again on the riverbanks. I don’t think a lot of people in this country remember what real heavy industrial pollution looks, feels, and smells like.
Regards.
I don’t see how some ‘stir up the liberal base’ photos and Koch-stuff from the dying old NYT is ‘substantive.’ It is, however, highly predictable and hence funny.
As Kopits points out, the actual facts are complex.
Anyway, since Obama is backed into a corner on this, the whole matter is academic in the pejorative sense. Try a fresh one.
Menzie
Interesting that you never seem motivated to discuss the externatilites that are at odds with the Progressive agenda. I guess the end justifies the means.
The result is a green industry that’s allowed to do not-so-green things. It kills protected species with impunity and conceals the environmental consequences of sprawling wind farms.
There must be a cost somewhere to the Obama Administration’s pattern of selectively enforcing federal laws? The lack of enforcement across several federal agencies is troubling, but I guess the ends justifies the means.
When companies voluntarily report deaths, the Obama administration in many cases refuses to make the information public, saying it belongs to the energy companies or that revealing it would expose trade secrets or implicate ongoing enforcement investigations…
Under both the Migratory Bird Treaty Act and the Bald and Golden Eagle Protection Act, the death of a single bird without a permit is illegal.
But under the Obama administration’s new guidelines, wind-energy companies – and only wind-energy companies – are held to a different standard.
The BP oil company was fined $100 million for killing and harming migratory birds during the 2010 Gulf oil spill.
Exxon Mobil had pleaded guilty and would pay $600,000 for killing 85 birds in five states, including Wyoming.
http://m.apnews.com/ap/db_289563/contentdetail.htm?contentguid=WhxcFpkn
RE: above comments by Mr. Chinn
Mr. Chinn,
As an outsider to the industry, I would not assume you to have any meaningful knowledge on the subject of petroleum coke and as such, would not hold this against you. I do take issue with you passing the off the subject NYT article as “fact”, without verifying veracity of the information contained within the article yourself. In reality, both the author of the NYT piece and yourself (as judging by your above statements) have no idea about the quality and potential uses of the petcoke currently being produced from Canadian heavy crudes slates, and as such, should not make absurd statements like “but it’s not legal to burn in the US due to the high emissions” or “If it is produced in the US, it will likely stay where it is produced, in the absence of a some sort of subsidy or other transfer”.
As a starting point, I suggest you read John Kemp’s (Reuters) piece on the issue. It actually contains factual information on the subject and presents the issue in an objective manor. He, unlike the NYT, did his homework before publishing a story.
As far as the quotes from Ms. Satterthwaite of Roskill, I’m actually quite surprised that she would make such comments, as they are not found anywhere within her 2012 report concerning the topic of petcoke production in Canada. I’m not sure why she would take a swipe at the industry that supports her work. In a way, I’m glad she made the comments, as now I can divert the funds that were used purchase Roskill’s way overpriced (vis-à-vis content) report, to subscribe to the better research coming out of CRU or OGJ.
Other than the above, your blog looks interesting and I’ll continue to follow it.
Re: “Obama has recently promised 10 billion of our tax dollars to Brazil (yes, billion with a “b”), in order to give them a leg-up in expanding their offshore oil fields. Obama’s largesse towards Brazil came shortly after Soros invested heavily in Brazilian oil (Petrobras).”
I’ve thought for a while that we have been seeing cyclical insanity–Republicans went crazy in the Clinton years, Democrats went crazy in the Bush years, and now Republicans are going crazy again in the Obama years.
In any case, two links that address the “Obama” loan to Brazil:
http://www.snopes.com/politics/gasoline/braziloil.asp
http://www.forbes.com/sites/kenrapoza/2011/03/17/dispelling-the-petrobras-loan-myth-as-obama-heads-to-rio/
A: I stand corrected. The NY Times article is correct; I misstated (and have corrected in my comment). No NEW plants to burn petcoke will be licensed.
Menzie says: “No NEW plants to burn petcoke will be licensed.” But, he forgot to add the caveat, under this administration.
This whole issue is falling apart. Recent studies on CO2 sensitivity have lowered it from the IPCC AR4 estimates by ~1/3, and I am seeing independent work showing it lowered as much as 77%.
Reality of 16-23+ years without warming is starting to change scientific opinion. IOW, some of the rats are leaving the sinking ship. Most who do not follow the issue do not realize that the “c” catastrophic descriptor has all but disappeared from the science and even much of the press. (The primary user.)
Is there a small increase in air pollution from burning petcoke? Certainly! Can it be cleaned? Also certainly. Is CO2 a pollutant? Absolutely not. If it is we all must stop breathing.
Menzie –
The NYT article is internally inconsistent. It says: “But [Marathon] began refining exports from the Canadian oil sands — and producing the waste that is sold to Koch — only in November.” “Waste” does not have a positive value. The fact that Kock bought it by definition implies it is in fact a by-product, not waste.
As I note above, Petcoke generally has a positive value, as it can be used as a substitute for coal. If it is of the low sulfur variety, then it is used for steel and aluminum production. If not, it can be burned in coal-fired power plants, primarily in emerging countries.
The excess CO2 content of coke is about only 10% more traditional coal. The material environmental impact would result from its lower price, not from its excess emissions.
Menzie,
I don’t think it’s true that it is stuck where it is produced. The purpose of Koch Carbon buying it from Marathon is to sell it as fuel to areas where it is allowed to be burned.
That doesn’t diminish the storage externality storage, but the byproduct will likely be sold (whether the sell rate will be higher than the production rate is another matter).
A modern coal fired powerplant with a sulfur recovery system could burn petcoke easily, even high sulfur varieties.
Alternatively, refiners could install coker hydrotreaters and recover the sulfur before the coking process. This is how a select few refiners make petcoke that is usable for metallurgy markets.
Of course, then you will just have a slightly smaller mountain of sulfur for Menzie and the New York Times to complain about. And they will still be concerned with CO2.
The real problem with the Canadian tar sands is that they make so much petcoke that it is difficult to handle, as that mountain on the Detroit River shows. It is an order of magnitude more petcoke than most refiners are used to dealing with, and requires a much different material handling system. Instead of front loaders and trucks, they need automated cranes, conveyor systems, and trains. Lots of trains.
Refiners are outsourcing the petcoke handing to specialists, since it is outside their core competencies.
I keep reading this blog for only two reasons:
1) Dr. James Hamilton – kudos to you Sir, for you are thoughtful, mature and insightful and I have learned a great deal from you about economics!
2) The regulars here like CoRev, Steven and many others – again I have learned a great deal from you about economics!
Thank you to all of you!
Personally, I’d prefer this blog site even more if non-economist related subjects like rants against the Koch brothers be left to the Huffington Post (who do a great job at that). Of course, this is not my blog so my opinion is irrelevant but I am just making a suggestion. In any case I hope this blog gains strength and readership as it sheds a badly needed academic light on many important and obscure economic details that I suspect many folks struggle to grasp!
I would be interested to see how quick these plants using Tar Sands crude are in the process of adding or have plans to add Hydrocrackers
Steven Kopits: Hmm. I throw stuff away in my garbage can. Sometimes, at certain places, the garbage is sifted to remove recyclable goods, that can sometimes be sold. So there is some value to what I considered waste, but is it a lot, and is it worthwhile to process to sell? Maybe, maybe not, perhaps depending upon say a government regulation regarding recycling.
@ CoRev
You may think your estimates are “more rational” but pretty clearly they go against the overwhelming consensus of actual climate scientists, which is that “each of the last three decades has been significantly warmer than all preceding decades since 1850s”, that the warming of the climate system is “unequivocal”, that it is “unequivocal” also that sea level is rising, and that “Globally, CO2 is the strongest driver of climate change compared to other changes in the atmospheric composition, and changes in surface conditions. Its relative contribution has further increased since the 1980s and by far outweighs the contributions from natural drivers.” The above all per the IPCC.
As for recent studies of climate sensitivity, there has been no change in consensus there either. In fact one recent comprehensive summary of previous estimates, adjusting for methodological differences, by the PALAEOSENS project, concluded:
“Many palaeoclimate studies have quantified pre-anthropogenic climate change to calculate climate sensitivity (equilibrium temperature change in response to radiative forcing change), but a lack of consistent methodologies produces a wide range of estimates and hinders comparability of results. Here we present a stricter approach, to improve intercomparison of palaeoclimate sensitivity estimates in a manner compatible with equilibrium projections for future climate change. Over the past 65 million years, this reveals a climate sensitivity (in K W−1 m2) of 0.3–1.9 or 0.6–1.3 at 95% or 68% probability, respectively. The latter implies a warming of 2.2–4.8 K per doubling of atmospheric CO2, which agrees with IPCC estimates.”
In short, the IPCC, by including known forces and feedbacks into theoretical models, estimates that there is likely an equilibrium sensitivity of 2.0-4.5 degrees. A review of studies of the empirical data, estimating sensitivty from past climate changes, produces an estimate of 2.2-4.8 degrees.
Acerimusdux, using the consensus argument is a loser. Consensus is as likely “group think” as it is confirmation. When great gobs of grant money is involved there is high probability of “group think”.
You also argue the validity of the IPCC estimates. You are apparently unaware of the current IPCC draft AR5 comparison of their past temperature estimates. Here’s a blink comparator: http://m4gw.com/wp-content/uploads/2013/02/ipcc-ar5draft-fig-1-4.gif With a comment from Dr Spencer: “Temperatures have not risen nearly as much as almost all of the climate models predicted,” Dr. Roy Spencer, a climatologist at the University of Alabama in Huntsville, told Fox News January 28. “Their predictions have largely failed, four times in a row… what that means is that it’s time for them to re-evaluate.”
Which brings us to this re-evaluation from 14 IPCC authors: http://www.nature.com/ngeo/journal/vaop/ncurrent/index.html
You also claim my estimates are not consistent with the consensus. I have no estimate. What I have done is actually do the simple arithmetic that actually tells us the impacts of the current science. Few if any actually do the math, but just emote. The fundamental issue is that we are still talking about a total average global temp increase of just a fraction of a degree for the entire warming period since the Little Ice Age.
Paleo data clearly shows us that during this interglacial we have seen a long term, 10,000+ years, of cooling: http://jonova.s3.amazonaws.com/graphs/lappi/gisp-last-10000-new.png
Finally, you seem unaware of the divergence of temperature warming rate from that of the CO2 rate of increase. It is the hiatus and the growing divergence causing the sensitivity re-evaluation.
To me this chart better explains the EU economy than anything related to austerity. http://junksciencecom.files.wordpress.com/2013/05/ft-elec-prices.jpg?w=500
Remember Obama’s comment re: electricity cost sky rocketing? Well he was following the EU model, and see how well they have performed.
CoRev: Hah,hah. And most doctors believe vaccines work, but that’s just groupthink.
CoRev Dr. Roy Spencer, a climatologist at the University of Alabama in Huntsville
Dr. Roy Spencer is a pleasant dinner companion, although he seems to like overpriced restaurants on the east side of Huntsville; but in truth he is more of an engineer than a climatologist. His expertise is really in designing climate measurement devices He he tells interesting stories about rocket shots near the equator, which is clearly where his passion lies. When it comes to climate science my impression is that he is the one who is a victim of groupthink.
Regarding your link to the geoscience article, did you bother to check the footnotes? Here’s a hint…always be suspicious when the main references are by the same authors writing the article and all coming from prior issues of the same journal.
And while we’re on the topic of the geoscience journal, funny that you didn’t link to this article that finds no evidence for either a Little Ice Age or a Medieval Warming Period:
http://www.nature.com/ngeo/journal/v6/n5/abs/ngeo1797.html
Past global climate changes had strong regional expression. To elucidate their spatio-temporal pattern, we reconstructed past temperatures for seven continental-scale regions during the past one to two millennia. The most coherent feature in nearly all of the regional temperature reconstructions is a long-term cooling trend, which ended late in the nineteenth century. At multi-decadal to centennial scales, temperature variability shows distinctly different regional patterns, with more similarity within each hemisphere than between them. There were no globally synchronous multi-decadal warm or cold intervals that define a worldwide Medieval Warm Period or Little Ice Age, but all reconstructions show generally cold conditions between ad 1580 and 1880, punctuated in some regions by warm decades during the eighteenth century. The transition to these colder conditions occurred earlier in the Arctic, Europe and Asia than in North America or the Southern Hemisphere regions. Recent warming reversed the long-term cooling; during the period ad 1971–2000, the area-weighted average reconstructed temperature was higher than any other time in nearly 1,400 years.
Were it not for manmade global warming the earth would have almost certainly continued that long term cooling trend.
And check out Figure 4 that shows the temperature reconstructions.
And everyone agrees that warming over the last 130 years has been relatively benign…only about 0.8 degrees Celsius. The problem is that we are using up the earth’s ability to absorb CO2 and heat. It’s a virtual certainty that we will blow past 2 degrees warming within the lifetime of most kids alive today. And at least a tail probability of hitting 5 degrees warming within the lifespan of their grandchildren. We’re already at 400ppm.
Menzie, do you actually have a point? Do you dispute anything else I have provided?
2slugs, OMG, not the Pages paper?!? This has been so thoroughly panned, it is just one of the recent laughing stocks trying to make it into AR5. Try this: http://climateaudit.org/2013/05/09/pages2k-online-journal-club/
or this: http://climateaudit.org/2013/04/29/more-kaufman-contamination/
and maybe this: http://climateaudit.org/2013/04/28/gifford-miller-vs-upside-down-kaufman/
and… and… they go on.
One of the key proxies was from a withdrawn paper by Gergis. Withdrawn due to such poor processing that once reviewed by McIntyre, the blog fire storm embarrassed the journal.
Perhaps you can find the answer to Steve McIntyre’s question: “Can you explain the decision to label the article as only a “Progress Article”, rather than a Research Article?”
No LIA nor MWP?????? The evidence has grown substantially of a world wide influence. Just research some of the ice core data. You can start her: http://www.sciencedirect.com/science/article/pii/S0012821X12000659
or you can review the GISP data, which I have referenced many time over.
yopur own pull quote from “Pages” says: “The most coherent feature in nearly all of the regional temperature reconstructions is a long-term cooling trend, which ended late in the nineteenth century.” Nearly all of the Hockey Stick construction use the same statistical “trick” of appending high frequency, high resolution data onto low frequency, low resolution proxy constructions, and claim ?Voila? we show today’s temps, the end point of the most recent measurements, are higher than …. Even you can tell us how valuable is such a claim. In “Pages” the average proxy resolution period was ~300 years compared to the 130+ year temp measurement period. Convert the current period to the same resolution and compare. Oh, we can only approximate it since the temp period is less than 1/2 the proxy resolution period.
Look again at GISP or Vostok and make this claim: “Were it not for manmade global warming the earth would have almost certainly continued that long term cooling trend.” What was it that started the LIA, and what did mankind do to turn it off?
Your statement: “The problem is that we are using up the earth’s ability to absorb CO2 and heat.” is an utter amazement. This planet has had periods where CO2 was as high as 7,000PPM, and the temps were no more extreme than naturally occurs in many locations today. BTW, the oceans are a ~1,000 more capable of actually storing heat. How far are we from them boiling away?
My earlier reference, http://www.nature.com/ngeo/journal/vaop/ncurrent/index.html is the next game changer after climategate. It is the start of the back tracking. Before accusing Dr. Spencer of group think, you should take a second look at the blink comparator I provided. It is derived from the draft version of the next IPCC report, AR5.
Perhaps you would like to explain the current 16+ years of warming hiatus. Especially in light of our loss of “… the earth’s ability to absorb CO2 and heat.”
2slugs
did you bother to check the footnotes
Did you bother to check the authors credentials? Or should we just take your baseless trumpeting of climate disinformation as fact?
The authors include fourteen climate scientists, who are authors of IPCC AR5 WG1 chapters relevant to estimating climate sensitivity. If you criticize the authors of the paper, then you are criticizing IPCC authors.
funny that you didn’t link to this article
The results have already been debunked – Kauffman et. al. used corrupted proxies.
http://climateaudit.org/2013/04/29/more-kaufman-contamination/#more-17915
Were it not for manmade global warming the earth would have almost certainly continued that long term cooling trend.
I already pointed out your the flaw in your claim, but here it is again. You might take a look at it this time so you stop making a fool of yourself regarding your claim that man-made CO2 emissions explain the departure from the eons long cooling trend. The magnitude of the ‘modern warming period’ ie, 1990’s, relative to variation in the long term climate record, is less than that of a flea on the hind end of an elephant.
Over eons. Take a look at what you are missing. Huge departures from your cooling trend.
It’s difficult to see a “global” cooling trend even at 400K years – http://cdiac.ornl.gov/trends/temp/vostok/graphics/tempplot5.gif
At 65 million years you can see your cooling trend. http://img172.imageshack.us/img172/2464/tempvsco267m.png
You are basing your assertion regarding man’s influence on the modern warming period on a 2000 year reconstruction, less than the blink of an eye on a geologic timescale.
@CoRev
For a guy who claims so little regard for consensus opinion, you seem to be awfully determined to misrepresent it. You are the one who claimed that a rational estimate was 50% of warming from GHG and the rest from natural causes, who then falsely claimed a 16 year cooling “hiatus”, and that “reality of 16-23+ years without warming is starting to change scientific opinion”. I only referred to the IPCC to correct the record. There has been no such hiatus, and no such shift in opinion, and were there such, it would be reflected in a process designed to represent the “consensus”. So no, I am not guilty of group-think, you seem to be the one who is guilty of “group-fantasy”.
Further, the actual scientific sources you have referenced so far refute your assertion that there has been a cooling hiatus. The “game-changing” paper you reference only says that the rate of observed warming has declined over the last decade, not that warming has paused or that there has been cooling. Further, it only proposes a small change to TCR estimates, while cautioning that their estimate based on only a decade’s data is tentative.
Additionally, if you go to actual temperature records such as from GISS (from meteorological station data) or NOAA (from satelites), you will see that while the 1990 IPCC projection was slightly high, the 1995 projection was a dead-on bullseye. Actual temperature records suggest a better than .3 degree celsius or .5 degree fahrenheit rise since 1990.
In addition, while the 1990 forecast was a bit high for temperature for well known reasons (aerosol cooling, and the 1991 erruption of Mt. Pinatubo), it has also come in at least 50% too low for sea level rise. The main thing is these reports predicted warming and sea level rise, and warming and sea level rise occured.
Acer, this is what the data actually show: http://www.woodfortrees.org/graph/rss/from:1997/plot/rss/from:1997.9/trend/plot/uah/from:1997/plot/uah/from:1997.9/trend/plot/rss/from:1997.9/trend/detrend:-0.0735/offset:-0.080/plot/esrl-co2/from:1997.9/normalise/offset:0.68/plot/esrl-co2/from:1997.9/normalise/offset:0.68/trend
I guess you did not know that the data was readily available to graph. You could also go to this alarmist site to graph the data yourself: http://www.skepticalscience.com/trend.php
Be careful of using the GISS and NOAA data sets. The graph you showed is a NOAA graph of the satellite data, but NOAA actually acts as the world climate data repository. GISS is mostly land based stations with an extrapolation method to calculate polar data. Be sure you are referencing the GISS LOTI dataset. You were correct in citing the satellite data as it is most comprehensive.
Regardless, the data show the hiatus. It can not be derived from studies unless they are very current. Which, BTW, is what TJ and I are citing.
When you referred to the IPCC why did you not include the URL? At least we can then see how old is the data you reference.
You also referenced my “game changer” paper, without realizing the importance of the first paper dropping sensitivity by a 1/3, and, it was written by 14 IPCC authors.
16 years and counting and even Pachauri, chairperson of the Intergovernmental Panel on Climate Change, and Hansen http://www.columbia.edu/~jeh1/mailings/2013/20130115_Temperature2012.pdf have recognized it.
CoRev, “Menzie, do you actually have a point? Do you dispute anything else I have provided?”
Agreed, this is troll like blog behavior. Perhaps Menzie should condider to banish himself from his own blog!
Sadly, these kind of comments are ALL you will ever see from climate catastrophe scaremongers because when you examine the data they have no leg to stand on. 16 years of flat global temperatures and counting…and CO2 continues to rise throughout this period!
CoRev my “game changer” paper, without realizing the importance of the first paper dropping sensitivity by a 1/3, and, it was written by 14 IPCC authors.
First, the authors of the nature geoscience article have gone ballistic over that misinterpretation. As they point out, they are not saying the earth isn’t warming, only that it might not be warming as fast as previously thought. They also point out that previous estimates are within standard error bands of their estimate, so there may not be any statistically significant difference. What they are reporting is difference in the mean estimates, which is very different than your misinterpretation. They also say that all their new mean estimate implies is that problems we thought we would face in 2050 won’t hit us until 2065. Big deal. Second, regarding the MWP paper, even McIntyre admits that he cannot say whether his contagion critique actually would make a difference. Only that he doesn’t think it’s up to him to prove that it does. Given McIntyre’s history of botching the weighting of principal component models (MM2003 and MM2005), you might want to reserve judgment. M&M are the only ones who have found a MWP that is warmer than current global temps…and they only got that result because they made a mistake in the weighting variance. As to the so-called “hiatus,” there isn’t one. The oceans are still warming as much as they ever were. And surface temperatures are still increasing, albeit at a slower rate. But they should be cooling, not increasing.
Why do you keep linking to that stupid “trend” thing from your woodfortrees site? Again, try using real time series software with real tests. And why do you think it’s valid to begin a time series by selecting a well understood outlier as the first observation?
tj You are basing your assertion regarding man’s influence on the modern warming period on a 2000 year reconstruction
No, I’m basing my assertion on three points. The first point is that given only endogenous factors the earth should be cooling. Second, quantum mechanics predicts that CO2 molecules will vibrate when excited by certain wavelengths. This is the greenhouse effect even though it isn’t in anyway related to the way an actual greenhouse warms a room. If you increase the amount of CO2 in the troposphere, then heat will be retained rather than radiate away from the earth. So there’s absolutely no question that CO2 will increase global temperatures. And there’s also no question that more CO2 means higher temperatures. What’s unknown is the climate response factor. I can’t tell you how many cigarettes you’ll have to smoke before getting lung cancer; but I can confidently predict that if you are a heavy smoker you will probably come to a bad end. The third point is that the earth is getting warmer. Even CoRev admits that. He even admits that perhaps 50% of the warming is due to anthropogenic factors. But even if he’s right (which he isn’t), what does this say about the future when CO2 concentrations will be much higher than the 400ppm they are today? What will be his story then? That only 80% of the warming is due to anthropogenic forces? Does that even make sense?
Kevin Drum did a fine job of exploding the “hiatus” cherry picking in two simple pictures:
http://www.motherjones.com/kevin-drum/2012/01/lying-charts-global-warming-edition
And here is a second, more detailed set of pictures showing all the other hiatuses in the past century:
http://www.motherjones.com/kevin-drum/2012/10/lying-statistics-global-warming-edition
The whole century is mostly hiatus! Obviously that must mean there’s no warming at all.
2slugs,
You are right that more CO2 means more infrared absorption and more heat retained in the atmosphere rather than escaping to space. Nobody who understands the science denies that. What sceptics do NOT accept is that feedbacks amplify the CO2 warming. Data indicates the feedbacks are most likely negative and therefore they dampen any warming effect. Furthermore, other natural factors may be orders of magnitude more significant than any incremental CO2…for example more H2O from higher surface temperatures may actually increase cloud cover which reflects more energy to space (Albedo effect).
It is only the simple minded that still fully believe the words of the Global Warming Priests. If the “Priests” had been right we would have long since seen evidence of the significant warming they predicted but so far we have seen such slight warming that it could just easily be entirely due to natural variations and smart people smell a fraudulent scam perpetrated by those seeking taxpayer research funds, eco-groups (like WWF) who pay massive salaries to their execs and those trying to sell news., and finally politicians….all of these people have vested interests in the “end of the world” chicken little scaremongering.
2slugs, arguing by assertions, especially 2slugs assertion, is an absolute loss. You have ignored any evidence, and overridden it with your personal opinion. You are the only one crediting your personal opinion.
To answer your question re: why start with the last peak in temps? Because that’s when temps stopped rising. An amazing coincidence, eh?
16+ years and climbing. NOAA says a 15 year hiatus invalidates the models, and Dr Ben Santer says: “Our results show that temperature records of at least 17 years in length are required for identifying human effects on global-mean tropospheric temperature.” Accordingly a 17 year hiatus disproves the AGW theory?
2slugs you also asked why use the WFT source for graphing? Because I prefer using the actual official processed data shown in WoodforTrees, instead of redoing it from the raw source data. Oh, which is not available.
Joseph, can you tell us from which data set K Drum drew his data? What is his smoothing factor? Why did he start in 1912, one of the coolest years? Why are you citing such an old report (16 months), when there are many later? Who do we believe, Kevin Drum or Dr James Hansen? (See my earlier reference.)
BTW, it hasn’t warmed in the 16 months since the K Drum article, and looking at RSS data it is actually cooling. It is the basic misinformation you presented that continues the confusion.
2slugs you also assert: “As to the so-called “hiatus,” there isn’t one. The oceans are still warming as much as they ever were.”, but the data say: http://www.woodfortrees.org/plot/hadsst2gl/from:1997,5/plot/hadsst2gl/from:1997.5/trend
I already answered your assertion: “And surface temperatures are still increasing, albeit at a slower rate. But they should be cooling, not increasing.” with the RSS graph above.
No, I’m basing my assertion on three points. The first point is that given only endogenous factors the earth should be cooling.
And the most recent evidence suggests 1.3 degrees per decade. We are more than 50 years from the point at which CO2 started to rise from man-made emissions. By 2060 we will add another 0.65 degrees. At that point, man-made CO2 emissions will no longer be rising.
Climate scientists agree, that this small amount of warming will provide a net benefit to the earth’s population. It’s only the positive feedbacks, which are unobserved to this point, that create a problem. In fact, evidence is accumulating that negative feedbacks are more likely.
@CoRev
you might be right about global warming, but your link “proving” that oceans are not warming (woodfor trees) does not prove your point. just change the start point from 1997.5 to e.g. 1995 and you’ll find that there is a warming trend (if you start comparing from the hottest summer month in the hottest year, then of course you’ll find that there is cooling).
What does this have to do with the topic of Mezies blog?
Bellanson, ocean and atmospheric temps are nearly in lock step. CO2 is not! What is cause and what is effect?
Everyone is concerned about the short term recorded temperatures, but the evidence is clear that climate is cyclical. We can start with the glaciations, and then see multiple ~1,000- 1,500, another ~1/2 that period, and finally a clear ~60-65 year cycles within the interglacials. The 60-65 sinusoidal signal within the recorded data follows some of the ocean oscillations was only discovered a in past two decades.
Regardless, my response was to 2slugs that the oceans temps were still rising (at the same time as atmospheric temps were stable or falling.)
There is much we still do not know, but recent studies are starting to reduce the impact of CO2. Few still cite ACO2. Because of that changing science, Menzies story and implied concern makes this issue pertinent. Hopefully, this issue will disappear before we see the advent of a regressive carbon tax, which clearly place these issues within the realm of economics and politics. Are they separable?
Bellanson,
The same alarmist scientists that created the dubious climate models predicting catastrophic global warming are on record as saying that it would take 15 years of flat temperatures to disprove their theories. Well CoRev just showed that we have had more than 15 years of NO GLOBAL WARMING. So his point is entirely relevant no matter how much smoke and mirrors you play.
As for Menzie’s Blog, you obviously did not read the comment from Menzie above, “CoRev: Hah,hah. And most doctors believe vaccines work, but that’s just groupthink.” This comment suggests that Menzie believes in CO2 caused global warming as strongly as he believes in the efficacy of vaccines. Of course, this shows how little knowledge economists have of science. There is a large database of experimental results that strongly suport the efficacy of vaccines. Vaccines do work and it has been proved many times over. Polio and Small Pox eradication are good examples. However, there is NO experimental evidence to suport CO2 induced global warming. None Whatsoever. The whole theory is pure conjecture based on the very simple fact that CO2 is an infra-red absorber and the “catastrophic” element to this entirely conjectural scaremongering is that feedbacks amplify this small heat from CO2 infra-red absorption to make it significant. For all this global warming conjecture to be believed one actually has to make so so many dubious assumptions as to make the whole thing on par with other kinds of religious mumbo jumbo. To build upon Menzie’s medical analogy, Global Warming “science” is such bad science that it is akin to a belief in homeopathy.
Just on the possibility that graduate Economists understand enough about statistics, I provide a link to an interesting article.
http://www.bishop-hill.net/blog/2013/5/27/met-office-admits-claims-of-significant-temperature-rise-unt.html
In layman’s terms, the temperature rise since 1850 is NOT statistically significant. The entire fuss about man-made global warming is pure conjecture and the product of computer models. If one restricts oneself to looking at observational real temperature data (the science) one can ONLY conclude that there is NOTHING statistically significant going on and the variation since 1850 is most likely entirely natural and nothing to do with a specific man-made CO2 forcing.
@ CoRev
The Hansen paper you are citing now says only that the 5-year mean global temperature has been flat for a decade. Further, it says:
“Indeed, the current stand-still of the 5-year running mean global temperature may be largely a consequence of the fact that the first half of the past 10 years had predominately El Nino conditions, while the second half had predominately La Nina conditions (Nino index in Fig. 1). Comparing the global temperature at the time of the most recent three La Ninas (1999-2000, 2008, and 2011-2012) , it is apparent that global temperature has continued to rise between recent years of comparable tropical temperature, indeed, at a rate of warming similar to that of the previous three decades.”
Also, thanks for the link to the Skeptical science site, but none of the 8 data sets there show a 16 (much less 23) year cooling trend either. The best you can do there is that ONE of those, RSS, will show a meaningful 15-year negative trend if you start in 1998, which would be an obviously invalid statistical approach, that being a peak year due to El-nino effects.
If you start in 1997, you get uptrends, and if you start in 1996 or 1995, even larger trends, and 1994, larger trends still. Even using 1997, which is still a bit above the prior trendline, so probably provides an underestimate here, I get through 2012 in degrees Celsius per decade:
Land/Ocean
+0.088 GISTEMP
+0.053 NOAA
+0.012 HADCRUT3
+0.059 HADCRUT4
Land
+0.182 BEST
+0.165 NOAA
Satellite
+0.004 RSS
+0.091 UAH
In short, it takes some extreme cherry picking to interpret the data as a 15+ year hiatus, and even if you are looking at the pause in warming since 2001, there really hasn’t been any cooling, just a pause at a relatively high temperature; every year since then is amongst the 13 hottest on record, and even 1998s highs were exceeded in both 2005 and 2010.
The IPCC reports never attempted to forecast year-to-year climate changes. The longer term trends they have forecast seem to have been accurate, and those trends seem to still be intact. Finally, I highlighted the TCR result in the Energy Budget Constraints paper because no one is going to put much weight on a ECS estimates based on only a decade of data. For TCR at least, you may not have much choice other than to estimate based on limited data, but there is really nothing that new there. Energy balance models have always produced estimates on the low side. Other types of estimates are more often on the higher end. This isn’t likely to change the overall IPCCs sensitivity estimate of 2-4.5 degrees, which already accounts for these kind of results.
acerimusdux, I’ve shown the 16+ years many times now, http://www.woodfortrees.org/graph/rss/from:1997/plot/rss/from:1997.9/trend/plot/uah/from:1997/plot/uah/from:1997.9/trend/plot/rss/from:1997.9/trend/detrend:-0.0735/offset:-0.080/plot/esrl-co2/from:1997.9/normalise/offset:0.68/plot/esrl-co2/from:1997.9/normalise/offset:0.68/trend . Notice the divergence of CO2 from global temps.
1997 – 2013.4 is 16.4 years. The OLS calculation is from 1997.9 to 2013.4 (current) 15.5 years.
BTW, I think your bias let you ignore the importance of Hansen’s El Nino/la Nina comment driving the temps. What happened to the magical molecule, CO2? Even he admits ~10 years of hiatus.
You also make this claim: “…which would be an obviously invalid statistical approach, that being a peak year due to El-nino effects.”. You also claim that that it is cherry picking to start form the previous high to current date to estimate how long temps have been until the next change. If you have another way to calculate the time frame, tell us how.
Yes, RSS is the dataset showing the current longest hiatus/cooling. There is a reason for that. It is the most stable and widest coverage of the data sets for the current period. GISS, NASA’s, uses extrapolation to cover the poles. Hadley does not cover the poles. UAH, the other satellite dataset, has undergone satellite failure issues and its processing is being upgraded. Land temps are not global and are higher temps overall.
Your reliance on the IPCC reporting is dangerous. Their estimates have been off, and even the 1st order draft of the newest report underdevelopment recognized that reality was outside the IPCC estimates. Here is a blink graph of their various attempts: http://wattsupwiththat.files.wordpress.com/2012/12/ipcc-ar5draft-fig-1-4.gif?w=640 I don’t think trusting an organization that is nearly always wrongly estimating.
The betting is on whether the actual graph from which this blink was derived remains into the final version of AR5. If not, then your guess may be correct: ” This isn’t likely to change the overall IPCCs sensitivity estimate of 2-4.5 degrees, which already accounts for these kind of results.”
@CoRev
Yes, you’ve shown that graph many times now, but I think most anyone who looks at it will still see the trend, and will see the manipulations of the data. 1998 was clearly a one year divergence from the trend. You’ve added an absurd offset there to match the CO2 data up with that one year outlier, rather than with the long term trend.
There are other things I disagree with there, including using partial year data; you do realise there is seasonal variation, don’t you? Why would you calculate trends on data running from September one year to April in another?
But, even starting with that date, and putting that offset back around where it belongs, and removing the arbitrarily chosen trend lines:
http://www.woodfortrees.org/graph/rss/from:1997/plot/uah/from:1997/plot/esrl-co2/from:1997.9/normalise/offset:0.20/plot/esrl-co2/from:1997.9/normalise/offset:0.20/trend
It’s very hard to see anything but brief divergences there from the long term trend.
As for the upcoming IPCC report, the link you are showing takes an errent graph from it, further misinterprets it, and then overlays lots of innaccurate information not included in the report. The sensitivity estimate I mentioned is included in the report. The report is a draft at this point, so presumably they could modify either.
My guess is they are more likely to modify the graph which is being misinterpreted, since as I mentioned above, the previous IPCC estimates have been accurate (especially 1995) and this would be clear if they more properly showed those projections as beginning with 1990’s trend, rather than 1990’s annual temperature.
In any case, this is probably enough scientific debate for now for an economics blog, especially when we both know that there really is very little debate in the scientific community on the issues being discussed.
Acer, are you sure you’re not 2slugs in disguise? The quality of your commenting seems similar.
1) You claim: “1998 was clearly a one year divergence from the trend. Y ” but reality is different: http://www.woodfortrees.org/plot/hadcrut3gl How many one year divergences do you see? Is 1997-1998 even the largest?
2) You then go on about the offset I used then do an even worse offset in your own graph. Mine was to the RSS trend to show a clear picture of the trending divergence. Yours is to the monthly data offset to the lowest point to hide any divergence. And you claim your cherries are sweeter with this: “It’s very hard to see anything but brief divergences there from the long term trend.”?
3) You also misuse terms such as “long term” trend. You showed only a very short term trend.
Even the current measured temperature record is considered short term. Two recent studies attempting to show a hockey stick, pages2k referenced above is one,use low volume low resolution proxies with time frames in the ~2-3 centuries append that measured, high frequency, high resolution temperature data to get the large rise. Most statisticians would say that’s a bad practice. Climatologists believing in warming think its just fine. It shows their unprecedented story.
Remember, this is both an economic and political issue. Science is being misused to make and support an economic and political agenda. That is sad.