Not that I’m complaining. But seriously, it’s far past the “day one” of the new Administration when Donald Trump promised China would be declared a currency manipulator.
The Treasury’s report was released last week. Treasury uses the following criterion:
Pursuant to Section 701 of the Trade Facilitation and Trade Enforcement Act of 2015, this
section of the Report seeks to identify any major trading partner of the United States that
has: (1) a significant bilateral trade surplus with the United States, (2) a material current
account surplus, and (3) engaged in persistent one-sided intervention in the foreign
exchange market. Section 701 requires data on each major trading partner’s bilateral trade
balance with the United States, its current account balance as a percentage of GDP, the
three-year change in the current account balance as a percentage of GDP, foreign exchange
reserves as a percentage of short-term debt, and foreign exchange reserves as a percentage
of GDP. Data for the most recent four-quarter period (July 2016 to June 2017, unless
otherwise noted) are provided in Table 1 (on p. 15) and Table 2 (below).
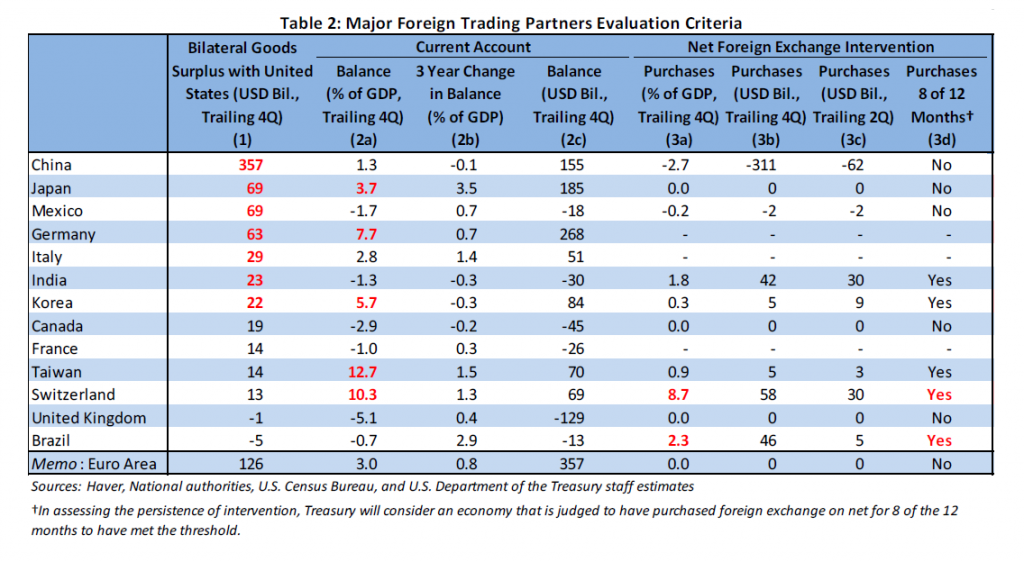
These translate to $20 billion bilateral trade surplus with the US, CA surplus of 3% of GDP, and forex intervention of 2% worth of GDP. The table below shows how various countries stack up:
Notice that seven countries pass the bilateral trade balance threshold – but I must confess that this criterion has never made sense to me.
The more plausible CA/GDP threshold is exceeded for Japan, Germany, Korea, Taiwan and… Switzerland. And in terms of magnitude of FX intervention (the measure that most closely matches what the textbook would characterize as “manipulation”, in my opinion), Switzerland and Brazil meet the 2% of GDP threshold. Interestingly, China doesn’t meet either of the latter two thresholds.
Another perspective on misalignment (separate from “manipulation”) is provided by the price criterion. One version of the price criterion is that the exchange rate is at such a level that purchasing power parity is violated, then a currency is misaligned. However, a well known empirical phenomenon is that the price level is lower in lower income countries — the “Penn effect”.
Recently, Yin-wong Cheung, Xin Nong and I implemented a panel time-series cross-section analysis of the Penn effect (forthcoming in International Finance; discussion of working paper in this post), in which we concluded that as of 2014, the Chinese currency was not undervalued, and could have been actually been overvalued. That result was obtained using World Bank data, which lags considerably.
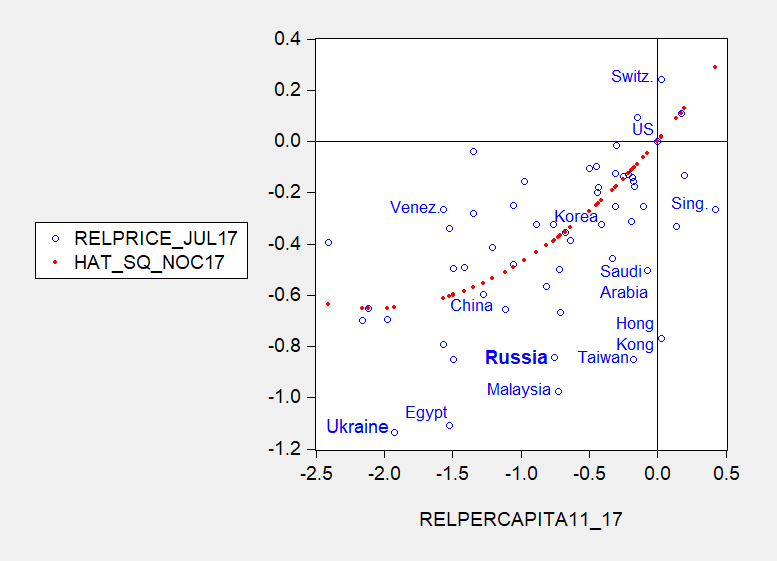
What about in 2017? I use Big Mac data for July 2017, and estimated real per capita income for 2017, to generate the following graph.

Figure 1: Log relative price of Big Mac against log relative per capita income in constant 2011 PPP prices, for July 2017 (all relative to US). Red dots are quadratic fit with no constant. Source: Economist, IMF World Economic Outlook October 2017 database, author’s calculations.
The red line is a quadratic fit imposing a no-constant specification for July 2017. According to this price approach, the Chinese yuan was only 4.3% undervalued (in log terms).
A few more observations.
- The Swiss franc is overvalued by 22.1%
- I If China were to be declared a currency manipulator on this basis, Russia would also need to be declared one, as the estimated misalignment is 45.7% undervaluation.
- On the other hand, many of the countries Brad Setser recently tagged as worthy of attention — Malaysia, Taiwan, Hong Kong, Singapore — have undervalued currencies. (Strangely, Korea does not have a substantially undervalued currency).
By the way, how does Russia stack up on the Treasury’s criteria? The current account is forecasted to by the IMF’s World Economic Outlook to be 2.8% of GDP in 2017 (not far below the 3% threshold), and reserve accumulation about 1.2% of GDP, according to the 2017 IMF Article IV report.
So, if Donald Trump ever does “pull the trigger” to declare China a currency manipulator, it would only seem appropriate to declare Russia one as well…

It’s so easy folks…
And yet USDCNY is down approximately 5% for the year. POTUS’ threats accomplished something, it seems. It’s a bargaining game, not a market.
formereconomist: Trade weighted dollar is down 8.4% since beginning of year. So I’d say if the effort is to drive up the value of the CNY, POTUS is underperforming.
True, CNY has underperformed some other currencies, but:
First, you have to volatility-adjust your comparisons. Annualized historical vol on USDCNY is about 3% for the last year. Compare that to roughly 15% on MXN or 8% on EUR, and you will see the vol-adjusted 5% looks a bit better.
Second, the CNY is not a market-determined fx rate. Not with those capital controls and trillions of dollars of finely managed reserves. It’s a policy lever set every day by pboc, just as frb is setting fed funds rates (and now the quantity of excess reserves as well). So analogies of CNY to exchange rates that are at least somewhat determined by market forces are somewhat weak. This is what I meant when I said it was a bargaining game, not a market.
Last, the major movers this year vs USD had idiosyncratic drivers (e.g. ECB catch-up, or lack of already-priced-in NAFTA-pocalypse). They were driven by the foreign side, not the USD side, of the cross. One is hard-pressed to come up with the China-specific story to match, considering GDP and FAI look about the same as last year.
Just curious: Why quadratic? I’m having trouble coming up with a good reason why you’d have a quadratic dependence, which leads to some weird predictions (e.g. really, really poor countries should have an inverse Penn effect, and really, really rich ones would have obscenely expensive Big Macs).
Just by eyeball, the only thing that makes that look like your quadratic rather than a linear are the 4 leftmost data points.
F: See the link to the forthcoming Cheung-Chinn-Nong paper; we cite Hassan F. (2016). The price of development: The Penn–Balassa–Samuelson effect revisited. Journal of International Economics, 102, 291–309.
The issue is whether the quadratic leads to crazy implications over the support. Haven’t done a formal test on Big Mac data, but have in the PWT and WDI datasets, which reject linearity, and also support U-shaped fit.
My response to your next post:
Here are where my numbers come out:
Assumptions
– Nominal GDP: $19 trillion
– Effective corporate tax rate: 18.6% (equal to 35% nominal)
– Proposed new tax rate, nominal, 25%
– Corporate taxes as share of GDP: 1.6%; in dollars, cc $300 bn
Thus,
1/(1-t) = 1.23, not 1.5, because effective, not nominal, rates would seem to matter in terms of economic effect
A reduction in the tax rate to 25% results in an assumed effective tax rate of 13.3%, and a reduction in total corporate taxes paid to cc $215 bn.
Thus, tax savings equal $85 bn on initial taxes paid of $300 bn, which increases profits by 5.3% immediately, with valuations presumed to follow pari passu (ie, DOW to 24,600).
Labor constitutes 70% of the economy, which translates into $13.3 trillion. The wage effect is 1.23 x the savings of $85 bn, or $105 bn. This increases workers wages, to the extent such savings affect workers as a class (as opposed to the workers in question at those companies) by increasing wages 0.8% over the long run.
Thus, corporations see an immediate increase in profits of 5.3% and workers see an eventual gain of 0.8%.
As a practical matter, it looks to me like Summers is right. For corporations, there is an immediate benefit to the bottom line. For workers, there is some gain over time which will essentially be washed out as noise.
Or do I have this wrong?