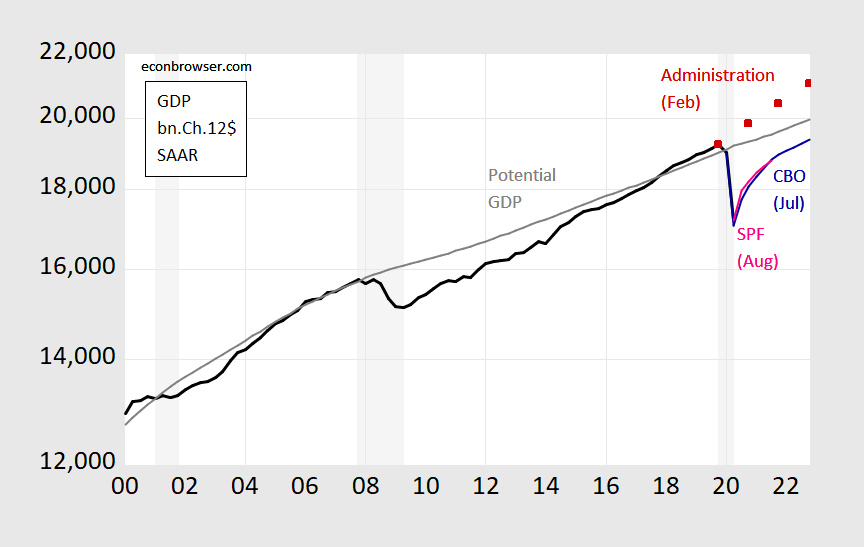
As I was prepping slides for my macro policy course, I generated this graph:
Figure 1: GDP as reported (black), Administration official forecast as of August 2020 (red squares), CBO projection as of July 2020 (blue) and Survey of Professional Forecasters mean August 2020 forecast (pink), CBO estimate of potential GDP (gray), all in billions of Ch.2012$ SAAR, all on a log scale. NBER defined recession dates shaded gray; assumes current recession ends 2020Q2. Source: BEA 2020Q2 advance, White House, CBO Economic Outlook (July), Survey of Professional Forecasters (August), NBER, and author’s calculations.
Notice the sharp drop in GDP in Q2; this drop is certainy steeper and deeper than the Great Recession’s dive. The rebound is forecasted to be steep as well, by both the Congressional Budget Office and the Survey of Professional Forecasters; however, the recovery is also forecasted to slow to a pace that implies no recovery to pre-recession levels until sometime in 2022.
The Administration’s current forecast (which is the same as the FY2021 budget forecast issued in February, since the Administration declined to update their forecast) is clearly nonsensical. It was implausible even before the Covid-19 recession. But retaining the FY2021 forecast is merely the latest case of Trump engaging in delusional thinking (or at least it’s delusional for anybody to believe what the Administration says).
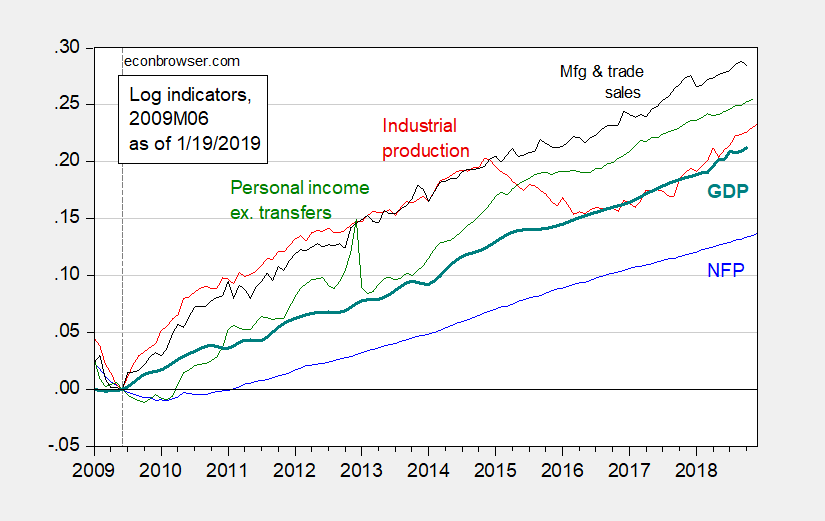
It’s also interesting to compare the economy’s situation to when I last taught the course (Spring 2019). The economy was plugging along just fine (albeit after blowing a whole in the fiscal accounts with the Tax Cuts and Jobs Act).
Figure 2: Nonfarm payroll employment (blue), industrial production (red), personal income excluding transfers in Ch.2012$ (green), manufacturing and trade sales in Ch.2012$ (black), and monthly GDP in Ch.2012$ (teal), all log normalized to 2009M06=0. Source: BLS, Federal Reserve, BEA, via FRED, Macroeconomic Advisers, NBER, and author’s calculations.
That being said, the yield curve was tending toward inversion.
Figure 3: 10 year-3 month Treasury yield spread (blue), 10 year-2 year spread (red), both in %. NBER defined recession dates shaded gray. Source: Federal Reserve via FRED, NBER and author’s calculations.
Addendum, 8/26:
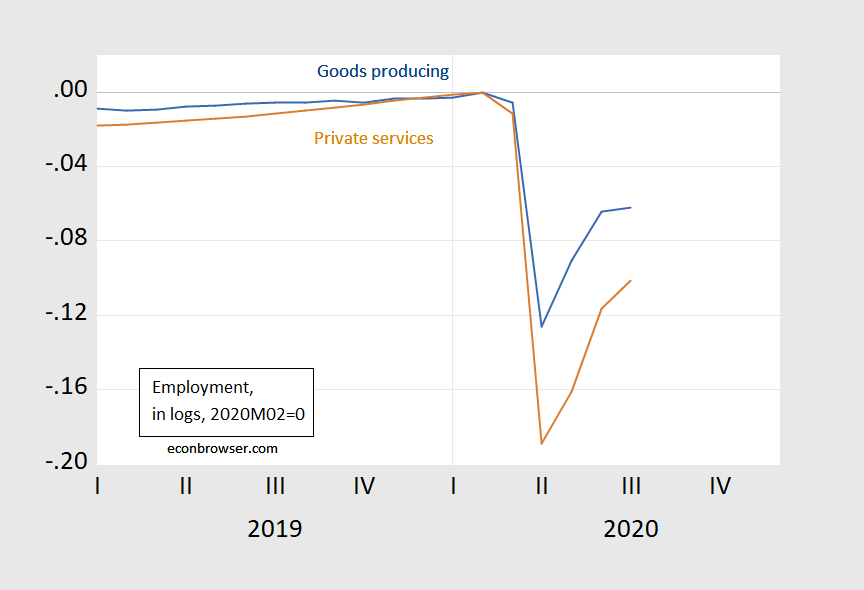
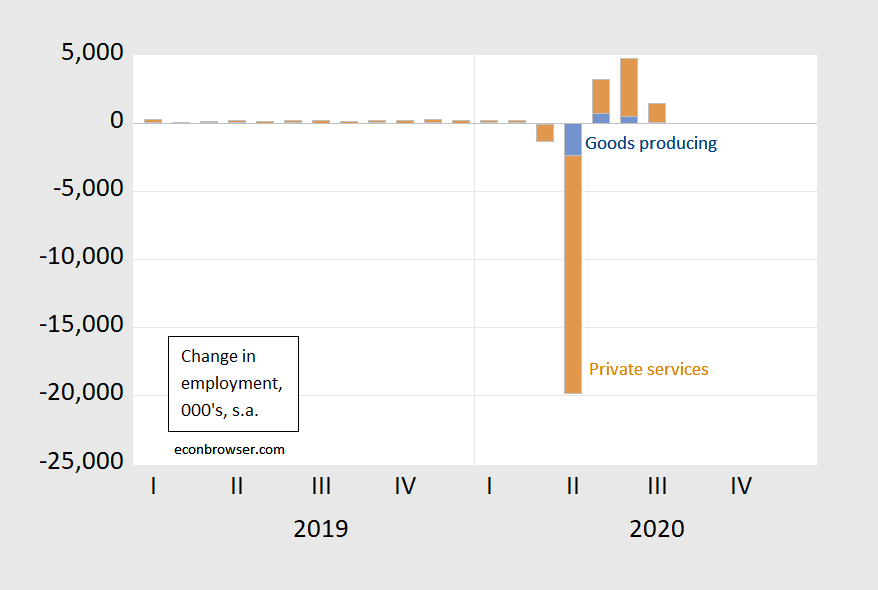
This recession, in addition to breathakingly fast and deep, has disproportionately hit services — a sector not typical the center of the downturn.
Figure 4: Goods producing employment (blue), private services employment (brown), both in logs 2020M02=0. Source: BLS, and author’s calculations.
Figure 5: Change in goods producing employment (blue), in private services employment (brown), 000’s, s.a. Source: BLS, and author’s calculations.
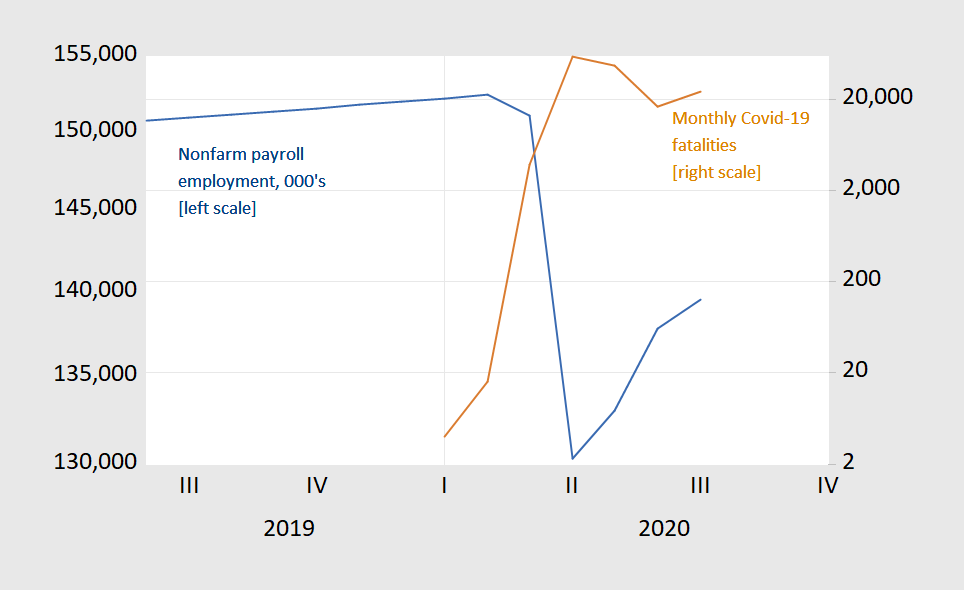
The recovery from this recession should be very quick, given the depth of the downturn. But the source of the downturn — a pandemic which induced a partial nationwide shutdown — has not been controlled, so as economic activity rises, it induces accelerated pandemic spread. Hence, the recovery has slowed as fatalities re-surged.
Figure 6: Nonfarm payroll employment (blue, left log scale), and monthly Covid-19 fatalities (brown, right log scale). Source: BLS, CDC and author’s calculations.
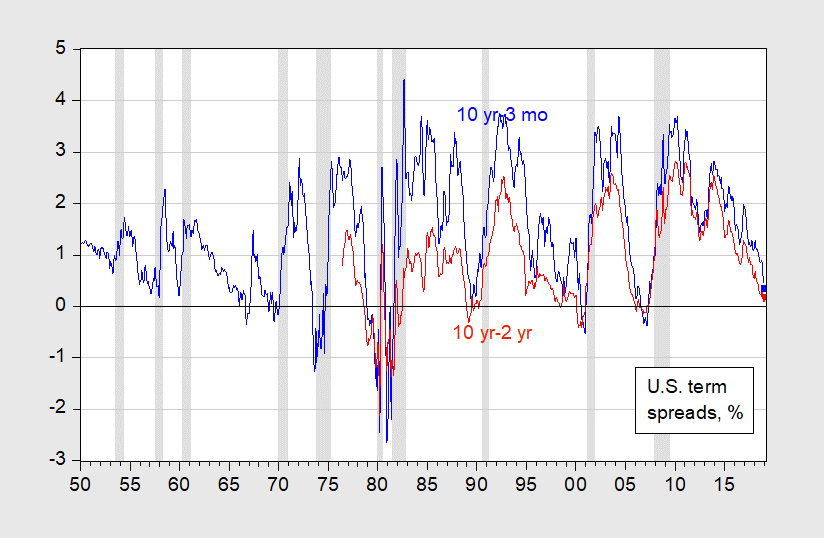
And in fact the yield curves did invert. The pandemic just made a recession far deeper.
Love how the Administration forecast of real GDP contrasts to actual real GDP. Then again any forecast made by a team that includes Kudlow is doomed to be far off from reality.
One of the key variables to watch is average hourly earnings.
During the great recession when we had double digit unemployment my
wage equation called for a decline in average hourly earnings. It did not
happen of course as wage gains were sufficient to keep wage growth positive.
After a few years of an improving economy and lower unemployment my wage
equation started to rise again just in time to catch the actual rise in
average hourly earnings after 2010.
This condition is reemerging with unemployment again greater than 10%
and my wage equation again calling for falling wages. If we repeat the
experience of the great recession I would expect to see wage stagnation
reemerge as the way the system works out the conflict between high
unemployment and labor’s resistance to actual wage cuts.
Off topic but I could not resist as this is from Don Cokehead Trump Jr.:
https://talkingpointsmemo.com/news/donald-trump-jr-2020-rnc-denies-cocaine-allegations
Donald Trump Jr. on Wednesday morning managed to throw Hunter Biden under the bus while hitting back at allegations of cocaine use during his RNC speech. After going on a tear against the media during an appearance on “Fox and Friends,” Trump Jr. was asked about the media’s concern with his “glassy” eyes during his RNC speech on Monday night. Trump Jr. laughed to himself before providing a sarcastic answer. “Well I guess there must have been something with the lighting,” Trump Jr. said. Trump Jr. then referenced the speculation on social media that arose during and after his RNC speech, which included jabbing the son of Democratic presidential nominee Joe Biden who was at the center of the Ukraine scandal that led to President Trump’s impeachment. “But they started doing this trending thing, ‘Donald Trump Jr.’s on cocaine’ and all of that,” Trump Jr. said Wednesday. “I said no, no, you have me confused with Hunter Biden. It was pretty ridiculous.”
I would say this is Jr. being the spoiled little baby that he has always been. But maybe Jr. bought his cocaine from Hunter Biden. Yea – this is the usual crap one wakes up to on Fox and Friends.
Amazing, Menzie, your yield curve graph forecast the pandemic recession! Wow!!!
Barkley Rosser: Everybody else’s yield curve was about to invert back in January 2019; the point is that about half of the economists said that — because of the reasonable view that the term premium had shrunk or gone negative — inversion was no longer a good predictor. Had there been no pandemic, maybe they would’ve proved right in this case…
Indeed, Menzie, and I am assuming that you saw the exclamation points and understand that they meant I was at least partly being humorous, given all that, but just in case there are readers here who did not catch it, I was being at least partly humorous. I mean, even in the days when they really were strong predictors of recessions, they cannot predict pandemics, even if we have an old coauthor of Menzie’s (Navarro) who thinks he knows more about health than do medical scientists.
Barkley Rosser: Oops, sorry. I have a hard time lightening up these days… good point!
I don’t read the literature enough, or even the regular business news in totality, so I might have missed it, but I thought Brainard was one of the first people to mention this, and at the time it really caught my eye as I thought it was a pretty keen observation. The type of foresight Barkley dreams of exhibiting by pecking at others’ comments.
https://www.federalreserve.gov/newsevents/speech/brainard20180912a.htm
https://www.bloomberg.com/opinion/articles/2018-06-08/fed-could-get-more-aggressive
She may have been wrong on the eventual hiking of rates (i.e. the potential of inflation in 2018), but she nailed it on how to read inversions in the 2018 context, and unless someone else mentioned this before her that I am unaware of (which may very well be the case), I think Brainard deserves credit for this observation.
The key driver of the 2000’s expansion was subprime debt so the end was near. With dead real profits and inflation rising in a late stage manner, growth would have stalled out in 2020. Runs on the subprime banks would have started in 2021 during the recession. I suspect that was just delayed……..bhahahah.
The Kenosha shooter is Kyle Rittenhouse:
https://www.jsonline.com/story/news/2020/08/26/kyle-rittenhouse-charged-kenosha-protest-shootings-militia/5634532002/
Kyle Rittenhouse, the 17-year-old charged with shooting three people — two of them fatally — during a Kenosha protest Tuesday evening, thought of himself as a militia member trying to protect life and property, according to videos, interviews and social media posts. Video shot in the hours before the shooting shows Rittenhouse hanging out with older armed men, who tell the reporter they’re protecting a car lot. Rittenhouse then introduces himself as Kyle. He also did a video interview with the Daily Caller in front of a boarded up building. “People are getting injured and our job is to protect this business,” Rittenhouse says in the clip. “And my job also is to protect people. If someone is hurt, I’m running into harm’s way. That’s why I have my rifle; I’ve gotta protect myself obviously. But I also have my med kit.” Among the armed men in the streets Tuesday was former Kenosha Ald. Kevin Mathewson, who is active in a group known as the Kenosha Guard. Mathewson posted a video selfie of the scene near the Kenosha government center Tuesday night. He did not return a phone message Wednesday. Earlier in the day, the Kenosha Guard created a Facebook event called “Armed Citizens to Protect our Lives and Property.” The invite was picked up by the far-right website Infowars. The Facebook page, which was taken down late Wednesday morning, calls Kenosha Guard a social club. But a post signed “Kenosha Guard Commander,” written to Kenosha Police Chief Miskins, says this: “As you know I am the commander of the Kenosha Guard, a local militia. We are mobilizing tonight and have about 3,000 RSVP’s. Our effort has made the national media. I ask that you do NOT have your officers tell us to go home under threat of arrest as you have in the past. We are willing to talk to KPD and open a discussion. It is evident, that no matter how many Officers, deputies and other law enforcement officers that are here, you will still be outnumbered.” Miskins could not be immediately reached Wednesday. But another video clip shows Rittenhouse with members of the group shown earlier getting bottles of water from a law enforcement officer in an armored vehicle, though they are clearly civilians in violation of the curfew order. The officer thanks them for their help before driving away. “We appreciate you guys,” he says. “We really do.” On Wednesday, before the Kenosha Guard Facebook page was taken down, there was a post suggesting the shootings were not connected to its activity. That prompted a flood of replies, many in support of the shooter, suggesting the victims deserved it for looting and vandalism or that the shooter acted in self-defense. But others were very critical of the Kenosha Guard, accusing the group of instigating the teenager’s involvement, whether or not he was a formal member. “Shame on you Kenosha guard. You allowed a 17 year old to join you from out state and now he may pay for those mistakes for the rest of his life in a prison cell. SHAME ON YOU!!!!!,” wrote one woman. nother militia group, called the boogaloo, also attended all three nights of protests, according to Justin Mishler, a self-proclaimed member who lives Belvidere, Illinois. About a dozen armed boogaloo members were at the Kenosha protests Sunday, about two dozen Monday and more Tuesday, he said. Their purpose was providing security and protection for businesses, he said. Mishler said the Kenosha Guard is not affiliated with boogaloo. “It sounds like a group that’s probably a day old or less,” he said, adding that neither he nor fellow boogaloo boys know Rittenhouse. “He’s not one of us,” Mishler said of Rittenhouse.
I get that Trumpians like Sammy will try to blame this mess on Antifa but it was someone helping this Kenosha Guard and their good buddies from the Boogaloo that was behind this violence.
Trump called for slowing the testing down. The CDC complies:
https://www.webmd.com/lung/news/20200826/cdcs_new_covid_testing_guidelines_trigger_concerns
Experts are alarmed about revised U.S. Centers for Disease Control and Prevention guidelines advising that people who don’t have symptoms of COVID-19 don’t need to be tested, even if they’ve recently been exposed to the new coronavirus.
The guidelines were quietly changed this week and prompted concern among infectious disease professionals, The New York Times reported.
They noted the importance of identifying infected people in the short period of time immediately before they develop symptoms and may be most contagious.
About half of coronavirus transmissions can be traced back to people in this pre-symptomatic stage, models suggest.
Experts warned that the revised CDC guidelines could delay treatment and lead to wider spread of the coronavirus.
“This is potentially dangerous,” Dr. Krutika Kuppalli, an infectious disease physician in Palo Alto, Calif., told the Times. Limiting testing to people with obvious symptoms of COVID-19 means “you’re not looking for a lot of people who are potential spreaders of disease,” she said. “I feel like this is going to make things worse.”
I thought this was pretty well done. And it’s not just a problem in Houston.
https://www.nytimes.com/2020/08/17/opinion/coronavirus-schools-teachers.html
Ask your students about the counterfactual: what if there had been no Cares Act in late March and no stimulus? Going forward, how might the trajectory look if there is no follow-on stimulus? And what if by some miracle, there is?
Some interesting comparisons:
• https://fred.stlouisfed.org/series/GDPC1/
• https://fred.stlouisfed.org/series/CLVMNACSCAB1GQUK
• https://fred.stlouisfed.org/series/CLVMNACSCAB1GQFR
• https://fred.stlouisfed.org/series/CLVMNACSCAB1GQDE
So, what does that tell us about the unique U.S. economic experience with COVID-19 (you can adjust the sliders for comparable timeframes). That’s history. Any projections that compare these nations? Oh, here is Sweden. https://fred.stlouisfed.org/series/CLVMNACSCAB1GQSE
Bruce Hall: Please see this post, and associated graph.
Yup that’s Sweden and Norway. Now then….
Your point was ??? Oh yea – the standard Bruce Hall comment. A lot of unrelated data with absolutely no point. No point at all. OK – Bruce, we’re waiting. What’s that? Crickets, crickets.
I know that economists like to look at annualized rates when discussing real GDP, but for the sake of one less calculation, I just took Q1 v. Q2 absolutes and rounded the percentages since the absolutes are subject to change:
From St. Louis FRED
U.S. 19.0 17.3 -9% ($ trillions)
U.K. 0.463 0.369 -20% (trillions in national currency)
France 0.528 0.455 -14% (Euros trillions)
Germany 0.731 0.567 -10% (Euros trillions)
(billions in national currency)
Sweden 1,078 986 -9%
Norway 757 745 -2% Note: Norway’s population is about 5.3 million and a large part of the national income is through state owned oil and gas (Equinor). Not exactly a dynamic economy, but stable and pedestrian, so yes, Norway is an exception.
I’ll make it easy: https://www.business-standard.com/article/international/eurozone-economy-suffers-record-drop-of-12-1-during-covid-19-lockdown-120073101336_1.html
Now, about the projections for Q3. And how did Trump’s U.S. policies cause large European economies to do so badly?
Bruce Hall: Gee, take a look at Denmark, Netherlands, Finland, if you don’t want to look at Norway. They’ve all got Q2 declines smaller (in absolute value) than Norway.
Is geographic proximity the factor for economic change that’s more important? Well then, why is Minnesota’s COVID-19 death rate twice that of North and South Dakota?
https://www.statista.com/statistics/1109011/coronavirus-covid19-death-rates-us-by-state/
… and why did Minnesota’s GDP decline almost twice that of South Dakota and considerably more than North Dakota’s? And more than twice that of Nebraska?
https://www.bea.gov/system/files/qgdpstate0720.png
Ridiculous comparisons? Well, Gee, they’re neighboring states. Couldn’t have anything to do with the makeup of their economies? But, regardless, you focused on Sweden rather than the large economies in Europe more comparable to the U.S. in makeup (not size, let’s get that out of the way).
But
“Norway’s population is about 5.3 million and a large part of the national income is through state owned oil and gas”.
Two problems with such a short dismissal. That Norway is smaller than say the US has nothing to do with percentage changes. And I guess Bruce “no relationship to Robert” Hall does not know that oil prices plummeted.
Hey Bruce – we await your next embarrassingly stooooopid comment.
And how does the BEA get these numbers?
https://www.bea.gov/news/2020/gross-domestic-product-2nd-quarter-2020-second-estimate-corporate-profits-2nd-quarter
FYI, this month’s GDP revision produced an anomaly that occurs quite infrequently…when i reviewed the BEA’s data yesterday, i noticed at PCE goods had fallen in Q2, but that PCE goods had ADDED fractionally to GDP, which shouldn’t happen….so i emailed Lisa Mataloni, the GDP maven at the BEA, with the following query:
her response:
not sure i understand what they’re doing there, but its apparent my simplistic thinking that each change in a real component translates directly into a change in real GDP is incorrect…
The fact that Mataloni (which BTW, I love mixed with my ravioli) replied and recognizes it happened at least shows some transparency, which seems institutionally healthy compared to many government agencies (or even private corporations) we could list right now. Not defending what could be an error, just saying…….