Personal income and consumption for January, and manufacturing and trade industry sales for December, were released last week. The PCE deflator for January was also released, rounding out January inflation numbers.
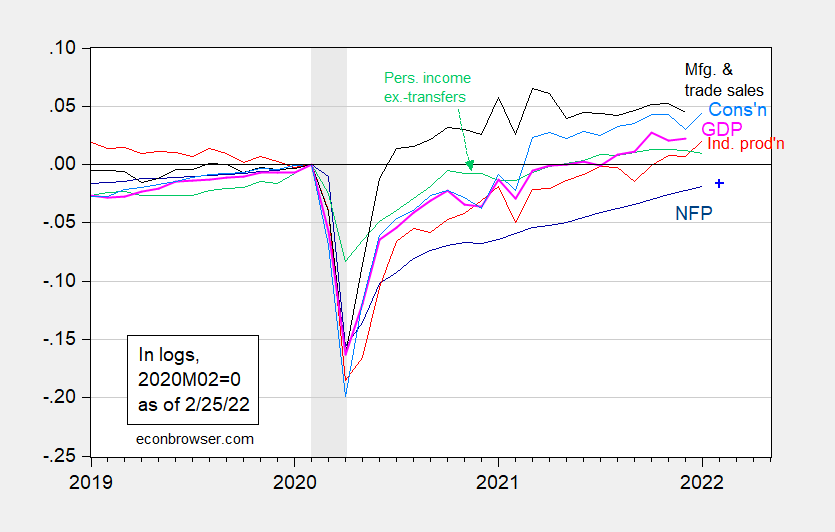
Figure 1: Nonfarm payroll employment (dark blue), Bloomberg consensus for February NFP (blue +), industrial production (red), personal income excluding transfers in Ch.2012$ (green), manufacturing and trade sales in Ch.2012$ (black), consumption in Ch.2012$ (light blue), and monthly GDP in Ch.2012$ (pink), all log normalized to 2020M02=0. NBER defined recession dates, peak-to-trough, shaded gray. Source: BLS, Federal Reserve, BEA, via FRED, IHS Markit (nee Macroeconomic Advisers) (2/1/2022 release), NBER, and author’s calculations.
Consumption growth continued, even as personal income excluding transfers fell.
PCE inflation (m/m) rose slightly — as did all the other indicators except that for Chained CPI.
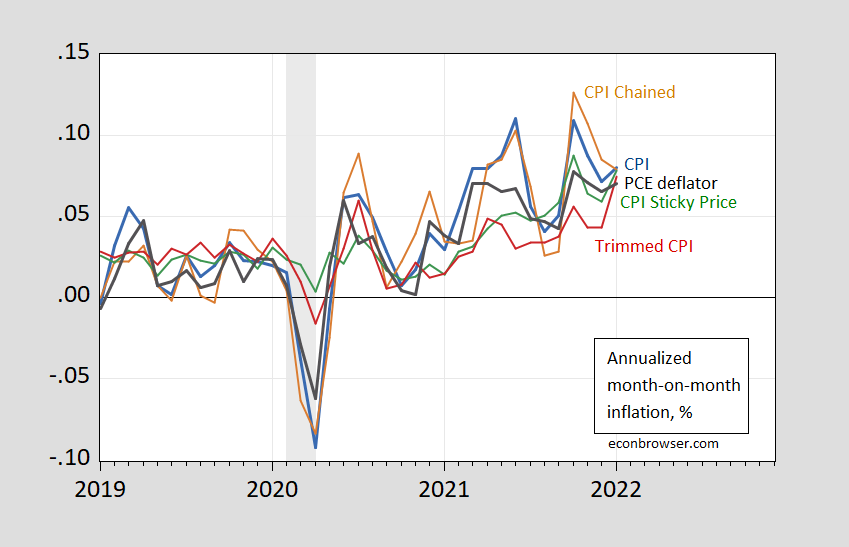
Figure 2: Month-on-month inflation of CPI (blue), chained CPI (brown), 16% trimmed CPI inflation (red), sticky price CPI inflation (green), personal consumption expenditure deflator inflation (black), all in decimal form (i.e., 0.05 means 5%). Chained CPI seasonally adjusted using arithmetic deviations (brown). NBER defined recession dates (peak-to-trough) shaded gray. Source: BLS, BEA, Atlanta Fed, NBER, and author’s calculations.
The saving rate was last reported at 6.4%, the lowest since late 2013. The recent decline is partly due to rising prices, partly due to declining transfers. Tax refunds may raise the saving rate a bit – the last dollop of Covid payments through tax filings – but then we are likely to see an increased drag on spending due to budget constraints in the lower half of incomes.
While I’d prefer transfers to lower income households to continue, with rate hikes to limit credit-financed spending, that’s pie-in-the-sky. In reality, I suspect the Fed will find itself getting help from household budgets in bringing inflation down. Sucks to be poor.
Off topic, but I did not comment yesterday, no comment on that. I am putting this up on Facebook, Econospeak (not there yet) and other locations.
The US and UK have been violating the Budapest Accord of 1994 since 2014 by failing to protect the sovereignty and territorial integrity of Ukraine against Russian attack under Putin, which all three promised to protect when Ukraine gave up the third largest nuclear weapons stock in the world. The US and UK are now also violating that accord by doing so little to protect Ukraine against Putin’s current invasion. They can do something substantial: declare a no fly zone they probably have the ability to enforce. This is not about NATO or boots on the ground. It is about right and wrong and planes in the air.
A no fly zone sounds like a very good idea. Of course declaring it without some enforcement mechanism would be hollow. Are you suggesting we send war planes over Ukraine or shooting missiles at Russian planes?
Shhhh!!!!!! Everyone!!! Be very quiet…….. The “expert” on Russia is about to speak/type, and I have this sixth sense it’s going to be incredibly entertaining.
Thinking of you and your family. Please be well.
The Nuclear Option.
If you don’t let him have what he wants, he’ll destroy mankind.
Dr. Putin: Or, how I learned to stop worrying and love the bomb.
Russia nuclear forces placed on high alert.
You are a disgusting traitor. Putin would be mad to do mutual destruction. He’s bluffing and you are repeating his bluff. Maybe it is time to ban Putin’s poodles if people like you keep this garbage up.
https://jabberwocking.com/new-studies-confirm-that-covid-19-virus-occurred-naturally/
It seems the evidence indicates that COVID-19 began at the food market and not that lab. It would be nice if Princeton Steve conceded he was wrong all along. But given what a pompous weasel he is – I am not holding my breath.
This is impossible. It completely contradicts what Barkley Rosser and David Ignatius have been insisting on for way over a year, which makes what the New York Times is saying scientifically impossible. Because….. well…….. Barkley Junior and Ignatius are, like, geniuses….. and stuff.
Moses,
Why do you persist in lying about what I say here? I know you are into this petty gotcha game rather than trying to deal with facts. I have always said that we did not know. I never said (and neither did Ignatius) that it definitely came out of a lab.
Latest evidence makes it look more likely it came from the market. Fine. We did not have that evidence previously. You need to stop lying and distorting what I say. It is truly disgusting. But that is what someone does who inhabits a moral vomitorium as you do.
I knew eventually the tin salesman wearing parson’s attire would see the light from above. Added bonus is, you gave me a few side-ache chuckles in the process. If you’d like I can pull up those old permalinks where you stated “we just don’t know”. You just give the word that you want to see those and I’ll hunt them down. Careful now before you insist, because the general gist of the comments might be “a little different” than “we just don’t know”. Always fun Junior.
https://www.cnn.com/2022/02/26/politics/russian-ukraine-resistance/index.html
This CNN report casts some doubt that the vaunted Russian army will prevail. The doubters of the Ukrainian people must be worried that their vaunted pictures of doom are not playing out the way they predicted. And of course the Putin-Trump fanboys here may very well be disappointed that Putin was not so smart with this invasion.
did anyone notice the deflator revisions on the 4th quarter GDP report? here are the relevant paragraphs from what i wrote about it, with more tedious detail than you all need…
….the change in the price index for personal consumption expenditures was revised from a 6.5% rate in the advance estimate to a 6.3% rate in this month’s report; that change was driven by a downward revision of the change in the price index for non-durable goods from an 11.0% rate to one of 9.8%, while the price index change for PCE services was revised from 4.3% to a 4.4% rate….at the same time, the change in the price index for fixed investment was revised from 8.0% to 8.9%; most notable among the revisions of its component indexes was the change in the deflator for residential investment, which was revised from 9.5% to a 12.1% rate…there were also revisions to the deflators for exports and imports; the export deflator was revised from 5.9% to 6.4%, while the import deflator was revised from 5.8% to 5.6%; the effect of those revisions would be to lower real exports while increasing real imports…there were also revisions to the deflators used on government consumption and investment; the overall government outlays deflator went from 7.4% to 7.7%, as the deflator for non-defense federal government outlays was revised from 5.4% to 6.1%…incorporating the effect of all those component deflators meant that the deflator for GDP overall was revised from the the 6.9% rate indicated by the advance estimate to a 7.1% rate with this month’s estimate….in the more than half dozen years i’ve been checking this metric, i’ve rarely seen deflator revisions greater than ±0.1%…you can view the deflators used in the advance estimate in table 4 here, while the deflators used in this month’s estimate are in table 4 here…
normally, we would expect an upward revision in a deflator to result in a corresponding downward revision to its associated real component, and vice-versa, simply because these deflators correspond directly to the chained dollar inflation factor used to convert the change in nominal dollar spending into the change in the real component, thus indicating the change in output of the associated GDP component…that played out for some of the revisions we have noted; for instance, the revision in the deflator for non-durable goods from 11.0% to 9.8% was coincidental with a revision in the real growth of non-durable goods from a 0.1% contraction to growth at an 0.8% rate…on the other hand, the revisions to some deflators seemed to have the opposite effect that one would expect; the revision in the deflator for residential investment from 9.5% to 12.1% coincided with an upward revision to real residential from a contraction at a 0.8% annual rate to growth at a 1.0% rate…
the BEA doesn’t give much information on the reason for the unprecedentedly large revision to those deflators; at one point, in addressing the downward revision to the PCE price index change, they mention a downward revision in the consumer price index for gasoline in the technical notes accompanying this month’s report (pdf), but gasoline only accounts around 2% of GDP and 3% of PCE, certainly not large enough to move the overall needle 0.2%…for the most part, the deflators used for GDP are derived from data provided by the Bureau of Labor Statistics in their monthly releases of the Consumer Price Index, the Producer Price Index, and the Import-Export Price Index, which did undergo annual revisions to seasonal adjustment data in January, which the BLS does every year, and i have noted inordinately large revisions to seasonal adjustments this year, not just for prices, but also for other economic metrics, including most notably employment..
to compute to compute this year’s revisions to seasonal adjustments, the historical data being used now includes almost two years of data that has been impacted by the pandemic, and that adjustment is being applied to new data as if all the impacts were due to seasonal changes…the result is that most data from months when the pandemic has been severe, ie, generally November through February, has been revised upward, or reported higher, whereas data from the months when the pandemic has historically ebbed, ie, May, June, and July, is being revised lower, and thus i expect those months will be reported lower going forward…similarly, the supply chain shortages that arose in the wake of the pandemic certainly had an inordinately large impact on prices that would have been incorporated into the seasonal adjustments that certainly weren’t seasonal in nature….but i can’t see any easy fix to that problem; how one could separate out the impacts of the pandemic from those due to real seasonal factors; ie, how could one tell whether people shopped less in January because of Covid, or because of the bad weather?