Reader Michael writes:
…high income wage growth has grown much faster than medium and low income wage growth patterns.
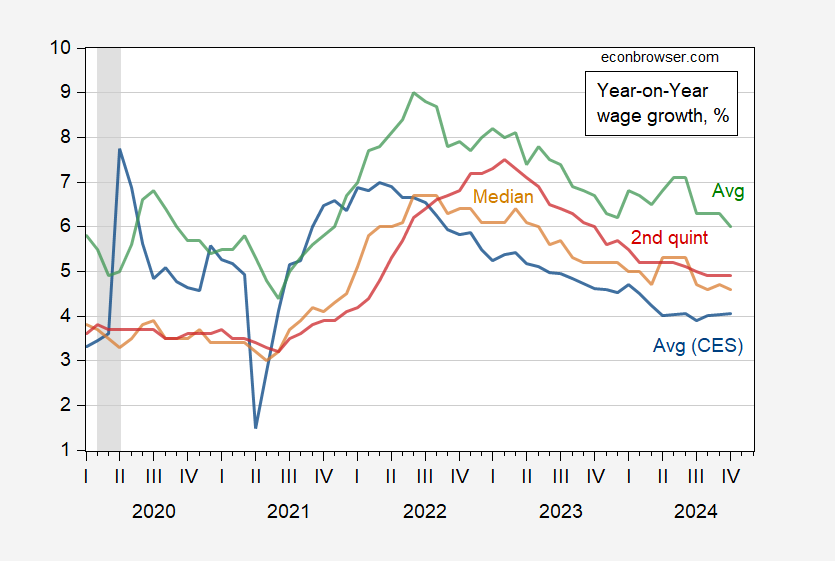
Here’s a stab at taking a look at the data. First wages:
Figure 1: Year-on-Year growth rate in average hourly earnings from CES (blue), average wage from CPS (green), median wage from CPS (tan), from 2nd quintile (red), all in %. NBER defined peak-to-trough recession dates shaded gray. Source: BLS, Philadelphia Fed Wage Tracker, NBER, and author’s calculations.
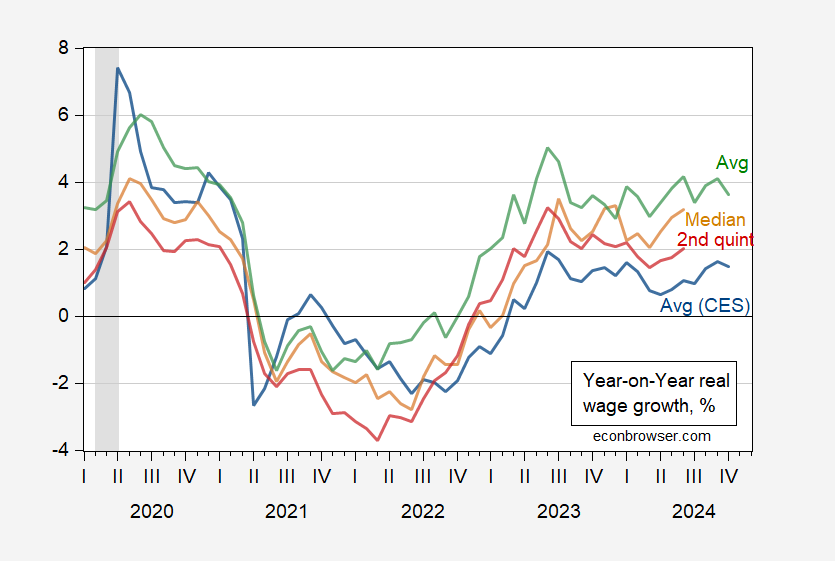
What about relative to inflation? Here, one would try to match up with the most appropriate deflators. Here’s my attempt.
Figure 2: Year-on-Year growth rate in average hourly earnings from CES, deflated by CPI-U (blue), average wage from CPS, deflated by CPI-wage earners (green), median wage from CPS, deflated by median household income CPI (tan), from 2nd quintile deflated by 2nd quintile household income CPI (red), all in %. NBER defined peak-to-trough recession dates shaded gray. Source: BLS, Philadelphia Fed Wage Tracker, BLS, NBER, and author’s calculations.
So year-on-year real wage growth has been positive from between 2022M10 to 2023M02 onward.


Off topic – Iran’s nuclear program:
https://www.spglobal.com/commodityinsights/en/market-insights/latest-news/electric-power/112724-iran-brings-thousands-of-centrifuges-online-defying-international-atomic-energy-agency-resolution
In hunting for causality, things are not entirely clear. The decision to expand Iran’s nuclear program came prior to Trump’s election, but at a time when his election seemed a reasonable likelihood. The decision also followed censure by the IAEA. Israel’s engagement in war with Iranian proxies, with war crimes a routine part of Israel’s behavior, may have something to do with Iran’s choice – Iran’s rhetoric makes it seem so, but Iran’s rhetoric is pretty consistent, so not a great metric.
Anyhow, Iran is boosting its capacity to enrich nuclear fuel just as Trump is about to return to the White House.
What Michael is probably referring to is household income growth by quintiles. Over the long term, there is no doubt that the uppermost slices of the income distribution have pulled away from the lower quintiles; see, e.g., here:
https://www.advisorperspectives.com/dshort/updates/2023/09/13/u-s-household-incomes-a-50-year-perspective
But since the pandemic, lower quintiles have improved better than the uppermost slices. The Census Bureau oddly didn’t include a graph in its 2024 report, but the data is still there in Table A-3:
https://www2.census.gov/programs-surveys/demo/tables/p60/282/tableA3.xlsx
A quick and dirty way of showing a similar result, namely that lower income wage earners have made up ground compared with upper income wage earners, is to compare average hourly earnings of nonsupervisory workers with that of all earners:
https://fred.stlouisfed.org/graph/fredgraph.png?g=1BS3q
The difference between the two, by definition, is wage earnings by supervisory workers, who presumably are higher paid. Since wage growth for nonsupervisory workers has increased more than growth including supervisory workers, by definition mean growth in pay for supervisors has lagged.
It would have been interesting to see what the Labor Department’s minimum-salary rule for overtime hours would have done, but we may not get the chance:
https://natlawreview.com/article/not-so-final-texas-court-vacates-dols-2024-final-overtime-rule
On topic – Lori Chavez-DeRemer nominated to run the Labor Department. She’s about as labor-friendly as any Republican these days.