Here are some key indicators followed by NBER’s BCDC, including employment for November (227K vs. 202K consensus, 194K vs. 160K consensus, for NFP, and private NFP respectively).
Figure 1: Nonfarm Payroll (NFP) employment from CES (blue), implied NFP from preliminary benchmark (bold blue), civilian employment (orange), industrial production (red), personal income excluding current transfers in Ch.2017$ (bold light green), manufacturing and trade sales in Ch.2017$ (black), consumption in Ch.2017$ (light blue), and monthly GDP in Ch.2017$ (pink), GDP (blue bars), all log normalized to 2021M11=0. Source: BLS via FRED, Federal Reserve, BEA 2024Q3 2nd release, S&P Global Market Insights (nee Macroeconomic Advisers, IHS Markit) (12/2/2024 release), and author’s calculations.
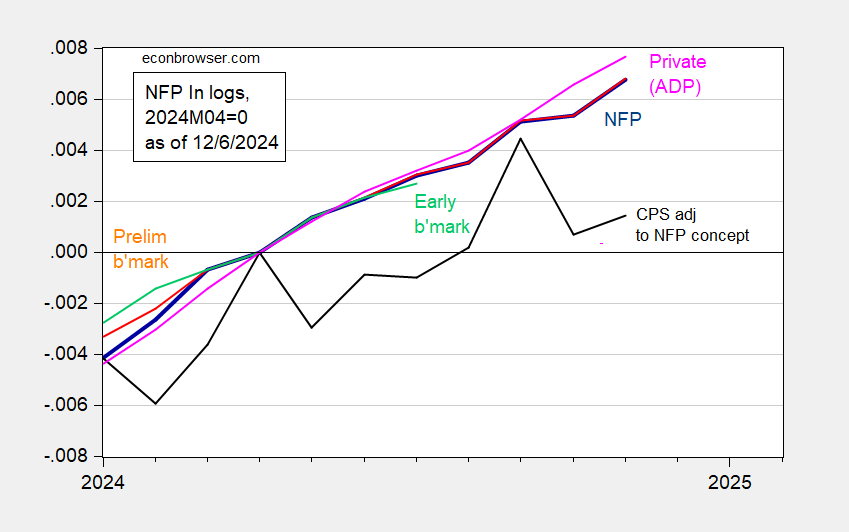
What about the reliability of employment data? Here’s some measures of employment from the two BLS surveys, and a measure of private NFP from ADP, all normalized to 2024M04=0 (DiMartino Booth asserts the recession started then).
Figure 2: Nonfarm Payroll (NFP) employment from CES (blue), from implied preliminary benchmark (orange), Philadelphia Fed early benchmark (light green), from CPS adjusted to NFP concept (black), private NFP from ADP-Stanford Digital Economic Lab (pink), all in logs 2024M04=0. Source: BLS, ADP via FRED, BLS, Philadelphia Fed, and author’s calculations.
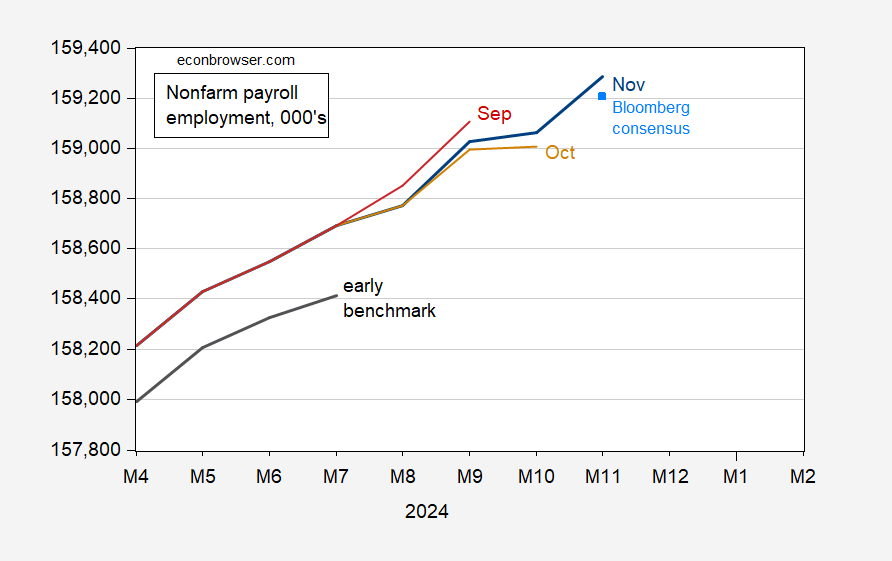
Here’s a picture of various vintages of NFP, compared to consensus, and early benchmark.
Figure 3: Nonfarm payroll employment, November release (blue), Bloomberg consensus of 12/5 (light blue square), October release (tan), September release (red), early benchmark (black). Bloomberg consensus NFP level calculated by iterating consensus growth on reported October release level. Early benchmark NFP calculated by applying ratio of early benchmark sum of states to CES sum of states to reported national NFP. Source: BLS, Philadelphia Fed, Bloomberg, author’s calculations.


Payroll jobs up 227,000 in November vs up 36,000 in October – messed up by weather. The 3-month-average pace of job gain as of November was 173,000 vs 159,000 in Q3, so the slowdown in hiring is…slowing.
Retail employment fell by 28,000 after seasonal adjustment. Similar declines were posted in the prior two Novembers, suggesting an adjustment problem, but also reflecting a general slowing trend in holiday retail hiring. Prior to seasonal adjustment, retail jobs were up 280,500 in November, better than in November of 2022, but otherwise the smallest November gain since 2009. November is the biggest month for retail hiring, so is most subject to seasonal misses.
Factory employment was up 22,000, contrary to the decline reported by ADP. That’s pretty obviously the effect of a rebound in jobs after the floods of October. The 2-month average change in factory jobs is -23,000.
Average hourly earnings were up 0.4%, up 0.3% for non-supervisory workers – both probably outpacing inflation. The index of aggregate weekly hours rose 0.4%, more than offsetting the 0.3% drop in October. Volatility in this series is another effect of flooding in October. The two-month gain means labor is a positive input to production so far in Q4.
Revisions to household survey data are due in next month’s report, so brace yourselves for more “the kids at BLS are low-down figure fudgers!” stuff from the actual low-down figure fudgers.