Year-on-Year looks better.
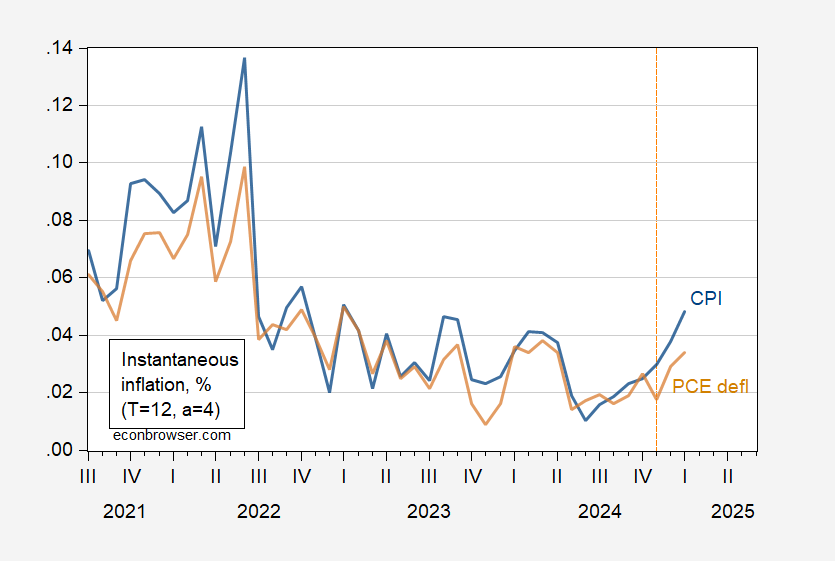
Figure 1: Instantaneous inflation per Eeckhout (2023) for CPI (blue) PCE deflator (green), PCE deflator (brown). Source: BLS, BEA via FRED, and author’s calculations.
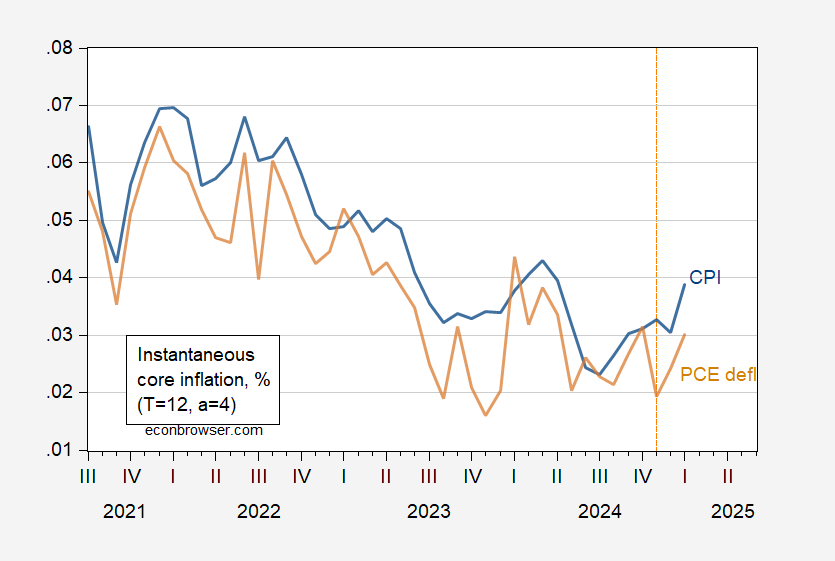
Figure 2: Instantaneous core inflation per Eeckhout (2023) for CPI (blue) PCE deflator (green), PCE deflator (brown). Source: BLS, BEA via FRED, and author’s calculations.